
Key Insights
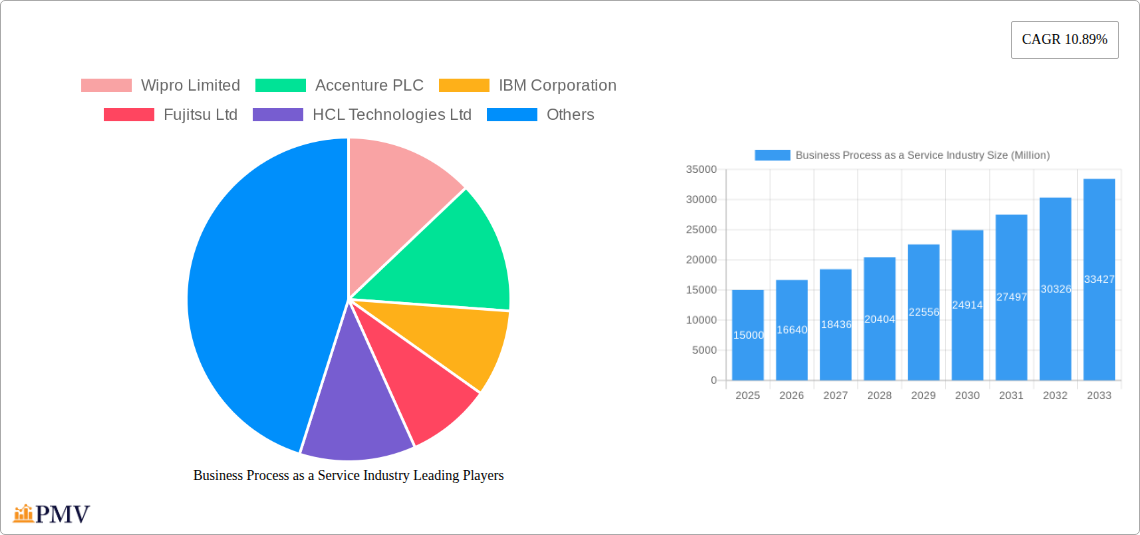
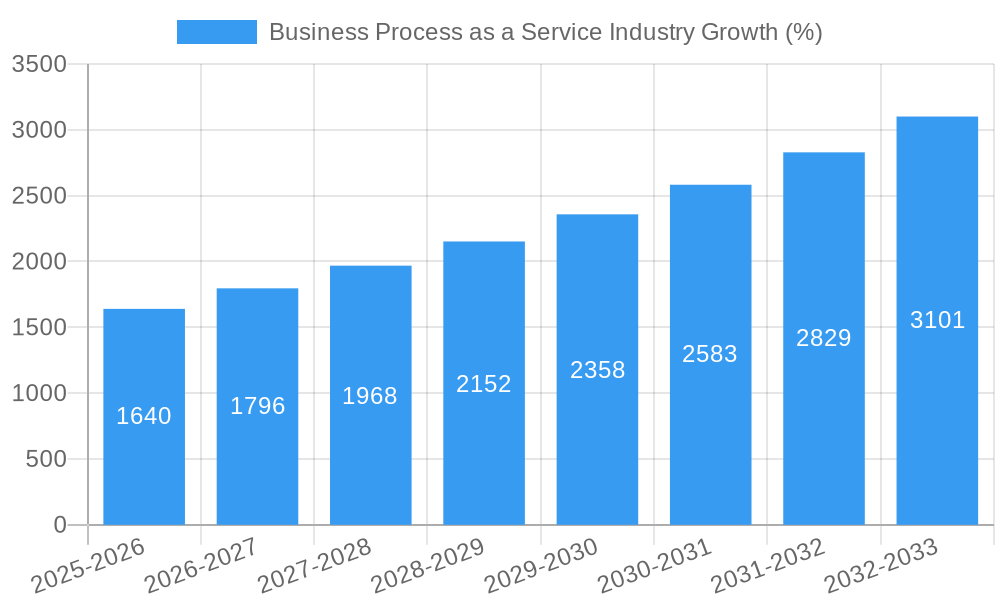
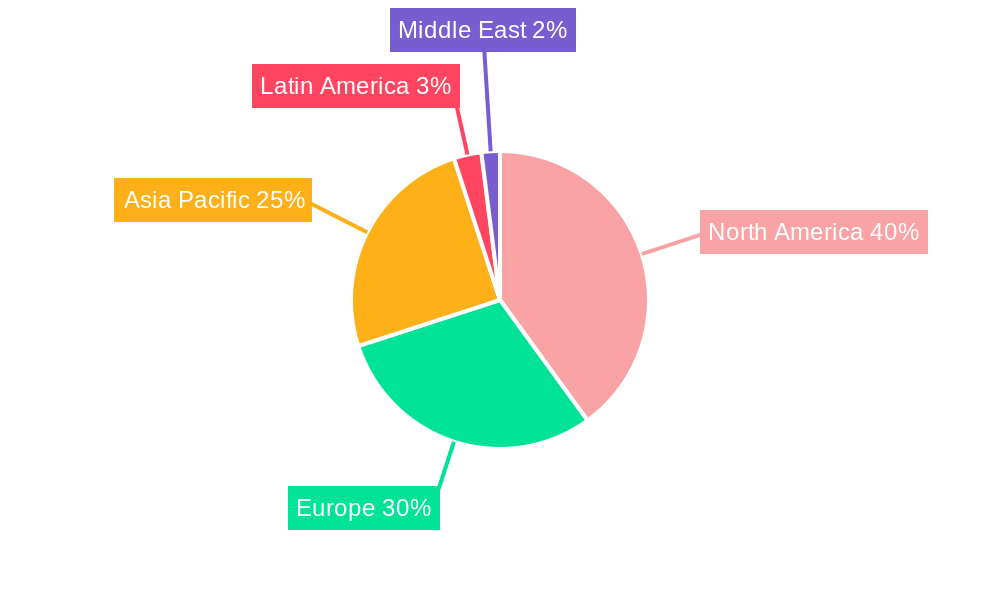
The Business Process as a Service (BPaaS) market is experiencing robust growth, driven by the increasing adoption of cloud-based solutions, the need for improved operational efficiency, and the rising demand for specialized expertise across various industries. The market's Compound Annual Growth Rate (CAGR) of 10.89% from 2019 to 2024 suggests a significant expansion, and this growth trajectory is expected to continue through 2033. Key drivers include the desire for reduced IT infrastructure costs, enhanced scalability and flexibility, and access to a global talent pool. The BFSI, healthcare, and IT sectors are major contributors to this growth, leveraging BPaaS for tasks ranging from customer relationship management and data analytics to human resource management and supply chain optimization. The increasing preference for outsourcing non-core functions allows businesses to focus on strategic initiatives and gain a competitive edge. Large enterprises currently dominate the market, but the growing adoption of BPaaS by small and medium organizations is expected to fuel further market expansion in the coming years. The global nature of this market is evident in the regional breakdown, with North America and Europe currently holding significant market share, although the Asia-Pacific region is expected to witness substantial growth driven by the increasing digitalization and technological advancements in countries like India and China.
The segmentation of the BPaaS market reveals diverse opportunities. While Human Resource Management, Accounting and Finance, and Sales and Marketing are significant segments, the "Other Processes" category indicates a growing breadth of applications for BPaaS across various business functions. The presence of major players like Wipro, Accenture, IBM, and TCS underscores the market’s maturity and the intense competition within it. Despite the competitive landscape, the overall market is characterized by significant opportunities for growth and innovation, fueled by ongoing technological advancements, evolving business needs, and the increasing preference for agile and cost-effective solutions. The continued development of sophisticated AI-powered BPaaS offerings will further drive market expansion and enhance the value proposition for businesses of all sizes. Successful players will need to differentiate themselves through specialized expertise, advanced technological capabilities, and a strong focus on delivering exceptional customer service.
Business Process as a Service (BPaaS) Industry Market Report: 2019-2033
This comprehensive report provides a detailed analysis of the Business Process as a Service (BPaaS) industry, projecting a market value exceeding $XX Million by 2033. It covers market structure, competitive dynamics, industry trends, dominant segments, product innovations, and key players, offering invaluable insights for businesses and investors. The study period spans 2019-2033, with 2025 as the base and estimated year.
Business Process as a Service Industry Market Structure & Competitive Dynamics
The BPaaS market is characterized by a moderately concentrated structure, with several multinational corporations holding significant market share. Key players include Wipro Limited, Accenture PLC, IBM Corporation, Fujitsu Ltd, HCL Technologies Ltd, Tata Consultancy Services Limited, Oracle Corporation, Capgemini SE, Cognizant Technology Solutions, and Genpact Limited. However, the market also includes numerous smaller niche players.
Market share is dynamic, with ongoing competition driven by innovation and mergers & acquisitions (M&A). Recent M&A activity has involved deals valued at over $XX Million, primarily focused on expanding service offerings and geographic reach. The regulatory framework varies across regions, impacting market access and compliance. Product substitutes include in-house process management, but BPaaS offers advantages in scalability, cost-effectiveness, and specialized expertise. End-user trends show increasing adoption of cloud-based solutions and a preference for integrated, automated processes.
Business Process as a Service Industry Industry Trends & Insights
The BPaaS market exhibits robust growth, projected to achieve a CAGR of XX% during the forecast period (2025-2033). Key growth drivers include the increasing adoption of cloud computing, rising demand for automation and digital transformation across various industries, and the growing need for improved operational efficiency. Technological disruptions, such as the rise of Artificial Intelligence (AI) and machine learning (ML), are significantly shaping the industry landscape. Consumer preferences are shifting towards flexible, scalable, and cost-effective solutions. Competitive dynamics are intense, with companies continuously innovating to offer differentiated services and gain market share. Market penetration is highest in developed economies, but growth potential is significant in emerging markets.
Dominant Markets & Segments in Business Process as a Service Industry
By End-user Industry: The BFSI sector represents a dominant market segment, driven by stringent regulatory compliance requirements and the need for robust security measures. The healthcare sector is also a significant segment, driven by increasing data volumes and the need for improved patient care. Government and defense also show considerable growth due to digitization efforts and increasing reliance on IT infrastructure.
By Size of Organization: Large enterprises account for a larger market share, owing to their higher budgets and complex process management needs. However, SMEs are increasingly adopting BPaaS solutions, driven by the need to improve operational efficiency and reduce costs.
By Process: Accounting and Finance, Human Resource Management, and Supply Chain Management are the dominant process segments. The increasing complexity of these processes and the need for specialized expertise are key drivers.
The growth of specific segments is influenced by various factors such as economic policies promoting digital adoption, well-developed IT infrastructure, and favorable regulatory environments.
Business Process as a Service Industry Product Innovations
Recent product innovations focus on AI-powered automation, integrated platforms, and enhanced security features. Companies are integrating AI and ML to automate tasks, improve efficiency, and reduce costs. Cloud-based solutions are gaining traction, offering flexibility and scalability. The competitive advantage lies in offering tailored solutions that address specific industry needs and providing high-level security to maintain data integrity.
Report Segmentation & Scope
This report segments the BPaaS market by end-user industry (Government and Defense, BFSI, IT & Telecommunication, Healthcare, Retail, Manufacturing, Other), by organization size (Small and Medium Organizations, Large Enterprises), and by process (Human Resource Management, Accounting and Finance, Sales and Marketing, Supply Chain Management, Other). Each segment is analyzed in terms of market size, growth projections, and competitive dynamics. Growth projections vary across segments, reflecting differing levels of adoption and technological maturity.
Key Drivers of Business Process as a Service Industry Growth
Several factors drive BPaaS market growth. Technological advancements like AI, automation, and cloud computing enhance efficiency and productivity. Economic factors such as cost reduction pressures and the need for improved ROI fuel adoption. Furthermore, regulatory changes mandating data security and compliance accelerate the demand for secure BPaaS solutions. The push for digital transformation across various industries also contributes to market expansion.
Challenges in the Business Process as a Service Industry Sector
The BPaaS industry faces challenges such as data security and privacy concerns, complexities in integrating with legacy systems, and the need to manage fluctuating demand. Supply chain disruptions can impact service delivery. Intense competition and the need to constantly innovate pose ongoing challenges. These factors impact market growth, requiring companies to invest in robust security measures and flexible infrastructure.
Leading Players in the Business Process as a Service Industry Market
- Wipro Limited
- Accenture PLC
- IBM Corporation
- Fujitsu Ltd
- HCL Technologies Ltd
- Tata Consultancy Services Limited
- Oracle Corporation
- Capgemini SE
- Cognizant Technology Solutions
- Genpact Limited
Key Developments in Business Process as a Service Industry Sector
November 2022: Infosys BPM and IBM launch an AI and automation center in Poland, offering solutions leveraging IBM CloudPak, Watson, Blockchain, and Sterling Supply Chain, alongside Infosys' intelligent processing and analytics tools. This signifies a significant push towards AI-driven BPaaS solutions.
May 2022: Oracle enhances its cloud security capabilities with integrated threat management, improving application and data protection within its Oracle Cloud Infrastructure (OCI). This strengthens its competitive position in the secure BPaaS market.
April 2022: Fujitsu launches its Computing as a Service (CaaS) portfolio, accelerating digital transformation through cloud access to advanced computing technologies. This expansion reflects the increasing demand for cloud-based BPaaS services.
March 2022: Oracle Cloud Infrastructure expands with new computing, networking, and storage services, offering customers greater flexibility and cost optimization. This strengthens OCI's position as a leading platform for BPaaS solutions.
Strategic Business Process as a Service Industry Market Outlook
The BPaaS market holds significant future potential, driven by ongoing technological advancements, increasing digital adoption, and the growing need for efficient and secure business processes. Strategic opportunities lie in developing AI-powered solutions, expanding into new markets, and offering customized services to meet specific industry needs. Focus on security and compliance will be critical for sustained growth. The market is poised for continuous expansion, driven by ongoing digital transformation initiatives worldwide.
Business Process as a Service Industry Segmentation
-
1. Size of Organization
- 1.1. Small and Medium Organizations
- 1.2. Large Enterprises
-
2. Process
- 2.1. Human Resource Management
- 2.2. Accounting and Finance
- 2.3. Sales and Marketing
- 2.4. Supply Chain Management
- 2.5. Other Processes
-
3. End-user Industry
- 3.1. Government and Defense
- 3.2. Banking, Financial Services and Insurance (BFSI)
- 3.3. IT and Telecommunication
- 3.4. Healthcare
- 3.5. Retail
- 3.6. Manufacturing
- 3.7. Other End-user Industries
Business Process as a Service Industry Segmentation By Geography
-
1. North America
- 1.1. United States
- 1.2. Canada
-
2. Europe
- 2.1. United Kingdom
- 2.2. Germany
- 2.3. France
- 2.4. Rest of Europe
-
3. Asia Pacific
- 3.1. China
- 3.2. India
- 3.3. Japan
- 3.4. Rest of Asia Pacific
- 4. Latin America
- 5. Middle East
Business Process as a Service Industry REPORT HIGHLIGHTS
| Aspects | Details |
|---|---|
| Study Period | 2019-2033 |
| Base Year | 2024 |
| Estimated Year | 2025 |
| Forecast Period | 2025-2033 |
| Historical Period | 2019-2024 |
| Growth Rate | CAGR of 10.89% from 2019-2033 |
| Segmentation |
|
Table of Contents
- 1. Introduction
- 1.1. Research Scope
- 1.2. Market Segmentation
- 1.3. Research Methodology
- 1.4. Definitions and Assumptions
- 2. Executive Summary
- 2.1. Introduction
- 3. Market Dynamics
- 3.1. Introduction
- 3.2. Market Drivers
- 3.2.1. Growing Demand for Cloud Services and Standard Operating Processes; Rising Need for the Reduction of Operational Costs and Improvement of Productivity
- 3.3. Market Restrains
- 3.3.1. Managing Regulatory and Compliance Needs Across the World
- 3.4. Market Trends
- 3.4.1. Reduction of Operational Costs and Productivity Improvement to Drive the Market
- 4. Market Factor Analysis
- 4.1. Porters Five Forces
- 4.2. Supply/Value Chain
- 4.3. PESTEL analysis
- 4.4. Market Entropy
- 4.5. Patent/Trademark Analysis
- 5. Global Business Process as a Service Industry Analysis, Insights and Forecast, 2019-2031
- 5.1. Market Analysis, Insights and Forecast - by Size of Organization
- 5.1.1. Small and Medium Organizations
- 5.1.2. Large Enterprises
- 5.2. Market Analysis, Insights and Forecast - by Process
- 5.2.1. Human Resource Management
- 5.2.2. Accounting and Finance
- 5.2.3. Sales and Marketing
- 5.2.4. Supply Chain Management
- 5.2.5. Other Processes
- 5.3. Market Analysis, Insights and Forecast - by End-user Industry
- 5.3.1. Government and Defense
- 5.3.2. Banking, Financial Services and Insurance (BFSI)
- 5.3.3. IT and Telecommunication
- 5.3.4. Healthcare
- 5.3.5. Retail
- 5.3.6. Manufacturing
- 5.3.7. Other End-user Industries
- 5.4. Market Analysis, Insights and Forecast - by Region
- 5.4.1. North America
- 5.4.2. Europe
- 5.4.3. Asia Pacific
- 5.4.4. Latin America
- 5.4.5. Middle East
- 5.1. Market Analysis, Insights and Forecast - by Size of Organization
- 6. North America Business Process as a Service Industry Analysis, Insights and Forecast, 2019-2031
- 6.1. Market Analysis, Insights and Forecast - by Size of Organization
- 6.1.1. Small and Medium Organizations
- 6.1.2. Large Enterprises
- 6.2. Market Analysis, Insights and Forecast - by Process
- 6.2.1. Human Resource Management
- 6.2.2. Accounting and Finance
- 6.2.3. Sales and Marketing
- 6.2.4. Supply Chain Management
- 6.2.5. Other Processes
- 6.3. Market Analysis, Insights and Forecast - by End-user Industry
- 6.3.1. Government and Defense
- 6.3.2. Banking, Financial Services and Insurance (BFSI)
- 6.3.3. IT and Telecommunication
- 6.3.4. Healthcare
- 6.3.5. Retail
- 6.3.6. Manufacturing
- 6.3.7. Other End-user Industries
- 6.1. Market Analysis, Insights and Forecast - by Size of Organization
- 7. Europe Business Process as a Service Industry Analysis, Insights and Forecast, 2019-2031
- 7.1. Market Analysis, Insights and Forecast - by Size of Organization
- 7.1.1. Small and Medium Organizations
- 7.1.2. Large Enterprises
- 7.2. Market Analysis, Insights and Forecast - by Process
- 7.2.1. Human Resource Management
- 7.2.2. Accounting and Finance
- 7.2.3. Sales and Marketing
- 7.2.4. Supply Chain Management
- 7.2.5. Other Processes
- 7.3. Market Analysis, Insights and Forecast - by End-user Industry
- 7.3.1. Government and Defense
- 7.3.2. Banking, Financial Services and Insurance (BFSI)
- 7.3.3. IT and Telecommunication
- 7.3.4. Healthcare
- 7.3.5. Retail
- 7.3.6. Manufacturing
- 7.3.7. Other End-user Industries
- 7.1. Market Analysis, Insights and Forecast - by Size of Organization
- 8. Asia Pacific Business Process as a Service Industry Analysis, Insights and Forecast, 2019-2031
- 8.1. Market Analysis, Insights and Forecast - by Size of Organization
- 8.1.1. Small and Medium Organizations
- 8.1.2. Large Enterprises
- 8.2. Market Analysis, Insights and Forecast - by Process
- 8.2.1. Human Resource Management
- 8.2.2. Accounting and Finance
- 8.2.3. Sales and Marketing
- 8.2.4. Supply Chain Management
- 8.2.5. Other Processes
- 8.3. Market Analysis, Insights and Forecast - by End-user Industry
- 8.3.1. Government and Defense
- 8.3.2. Banking, Financial Services and Insurance (BFSI)
- 8.3.3. IT and Telecommunication
- 8.3.4. Healthcare
- 8.3.5. Retail
- 8.3.6. Manufacturing
- 8.3.7. Other End-user Industries
- 8.1. Market Analysis, Insights and Forecast - by Size of Organization
- 9. Latin America Business Process as a Service Industry Analysis, Insights and Forecast, 2019-2031
- 9.1. Market Analysis, Insights and Forecast - by Size of Organization
- 9.1.1. Small and Medium Organizations
- 9.1.2. Large Enterprises
- 9.2. Market Analysis, Insights and Forecast - by Process
- 9.2.1. Human Resource Management
- 9.2.2. Accounting and Finance
- 9.2.3. Sales and Marketing
- 9.2.4. Supply Chain Management
- 9.2.5. Other Processes
- 9.3. Market Analysis, Insights and Forecast - by End-user Industry
- 9.3.1. Government and Defense
- 9.3.2. Banking, Financial Services and Insurance (BFSI)
- 9.3.3. IT and Telecommunication
- 9.3.4. Healthcare
- 9.3.5. Retail
- 9.3.6. Manufacturing
- 9.3.7. Other End-user Industries
- 9.1. Market Analysis, Insights and Forecast - by Size of Organization
- 10. Middle East Business Process as a Service Industry Analysis, Insights and Forecast, 2019-2031
- 10.1. Market Analysis, Insights and Forecast - by Size of Organization
- 10.1.1. Small and Medium Organizations
- 10.1.2. Large Enterprises
- 10.2. Market Analysis, Insights and Forecast - by Process
- 10.2.1. Human Resource Management
- 10.2.2. Accounting and Finance
- 10.2.3. Sales and Marketing
- 10.2.4. Supply Chain Management
- 10.2.5. Other Processes
- 10.3. Market Analysis, Insights and Forecast - by End-user Industry
- 10.3.1. Government and Defense
- 10.3.2. Banking, Financial Services and Insurance (BFSI)
- 10.3.3. IT and Telecommunication
- 10.3.4. Healthcare
- 10.3.5. Retail
- 10.3.6. Manufacturing
- 10.3.7. Other End-user Industries
- 10.1. Market Analysis, Insights and Forecast - by Size of Organization
- 11. North America Business Process as a Service Industry Analysis, Insights and Forecast, 2019-2031
- 11.1. Market Analysis, Insights and Forecast - By Country/Sub-region
- 11.1.1 United States
- 11.1.2 Canada
- 12. Europe Business Process as a Service Industry Analysis, Insights and Forecast, 2019-2031
- 12.1. Market Analysis, Insights and Forecast - By Country/Sub-region
- 12.1.1 United Kingdom
- 12.1.2 Germany
- 12.1.3 France
- 12.1.4 Rest of Europe
- 13. Asia Pacific Business Process as a Service Industry Analysis, Insights and Forecast, 2019-2031
- 13.1. Market Analysis, Insights and Forecast - By Country/Sub-region
- 13.1.1 China
- 13.1.2 India
- 13.1.3 Japan
- 13.1.4 Rest of Asia Pacific
- 14. Latin America Business Process as a Service Industry Analysis, Insights and Forecast, 2019-2031
- 14.1. Market Analysis, Insights and Forecast - By Country/Sub-region
- 14.1.1.
- 15. Middle East Business Process as a Service Industry Analysis, Insights and Forecast, 2019-2031
- 15.1. Market Analysis, Insights and Forecast - By Country/Sub-region
- 15.1.1.
- 16. Competitive Analysis
- 16.1. Global Market Share Analysis 2024
- 16.2. Company Profiles
- 16.2.1 Wipro Limited
- 16.2.1.1. Overview
- 16.2.1.2. Products
- 16.2.1.3. SWOT Analysis
- 16.2.1.4. Recent Developments
- 16.2.1.5. Financials (Based on Availability)
- 16.2.2 Accenture PLC
- 16.2.2.1. Overview
- 16.2.2.2. Products
- 16.2.2.3. SWOT Analysis
- 16.2.2.4. Recent Developments
- 16.2.2.5. Financials (Based on Availability)
- 16.2.3 IBM Corporation
- 16.2.3.1. Overview
- 16.2.3.2. Products
- 16.2.3.3. SWOT Analysis
- 16.2.3.4. Recent Developments
- 16.2.3.5. Financials (Based on Availability)
- 16.2.4 Fujitsu Ltd
- 16.2.4.1. Overview
- 16.2.4.2. Products
- 16.2.4.3. SWOT Analysis
- 16.2.4.4. Recent Developments
- 16.2.4.5. Financials (Based on Availability)
- 16.2.5 HCL Technologies Ltd
- 16.2.5.1. Overview
- 16.2.5.2. Products
- 16.2.5.3. SWOT Analysis
- 16.2.5.4. Recent Developments
- 16.2.5.5. Financials (Based on Availability)
- 16.2.6 Tata Consultancy Services Limited
- 16.2.6.1. Overview
- 16.2.6.2. Products
- 16.2.6.3. SWOT Analysis
- 16.2.6.4. Recent Developments
- 16.2.6.5. Financials (Based on Availability)
- 16.2.7 Oracle Corporation
- 16.2.7.1. Overview
- 16.2.7.2. Products
- 16.2.7.3. SWOT Analysis
- 16.2.7.4. Recent Developments
- 16.2.7.5. Financials (Based on Availability)
- 16.2.8 Capgemini SE*List Not Exhaustive
- 16.2.8.1. Overview
- 16.2.8.2. Products
- 16.2.8.3. SWOT Analysis
- 16.2.8.4. Recent Developments
- 16.2.8.5. Financials (Based on Availability)
- 16.2.9 Cognizant Technology Solutions
- 16.2.9.1. Overview
- 16.2.9.2. Products
- 16.2.9.3. SWOT Analysis
- 16.2.9.4. Recent Developments
- 16.2.9.5. Financials (Based on Availability)
- 16.2.10 Genpact Limited
- 16.2.10.1. Overview
- 16.2.10.2. Products
- 16.2.10.3. SWOT Analysis
- 16.2.10.4. Recent Developments
- 16.2.10.5. Financials (Based on Availability)
- 16.2.1 Wipro Limited
List of Figures
- Figure 1: Global Business Process as a Service Industry Revenue Breakdown (Million, %) by Region 2024 & 2032
- Figure 2: North America Business Process as a Service Industry Revenue (Million), by Country 2024 & 2032
- Figure 3: North America Business Process as a Service Industry Revenue Share (%), by Country 2024 & 2032
- Figure 4: Europe Business Process as a Service Industry Revenue (Million), by Country 2024 & 2032
- Figure 5: Europe Business Process as a Service Industry Revenue Share (%), by Country 2024 & 2032
- Figure 6: Asia Pacific Business Process as a Service Industry Revenue (Million), by Country 2024 & 2032
- Figure 7: Asia Pacific Business Process as a Service Industry Revenue Share (%), by Country 2024 & 2032
- Figure 8: Latin America Business Process as a Service Industry Revenue (Million), by Country 2024 & 2032
- Figure 9: Latin America Business Process as a Service Industry Revenue Share (%), by Country 2024 & 2032
- Figure 10: Middle East Business Process as a Service Industry Revenue (Million), by Country 2024 & 2032
- Figure 11: Middle East Business Process as a Service Industry Revenue Share (%), by Country 2024 & 2032
- Figure 12: North America Business Process as a Service Industry Revenue (Million), by Size of Organization 2024 & 2032
- Figure 13: North America Business Process as a Service Industry Revenue Share (%), by Size of Organization 2024 & 2032
- Figure 14: North America Business Process as a Service Industry Revenue (Million), by Process 2024 & 2032
- Figure 15: North America Business Process as a Service Industry Revenue Share (%), by Process 2024 & 2032
- Figure 16: North America Business Process as a Service Industry Revenue (Million), by End-user Industry 2024 & 2032
- Figure 17: North America Business Process as a Service Industry Revenue Share (%), by End-user Industry 2024 & 2032
- Figure 18: North America Business Process as a Service Industry Revenue (Million), by Country 2024 & 2032
- Figure 19: North America Business Process as a Service Industry Revenue Share (%), by Country 2024 & 2032
- Figure 20: Europe Business Process as a Service Industry Revenue (Million), by Size of Organization 2024 & 2032
- Figure 21: Europe Business Process as a Service Industry Revenue Share (%), by Size of Organization 2024 & 2032
- Figure 22: Europe Business Process as a Service Industry Revenue (Million), by Process 2024 & 2032
- Figure 23: Europe Business Process as a Service Industry Revenue Share (%), by Process 2024 & 2032
- Figure 24: Europe Business Process as a Service Industry Revenue (Million), by End-user Industry 2024 & 2032
- Figure 25: Europe Business Process as a Service Industry Revenue Share (%), by End-user Industry 2024 & 2032
- Figure 26: Europe Business Process as a Service Industry Revenue (Million), by Country 2024 & 2032
- Figure 27: Europe Business Process as a Service Industry Revenue Share (%), by Country 2024 & 2032
- Figure 28: Asia Pacific Business Process as a Service Industry Revenue (Million), by Size of Organization 2024 & 2032
- Figure 29: Asia Pacific Business Process as a Service Industry Revenue Share (%), by Size of Organization 2024 & 2032
- Figure 30: Asia Pacific Business Process as a Service Industry Revenue (Million), by Process 2024 & 2032
- Figure 31: Asia Pacific Business Process as a Service Industry Revenue Share (%), by Process 2024 & 2032
- Figure 32: Asia Pacific Business Process as a Service Industry Revenue (Million), by End-user Industry 2024 & 2032
- Figure 33: Asia Pacific Business Process as a Service Industry Revenue Share (%), by End-user Industry 2024 & 2032
- Figure 34: Asia Pacific Business Process as a Service Industry Revenue (Million), by Country 2024 & 2032
- Figure 35: Asia Pacific Business Process as a Service Industry Revenue Share (%), by Country 2024 & 2032
- Figure 36: Latin America Business Process as a Service Industry Revenue (Million), by Size of Organization 2024 & 2032
- Figure 37: Latin America Business Process as a Service Industry Revenue Share (%), by Size of Organization 2024 & 2032
- Figure 38: Latin America Business Process as a Service Industry Revenue (Million), by Process 2024 & 2032
- Figure 39: Latin America Business Process as a Service Industry Revenue Share (%), by Process 2024 & 2032
- Figure 40: Latin America Business Process as a Service Industry Revenue (Million), by End-user Industry 2024 & 2032
- Figure 41: Latin America Business Process as a Service Industry Revenue Share (%), by End-user Industry 2024 & 2032
- Figure 42: Latin America Business Process as a Service Industry Revenue (Million), by Country 2024 & 2032
- Figure 43: Latin America Business Process as a Service Industry Revenue Share (%), by Country 2024 & 2032
- Figure 44: Middle East Business Process as a Service Industry Revenue (Million), by Size of Organization 2024 & 2032
- Figure 45: Middle East Business Process as a Service Industry Revenue Share (%), by Size of Organization 2024 & 2032
- Figure 46: Middle East Business Process as a Service Industry Revenue (Million), by Process 2024 & 2032
- Figure 47: Middle East Business Process as a Service Industry Revenue Share (%), by Process 2024 & 2032
- Figure 48: Middle East Business Process as a Service Industry Revenue (Million), by End-user Industry 2024 & 2032
- Figure 49: Middle East Business Process as a Service Industry Revenue Share (%), by End-user Industry 2024 & 2032
- Figure 50: Middle East Business Process as a Service Industry Revenue (Million), by Country 2024 & 2032
- Figure 51: Middle East Business Process as a Service Industry Revenue Share (%), by Country 2024 & 2032
List of Tables
- Table 1: Global Business Process as a Service Industry Revenue Million Forecast, by Region 2019 & 2032
- Table 2: Global Business Process as a Service Industry Revenue Million Forecast, by Size of Organization 2019 & 2032
- Table 3: Global Business Process as a Service Industry Revenue Million Forecast, by Process 2019 & 2032
- Table 4: Global Business Process as a Service Industry Revenue Million Forecast, by End-user Industry 2019 & 2032
- Table 5: Global Business Process as a Service Industry Revenue Million Forecast, by Region 2019 & 2032
- Table 6: Global Business Process as a Service Industry Revenue Million Forecast, by Country 2019 & 2032
- Table 7: United States Business Process as a Service Industry Revenue (Million) Forecast, by Application 2019 & 2032
- Table 8: Canada Business Process as a Service Industry Revenue (Million) Forecast, by Application 2019 & 2032
- Table 9: Global Business Process as a Service Industry Revenue Million Forecast, by Country 2019 & 2032
- Table 10: United Kingdom Business Process as a Service Industry Revenue (Million) Forecast, by Application 2019 & 2032
- Table 11: Germany Business Process as a Service Industry Revenue (Million) Forecast, by Application 2019 & 2032
- Table 12: France Business Process as a Service Industry Revenue (Million) Forecast, by Application 2019 & 2032
- Table 13: Rest of Europe Business Process as a Service Industry Revenue (Million) Forecast, by Application 2019 & 2032
- Table 14: Global Business Process as a Service Industry Revenue Million Forecast, by Country 2019 & 2032
- Table 15: China Business Process as a Service Industry Revenue (Million) Forecast, by Application 2019 & 2032
- Table 16: India Business Process as a Service Industry Revenue (Million) Forecast, by Application 2019 & 2032
- Table 17: Japan Business Process as a Service Industry Revenue (Million) Forecast, by Application 2019 & 2032
- Table 18: Rest of Asia Pacific Business Process as a Service Industry Revenue (Million) Forecast, by Application 2019 & 2032
- Table 19: Global Business Process as a Service Industry Revenue Million Forecast, by Country 2019 & 2032
- Table 20: Business Process as a Service Industry Revenue (Million) Forecast, by Application 2019 & 2032
- Table 21: Global Business Process as a Service Industry Revenue Million Forecast, by Country 2019 & 2032
- Table 22: Business Process as a Service Industry Revenue (Million) Forecast, by Application 2019 & 2032
- Table 23: Global Business Process as a Service Industry Revenue Million Forecast, by Size of Organization 2019 & 2032
- Table 24: Global Business Process as a Service Industry Revenue Million Forecast, by Process 2019 & 2032
- Table 25: Global Business Process as a Service Industry Revenue Million Forecast, by End-user Industry 2019 & 2032
- Table 26: Global Business Process as a Service Industry Revenue Million Forecast, by Country 2019 & 2032
- Table 27: United States Business Process as a Service Industry Revenue (Million) Forecast, by Application 2019 & 2032
- Table 28: Canada Business Process as a Service Industry Revenue (Million) Forecast, by Application 2019 & 2032
- Table 29: Global Business Process as a Service Industry Revenue Million Forecast, by Size of Organization 2019 & 2032
- Table 30: Global Business Process as a Service Industry Revenue Million Forecast, by Process 2019 & 2032
- Table 31: Global Business Process as a Service Industry Revenue Million Forecast, by End-user Industry 2019 & 2032
- Table 32: Global Business Process as a Service Industry Revenue Million Forecast, by Country 2019 & 2032
- Table 33: United Kingdom Business Process as a Service Industry Revenue (Million) Forecast, by Application 2019 & 2032
- Table 34: Germany Business Process as a Service Industry Revenue (Million) Forecast, by Application 2019 & 2032
- Table 35: France Business Process as a Service Industry Revenue (Million) Forecast, by Application 2019 & 2032
- Table 36: Rest of Europe Business Process as a Service Industry Revenue (Million) Forecast, by Application 2019 & 2032
- Table 37: Global Business Process as a Service Industry Revenue Million Forecast, by Size of Organization 2019 & 2032
- Table 38: Global Business Process as a Service Industry Revenue Million Forecast, by Process 2019 & 2032
- Table 39: Global Business Process as a Service Industry Revenue Million Forecast, by End-user Industry 2019 & 2032
- Table 40: Global Business Process as a Service Industry Revenue Million Forecast, by Country 2019 & 2032
- Table 41: China Business Process as a Service Industry Revenue (Million) Forecast, by Application 2019 & 2032
- Table 42: India Business Process as a Service Industry Revenue (Million) Forecast, by Application 2019 & 2032
- Table 43: Japan Business Process as a Service Industry Revenue (Million) Forecast, by Application 2019 & 2032
- Table 44: Rest of Asia Pacific Business Process as a Service Industry Revenue (Million) Forecast, by Application 2019 & 2032
- Table 45: Global Business Process as a Service Industry Revenue Million Forecast, by Size of Organization 2019 & 2032
- Table 46: Global Business Process as a Service Industry Revenue Million Forecast, by Process 2019 & 2032
- Table 47: Global Business Process as a Service Industry Revenue Million Forecast, by End-user Industry 2019 & 2032
- Table 48: Global Business Process as a Service Industry Revenue Million Forecast, by Country 2019 & 2032
- Table 49: Global Business Process as a Service Industry Revenue Million Forecast, by Size of Organization 2019 & 2032
- Table 50: Global Business Process as a Service Industry Revenue Million Forecast, by Process 2019 & 2032
- Table 51: Global Business Process as a Service Industry Revenue Million Forecast, by End-user Industry 2019 & 2032
- Table 52: Global Business Process as a Service Industry Revenue Million Forecast, by Country 2019 & 2032
Frequently Asked Questions
1. What is the projected Compound Annual Growth Rate (CAGR) of the Business Process as a Service Industry?
The projected CAGR is approximately 10.89%.
2. Which companies are prominent players in the Business Process as a Service Industry?
Key companies in the market include Wipro Limited, Accenture PLC, IBM Corporation, Fujitsu Ltd, HCL Technologies Ltd, Tata Consultancy Services Limited, Oracle Corporation, Capgemini SE*List Not Exhaustive, Cognizant Technology Solutions, Genpact Limited.
3. What are the main segments of the Business Process as a Service Industry?
The market segments include Size of Organization, Process, End-user Industry.
4. Can you provide details about the market size?
The market size is estimated to be USD XX Million as of 2022.
5. What are some drivers contributing to market growth?
Growing Demand for Cloud Services and Standard Operating Processes; Rising Need for the Reduction of Operational Costs and Improvement of Productivity.
6. What are the notable trends driving market growth?
Reduction of Operational Costs and Productivity Improvement to Drive the Market.
7. Are there any restraints impacting market growth?
Managing Regulatory and Compliance Needs Across the World.
8. Can you provide examples of recent developments in the market?
November 2022: In collaboration with IBM, Infosys Business Process Management (BPM) launches a cutting-edge AI and automation center in Poland. The partnership between Infosys BPM and IBM aims to deliver client success, identify new use cases, and build solutions to enable clients to innovate in hybrid cloud environments. Customers will have access to a range of digital solution offerings across the space of data, AI, and hyper-automation, including IBM CloudPak for data, IBM Watson Assistant and IBM Watson Discovery, IBM SaferPayments, IBM Blockchain, IBM Sterling Supply Chain, IBM Risk and Fraud Detection software, and Envizi for sustainability. They will also access critical solutions from Infosys BPM, such as Infosys Intelligent Document Processing, Infosys Interaction Analytics, and Infosys.
9. What pricing options are available for accessing the report?
Pricing options include single-user, multi-user, and enterprise licenses priced at USD 4750, USD 5250, and USD 8750 respectively.
10. Is the market size provided in terms of value or volume?
The market size is provided in terms of value, measured in Million.
11. Are there any specific market keywords associated with the report?
Yes, the market keyword associated with the report is "Business Process as a Service Industry," which aids in identifying and referencing the specific market segment covered.
12. How do I determine which pricing option suits my needs best?
The pricing options vary based on user requirements and access needs. Individual users may opt for single-user licenses, while businesses requiring broader access may choose multi-user or enterprise licenses for cost-effective access to the report.
13. Are there any additional resources or data provided in the Business Process as a Service Industry report?
While the report offers comprehensive insights, it's advisable to review the specific contents or supplementary materials provided to ascertain if additional resources or data are available.
14. How can I stay updated on further developments or reports in the Business Process as a Service Industry?
To stay informed about further developments, trends, and reports in the Business Process as a Service Industry, consider subscribing to industry newsletters, following relevant companies and organizations, or regularly checking reputable industry news sources and publications.
Methodology
Step 1 - Identification of Relevant Samples Size from Population Database


Step 2 - Approaches for Defining Global Market Size (Value, Volume* & Price*)

Note*: In applicable scenarios
Step 3 - Data Sources
Primary Research
- Web Analytics
- Survey Reports
- Research Institute
- Latest Research Reports
- Opinion Leaders
Secondary Research
- Annual Reports
- White Paper
- Latest Press Release
- Industry Association
- Paid Database
- Investor Presentations

Step 4 - Data Triangulation
Involves using different sources of information in order to increase the validity of a study
These sources are likely to be stakeholders in a program - participants, other researchers, program staff, other community members, and so on.
Then we put all data in single framework & apply various statistical tools to find out the dynamic on the market.
During the analysis stage, feedback from the stakeholder groups would be compared to determine areas of agreement as well as areas of divergence


