
Key Insights
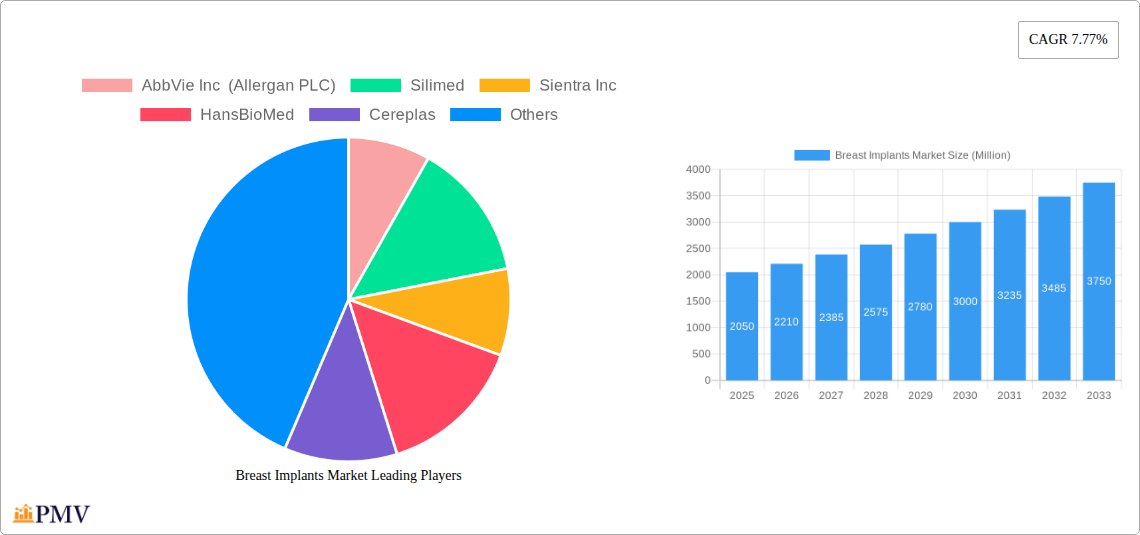
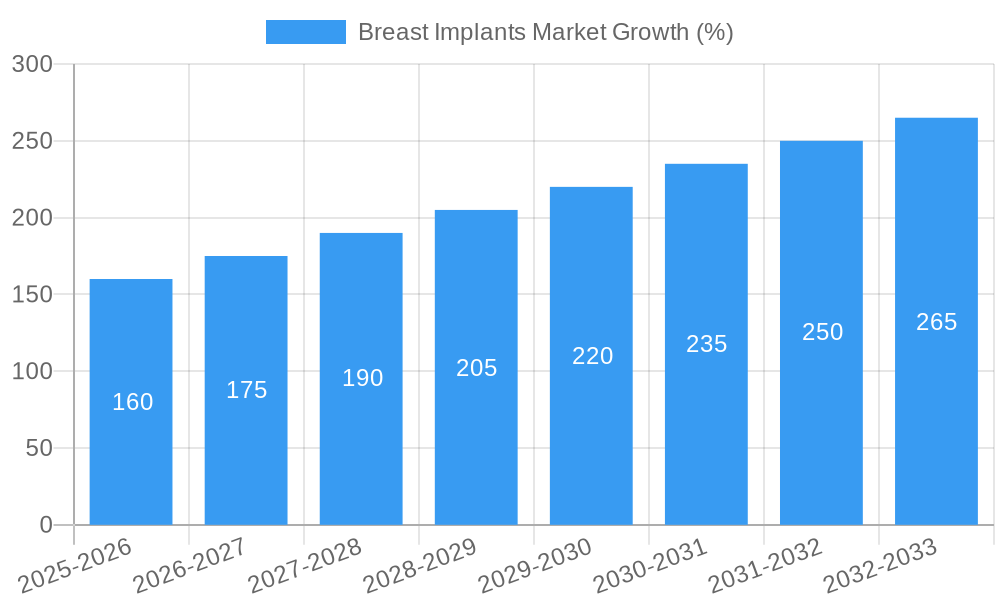
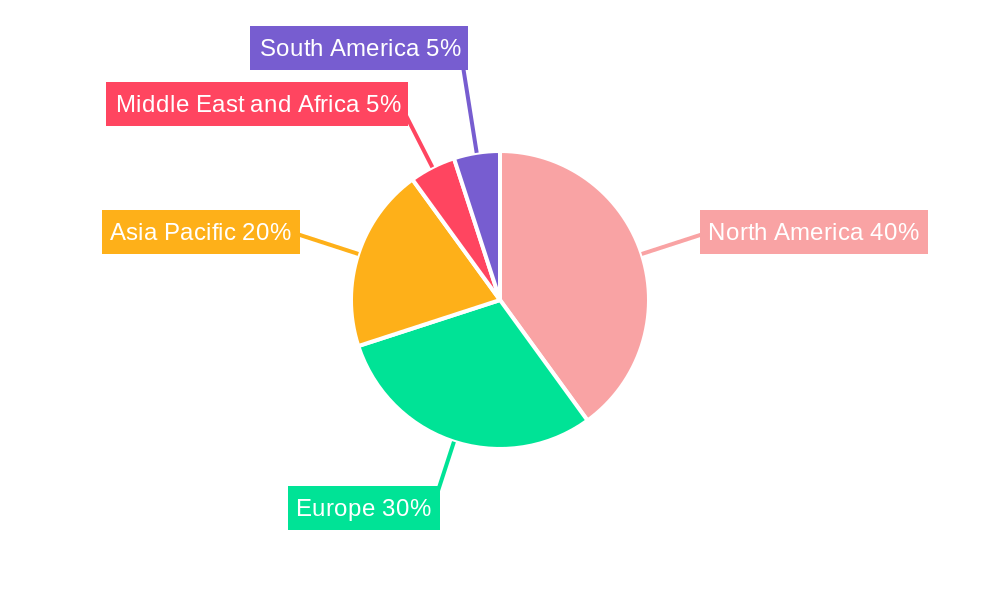
The global breast implants market, valued at $2.05 billion in 2025, is projected to experience robust growth, driven by rising demand for cosmetic surgeries and breast reconstruction procedures. A compound annual growth rate (CAGR) of 7.77% from 2025 to 2033 indicates a significant expansion, reaching an estimated market value exceeding $4 billion by 2033. This growth is fueled by several factors, including increasing disposable incomes in developing economies leading to greater access to elective surgeries, technological advancements in implant materials resulting in improved safety and longevity, and a growing awareness of body image issues and the availability of minimally invasive surgical techniques. The market segmentation reveals a preference for silicone implants due to their natural feel and appearance, though saline implants maintain a considerable share, especially in reconstructive surgeries. The preference for specific implant types and procedures varies across regions, with North America and Europe currently dominating the market due to higher disposable incomes and established healthcare infrastructure. However, rapidly growing economies in Asia-Pacific are expected to witness significant market expansion in the coming years.
The market's growth, however, is not without challenges. Regulatory scrutiny surrounding implant safety and potential long-term health effects acts as a restraint. Furthermore, the high cost of surgery and implants, along with the potential for complications, can limit accessibility. The competitive landscape is characterized by several major players, including established medical device companies and specialized manufacturers, engaging in ongoing research and development to enhance implant technology and expand their market reach. Strategic partnerships, mergers, and acquisitions are likely to shape the industry’s future, while a focus on patient safety and improved surgical techniques will be critical for sustained growth and market acceptance. The increasing demand for minimally invasive procedures and personalized implant solutions will further contribute to market dynamics and shape the future trajectory of the breast implant market.
Breast Implants Market: A Comprehensive Report (2019-2033)
This detailed report provides a comprehensive analysis of the global breast implants market, offering actionable insights for stakeholders across the medical device and aesthetic surgery industries. The study covers the period from 2019 to 2033, with 2025 serving as the base and estimated year. The report meticulously analyzes market segmentation, competitive dynamics, technological advancements, and future growth prospects. It includes market sizing in Millions, CAGR projections, and in-depth examinations of leading players like AbbVie Inc (Allergan PLC), Silimed, Sientra Inc, HansBioMed, Cereplas, Establishment Labs SA, Polytech Health & Aesthetics GmbH, Laboratories Arion, Johnson & Johnson (Mentor Worldwide LLC), Groupe Sebbin SAS, and GC Aesthetics.
Breast Implants Market Market Structure & Competitive Dynamics
The breast implants market exhibits a moderately concentrated structure, with a few major players holding significant market share. The market is characterized by intense competition, driven by product innovation, technological advancements, and strategic mergers and acquisitions (M&A). Regulatory frameworks, particularly those concerning medical device approvals (like the European Medical Device Regulation - MDR), play a significant role in shaping the competitive landscape. The market also faces pressure from the availability of substitute procedures and evolving end-user preferences. Innovation ecosystems are crucial, with companies investing heavily in research and development to enhance implant safety, efficacy, and aesthetic outcomes.
- Market Concentration: The top five players account for approximately xx% of the global market share in 2025.
- M&A Activity: The past five years have witnessed xx M&A deals in the breast implants market, with a total deal value exceeding xx Million. These transactions have often been driven by strategic expansion and portfolio diversification.
- Regulatory Landscape: Stringent regulatory requirements concerning safety and efficacy drive market dynamics and influence product development strategies. Compliance costs contribute significantly to overall market pricing.
- Product Substitutes: Non-surgical breast enhancement procedures and other aesthetic treatments pose competitive challenges to the breast implants market.
- End-User Trends: Increasing demand for minimally invasive procedures and personalized aesthetic outcomes is shaping product development.
Breast Implants Market Industry Trends & Insights
The global breast implants market is experiencing robust growth, driven by a combination of factors. The rising prevalence of breast cancer and the increasing demand for reconstructive surgery significantly contribute to market expansion. Furthermore, the growing popularity of cosmetic breast augmentation procedures, fueled by changing aesthetic preferences and rising disposable incomes in developing economies, is driving market growth. Technological disruptions, such as the development of 4D-printed smart implants, are poised to revolutionize the market. These advancements enhance the patient experience and potentially improve clinical outcomes. The market’s competitive landscape is characterized by ongoing innovation, product differentiation, and strategic partnerships. The CAGR for the breast implants market is estimated to be xx% during the forecast period (2025-2033), with market penetration reaching xx% by 2033.
Dominant Markets & Segments in Breast Implants Market
The North American region dominates the global breast implants market, followed by Europe and Asia Pacific. Within these regions, specific countries such as the United States, Germany, and Japan demonstrate high market penetration.
- Type: Silicone implants hold the largest market share, followed by saline implants. Form-stable and structured saline implants represent niche segments experiencing moderate growth.
- Application: Cosmetic surgery accounts for a larger share of the market compared to reconstructive surgery. However, the latter segment exhibits strong growth potential driven by the rising incidence of breast cancer.
- End-user: Hospitals are the primary end-users, followed by cosmetology clinics and other specialized medical facilities.
Key Drivers of Regional Dominance:
- North America: High disposable incomes, advanced healthcare infrastructure, and strong adoption of cosmetic procedures.
- Europe: Developed healthcare systems, growing awareness of aesthetic procedures, and increasing demand for reconstructive surgery.
- Asia Pacific: Rising disposable incomes, expanding healthcare infrastructure, and changing aesthetic preferences.
Breast Implants Market Product Innovations
Recent product innovations are centered around enhancing implant safety, durability, and aesthetic outcomes. The introduction of micro-textured anatomical implants and 4D-printed smart implants exemplifies this trend. These advancements address patient concerns about implant rupture, capsular contracture, and improved integration with the surrounding tissue. Moreover, smart implants offer potential for targeted drug delivery, personalized treatment, and enhanced post-surgical monitoring. These innovations cater to evolving consumer preferences and market demands for improved outcomes and personalized medicine.
Report Segmentation & Scope
This report segments the breast implants market based on implant type (Silicone Implants, Form-stable Implants, Saline Implants, Structured Saline Implants), application (Reconstructive Surgery, Cosmetic Surgery), and end-user (Hospital, Cosmetology Clinic, Other End-users). Each segment is analyzed in detail, providing market size, growth projections, and competitive landscape analysis for the period 2019-2033. For example, the silicone implant segment is projected to exhibit a xx% CAGR, while the reconstructive surgery application segment is expected to show higher growth than the cosmetic surgery segment.
Key Drivers of Breast Implants Market Growth
Several factors drive the growth of the breast implants market. These include the rising prevalence of breast cancer, leading to increased demand for reconstructive surgery. Furthermore, the growing acceptance of cosmetic breast augmentation procedures and increased disposable incomes contribute to market expansion. Advancements in implant technology, like the development of safer and more aesthetically pleasing implants, also fuel market growth. Favorable regulatory environments and expanding healthcare infrastructure further contribute to this expansion.
Challenges in the Breast Implants Market Sector
The breast implants market faces several challenges, including stringent regulatory requirements that increase product development and approval costs. Supply chain disruptions can impact the availability and pricing of implants. Furthermore, intense competition from existing players and the emergence of new technologies create pressure on market players. Concerns regarding implant safety and potential long-term complications continue to influence consumer decisions. These challenges collectively affect the market's overall growth trajectory.
Leading Players in the Breast Implants Market Market
- AbbVie Inc (Allergan PLC) [AbbVie]
- Silimed
- Sientra Inc [Sientra]
- HansBioMed
- Cereplas
- Establishment Labs SA [Establishment Labs]
- Polytech Health & Aesthetics GmbH [Polytech]
- Laboratories Arion
- Johnson & Johnson (Mentor Worldwide LLC) [Johnson & Johnson]
- Groupe Sebbin SAS
- GC Aesthetics [GC Aesthetics]
Key Developments in Breast Implants Market Sector
- September 2023: Queen's University Belfast researchers announced the development of 4D-printed smart breast implants for cancer patients, enabling size adjustment and potential chemotherapy drug delivery. This innovation significantly impacts the reconstructive surgery segment.
- April 2024: GC Aesthetics launched the LUNA XT, a micro-textured anatomical breast implant approved under the European MDR. This launch reinforces the company's position and highlights the importance of MDR compliance.
Strategic Breast Implants Market Market Outlook
The breast implants market is poised for continued growth, driven by technological advancements, increasing demand for cosmetic and reconstructive procedures, and expanding healthcare infrastructure globally. Strategic opportunities exist for companies focusing on developing innovative implants with improved safety profiles, enhanced aesthetic outcomes, and personalized treatment options. Companies that successfully navigate regulatory hurdles and effectively address patient concerns regarding implant safety will be well-positioned to capture market share in the coming years.
Breast Implants Market Segmentation
-
1. Type
- 1.1. Silicone Implants
- 1.2. Form-stable Implants
- 1.3. Saline Implants
- 1.4. Structured Saline Implants
-
2. Application
- 2.1. Reconstructive Surgery
- 2.2. Cosmetic Surgery
-
3. End-user
- 3.1. Hospital
- 3.2. Cosmetology Clinic
- 3.3. Other End-users
Breast Implants Market Segmentation By Geography
-
1. North America
- 1.1. United States
- 1.2. Canada
- 1.3. Mexico
-
2. Europe
- 2.1. Germany
- 2.2. United Kingdom
- 2.3. France
- 2.4. Italy
- 2.5. Spain
- 2.6. Rest of Europe
-
3. Asia Pacific
- 3.1. China
- 3.2. Japan
- 3.3. India
- 3.4. Australia
- 3.5. South Korea
- 3.6. Rest of Asia Pacific
-
4. Middle East and Africa
- 4.1. GCC
- 4.2. South Africa
- 4.3. Rest of Middle East and Africa
-
5. South America
- 5.1. Brazil
- 5.2. Argentina
- 5.3. Rest of South America
Breast Implants Market REPORT HIGHLIGHTS
| Aspects | Details |
|---|---|
| Study Period | 2019-2033 |
| Base Year | 2024 |
| Estimated Year | 2025 |
| Forecast Period | 2025-2033 |
| Historical Period | 2019-2024 |
| Growth Rate | CAGR of 7.77% from 2019-2033 |
| Segmentation |
|
Table of Contents
- 1. Introduction
- 1.1. Research Scope
- 1.2. Market Segmentation
- 1.3. Research Methodology
- 1.4. Definitions and Assumptions
- 2. Executive Summary
- 2.1. Introduction
- 3. Market Dynamics
- 3.1. Introduction
- 3.2. Market Drivers
- 3.2.1. Rising Incidence of Breast Cancer; Increasing Number of Breast Augmentation Procedures; Technological Advancements
- 3.3. Market Restrains
- 3.3.1. Post Complications and Risks Associated with Breast Implants; High Cost of Breast Implants
- 3.4. Market Trends
- 3.4.1. Silicone Implant is Expected to Hold a Major Share in the Market Over the Forecast Period
- 4. Market Factor Analysis
- 4.1. Porters Five Forces
- 4.2. Supply/Value Chain
- 4.3. PESTEL analysis
- 4.4. Market Entropy
- 4.5. Patent/Trademark Analysis
- 5. Global Breast Implants Market Analysis, Insights and Forecast, 2019-2031
- 5.1. Market Analysis, Insights and Forecast - by Type
- 5.1.1. Silicone Implants
- 5.1.2. Form-stable Implants
- 5.1.3. Saline Implants
- 5.1.4. Structured Saline Implants
- 5.2. Market Analysis, Insights and Forecast - by Application
- 5.2.1. Reconstructive Surgery
- 5.2.2. Cosmetic Surgery
- 5.3. Market Analysis, Insights and Forecast - by End-user
- 5.3.1. Hospital
- 5.3.2. Cosmetology Clinic
- 5.3.3. Other End-users
- 5.4. Market Analysis, Insights and Forecast - by Region
- 5.4.1. North America
- 5.4.2. Europe
- 5.4.3. Asia Pacific
- 5.4.4. Middle East and Africa
- 5.4.5. South America
- 5.1. Market Analysis, Insights and Forecast - by Type
- 6. North America Breast Implants Market Analysis, Insights and Forecast, 2019-2031
- 6.1. Market Analysis, Insights and Forecast - by Type
- 6.1.1. Silicone Implants
- 6.1.2. Form-stable Implants
- 6.1.3. Saline Implants
- 6.1.4. Structured Saline Implants
- 6.2. Market Analysis, Insights and Forecast - by Application
- 6.2.1. Reconstructive Surgery
- 6.2.2. Cosmetic Surgery
- 6.3. Market Analysis, Insights and Forecast - by End-user
- 6.3.1. Hospital
- 6.3.2. Cosmetology Clinic
- 6.3.3. Other End-users
- 6.1. Market Analysis, Insights and Forecast - by Type
- 7. Europe Breast Implants Market Analysis, Insights and Forecast, 2019-2031
- 7.1. Market Analysis, Insights and Forecast - by Type
- 7.1.1. Silicone Implants
- 7.1.2. Form-stable Implants
- 7.1.3. Saline Implants
- 7.1.4. Structured Saline Implants
- 7.2. Market Analysis, Insights and Forecast - by Application
- 7.2.1. Reconstructive Surgery
- 7.2.2. Cosmetic Surgery
- 7.3. Market Analysis, Insights and Forecast - by End-user
- 7.3.1. Hospital
- 7.3.2. Cosmetology Clinic
- 7.3.3. Other End-users
- 7.1. Market Analysis, Insights and Forecast - by Type
- 8. Asia Pacific Breast Implants Market Analysis, Insights and Forecast, 2019-2031
- 8.1. Market Analysis, Insights and Forecast - by Type
- 8.1.1. Silicone Implants
- 8.1.2. Form-stable Implants
- 8.1.3. Saline Implants
- 8.1.4. Structured Saline Implants
- 8.2. Market Analysis, Insights and Forecast - by Application
- 8.2.1. Reconstructive Surgery
- 8.2.2. Cosmetic Surgery
- 8.3. Market Analysis, Insights and Forecast - by End-user
- 8.3.1. Hospital
- 8.3.2. Cosmetology Clinic
- 8.3.3. Other End-users
- 8.1. Market Analysis, Insights and Forecast - by Type
- 9. Middle East and Africa Breast Implants Market Analysis, Insights and Forecast, 2019-2031
- 9.1. Market Analysis, Insights and Forecast - by Type
- 9.1.1. Silicone Implants
- 9.1.2. Form-stable Implants
- 9.1.3. Saline Implants
- 9.1.4. Structured Saline Implants
- 9.2. Market Analysis, Insights and Forecast - by Application
- 9.2.1. Reconstructive Surgery
- 9.2.2. Cosmetic Surgery
- 9.3. Market Analysis, Insights and Forecast - by End-user
- 9.3.1. Hospital
- 9.3.2. Cosmetology Clinic
- 9.3.3. Other End-users
- 9.1. Market Analysis, Insights and Forecast - by Type
- 10. South America Breast Implants Market Analysis, Insights and Forecast, 2019-2031
- 10.1. Market Analysis, Insights and Forecast - by Type
- 10.1.1. Silicone Implants
- 10.1.2. Form-stable Implants
- 10.1.3. Saline Implants
- 10.1.4. Structured Saline Implants
- 10.2. Market Analysis, Insights and Forecast - by Application
- 10.2.1. Reconstructive Surgery
- 10.2.2. Cosmetic Surgery
- 10.3. Market Analysis, Insights and Forecast - by End-user
- 10.3.1. Hospital
- 10.3.2. Cosmetology Clinic
- 10.3.3. Other End-users
- 10.1. Market Analysis, Insights and Forecast - by Type
- 11. North America Breast Implants Market Analysis, Insights and Forecast, 2019-2031
- 11.1. Market Analysis, Insights and Forecast - By Country/Sub-region
- 11.1.1 United States
- 11.1.2 Canada
- 11.1.3 Mexico
- 12. Europe Breast Implants Market Analysis, Insights and Forecast, 2019-2031
- 12.1. Market Analysis, Insights and Forecast - By Country/Sub-region
- 12.1.1 Germany
- 12.1.2 United Kingdom
- 12.1.3 France
- 12.1.4 Italy
- 12.1.5 Spain
- 12.1.6 Rest of Europe
- 13. Asia Pacific Breast Implants Market Analysis, Insights and Forecast, 2019-2031
- 13.1. Market Analysis, Insights and Forecast - By Country/Sub-region
- 13.1.1 China
- 13.1.2 Japan
- 13.1.3 India
- 13.1.4 Australia
- 13.1.5 South Korea
- 13.1.6 Rest of Asia Pacific
- 14. Middle East and Africa Breast Implants Market Analysis, Insights and Forecast, 2019-2031
- 14.1. Market Analysis, Insights and Forecast - By Country/Sub-region
- 14.1.1 GCC
- 14.1.2 South Africa
- 14.1.3 Rest of Middle East and Africa
- 15. South America Breast Implants Market Analysis, Insights and Forecast, 2019-2031
- 15.1. Market Analysis, Insights and Forecast - By Country/Sub-region
- 15.1.1 Brazil
- 15.1.2 Argentina
- 15.1.3 Rest of South America
- 16. Competitive Analysis
- 16.1. Global Market Share Analysis 2024
- 16.2. Company Profiles
- 16.2.1 AbbVie Inc (Allergan PLC)
- 16.2.1.1. Overview
- 16.2.1.2. Products
- 16.2.1.3. SWOT Analysis
- 16.2.1.4. Recent Developments
- 16.2.1.5. Financials (Based on Availability)
- 16.2.2 Silimed
- 16.2.2.1. Overview
- 16.2.2.2. Products
- 16.2.2.3. SWOT Analysis
- 16.2.2.4. Recent Developments
- 16.2.2.5. Financials (Based on Availability)
- 16.2.3 Sientra Inc
- 16.2.3.1. Overview
- 16.2.3.2. Products
- 16.2.3.3. SWOT Analysis
- 16.2.3.4. Recent Developments
- 16.2.3.5. Financials (Based on Availability)
- 16.2.4 HansBioMed
- 16.2.4.1. Overview
- 16.2.4.2. Products
- 16.2.4.3. SWOT Analysis
- 16.2.4.4. Recent Developments
- 16.2.4.5. Financials (Based on Availability)
- 16.2.5 Cereplas
- 16.2.5.1. Overview
- 16.2.5.2. Products
- 16.2.5.3. SWOT Analysis
- 16.2.5.4. Recent Developments
- 16.2.5.5. Financials (Based on Availability)
- 16.2.6 Establishment Labs SA
- 16.2.6.1. Overview
- 16.2.6.2. Products
- 16.2.6.3. SWOT Analysis
- 16.2.6.4. Recent Developments
- 16.2.6.5. Financials (Based on Availability)
- 16.2.7 Polytech Health & Aesthetics GmbH
- 16.2.7.1. Overview
- 16.2.7.2. Products
- 16.2.7.3. SWOT Analysis
- 16.2.7.4. Recent Developments
- 16.2.7.5. Financials (Based on Availability)
- 16.2.8 Laboratories Arion
- 16.2.8.1. Overview
- 16.2.8.2. Products
- 16.2.8.3. SWOT Analysis
- 16.2.8.4. Recent Developments
- 16.2.8.5. Financials (Based on Availability)
- 16.2.9 Johnson & Johnson (Mentor Worldwide LLC )
- 16.2.9.1. Overview
- 16.2.9.2. Products
- 16.2.9.3. SWOT Analysis
- 16.2.9.4. Recent Developments
- 16.2.9.5. Financials (Based on Availability)
- 16.2.10 Groupe Sebbin SAS
- 16.2.10.1. Overview
- 16.2.10.2. Products
- 16.2.10.3. SWOT Analysis
- 16.2.10.4. Recent Developments
- 16.2.10.5. Financials (Based on Availability)
- 16.2.11 GC Aesthetics
- 16.2.11.1. Overview
- 16.2.11.2. Products
- 16.2.11.3. SWOT Analysis
- 16.2.11.4. Recent Developments
- 16.2.11.5. Financials (Based on Availability)
- 16.2.1 AbbVie Inc (Allergan PLC)
List of Figures
- Figure 1: Global Breast Implants Market Revenue Breakdown (Million, %) by Region 2024 & 2032
- Figure 2: Global Breast Implants Market Volume Breakdown (K Unit, %) by Region 2024 & 2032
- Figure 3: North America Breast Implants Market Revenue (Million), by Country 2024 & 2032
- Figure 4: North America Breast Implants Market Volume (K Unit), by Country 2024 & 2032
- Figure 5: North America Breast Implants Market Revenue Share (%), by Country 2024 & 2032
- Figure 6: North America Breast Implants Market Volume Share (%), by Country 2024 & 2032
- Figure 7: Europe Breast Implants Market Revenue (Million), by Country 2024 & 2032
- Figure 8: Europe Breast Implants Market Volume (K Unit), by Country 2024 & 2032
- Figure 9: Europe Breast Implants Market Revenue Share (%), by Country 2024 & 2032
- Figure 10: Europe Breast Implants Market Volume Share (%), by Country 2024 & 2032
- Figure 11: Asia Pacific Breast Implants Market Revenue (Million), by Country 2024 & 2032
- Figure 12: Asia Pacific Breast Implants Market Volume (K Unit), by Country 2024 & 2032
- Figure 13: Asia Pacific Breast Implants Market Revenue Share (%), by Country 2024 & 2032
- Figure 14: Asia Pacific Breast Implants Market Volume Share (%), by Country 2024 & 2032
- Figure 15: Middle East and Africa Breast Implants Market Revenue (Million), by Country 2024 & 2032
- Figure 16: Middle East and Africa Breast Implants Market Volume (K Unit), by Country 2024 & 2032
- Figure 17: Middle East and Africa Breast Implants Market Revenue Share (%), by Country 2024 & 2032
- Figure 18: Middle East and Africa Breast Implants Market Volume Share (%), by Country 2024 & 2032
- Figure 19: South America Breast Implants Market Revenue (Million), by Country 2024 & 2032
- Figure 20: South America Breast Implants Market Volume (K Unit), by Country 2024 & 2032
- Figure 21: South America Breast Implants Market Revenue Share (%), by Country 2024 & 2032
- Figure 22: South America Breast Implants Market Volume Share (%), by Country 2024 & 2032
- Figure 23: North America Breast Implants Market Revenue (Million), by Type 2024 & 2032
- Figure 24: North America Breast Implants Market Volume (K Unit), by Type 2024 & 2032
- Figure 25: North America Breast Implants Market Revenue Share (%), by Type 2024 & 2032
- Figure 26: North America Breast Implants Market Volume Share (%), by Type 2024 & 2032
- Figure 27: North America Breast Implants Market Revenue (Million), by Application 2024 & 2032
- Figure 28: North America Breast Implants Market Volume (K Unit), by Application 2024 & 2032
- Figure 29: North America Breast Implants Market Revenue Share (%), by Application 2024 & 2032
- Figure 30: North America Breast Implants Market Volume Share (%), by Application 2024 & 2032
- Figure 31: North America Breast Implants Market Revenue (Million), by End-user 2024 & 2032
- Figure 32: North America Breast Implants Market Volume (K Unit), by End-user 2024 & 2032
- Figure 33: North America Breast Implants Market Revenue Share (%), by End-user 2024 & 2032
- Figure 34: North America Breast Implants Market Volume Share (%), by End-user 2024 & 2032
- Figure 35: North America Breast Implants Market Revenue (Million), by Country 2024 & 2032
- Figure 36: North America Breast Implants Market Volume (K Unit), by Country 2024 & 2032
- Figure 37: North America Breast Implants Market Revenue Share (%), by Country 2024 & 2032
- Figure 38: North America Breast Implants Market Volume Share (%), by Country 2024 & 2032
- Figure 39: Europe Breast Implants Market Revenue (Million), by Type 2024 & 2032
- Figure 40: Europe Breast Implants Market Volume (K Unit), by Type 2024 & 2032
- Figure 41: Europe Breast Implants Market Revenue Share (%), by Type 2024 & 2032
- Figure 42: Europe Breast Implants Market Volume Share (%), by Type 2024 & 2032
- Figure 43: Europe Breast Implants Market Revenue (Million), by Application 2024 & 2032
- Figure 44: Europe Breast Implants Market Volume (K Unit), by Application 2024 & 2032
- Figure 45: Europe Breast Implants Market Revenue Share (%), by Application 2024 & 2032
- Figure 46: Europe Breast Implants Market Volume Share (%), by Application 2024 & 2032
- Figure 47: Europe Breast Implants Market Revenue (Million), by End-user 2024 & 2032
- Figure 48: Europe Breast Implants Market Volume (K Unit), by End-user 2024 & 2032
- Figure 49: Europe Breast Implants Market Revenue Share (%), by End-user 2024 & 2032
- Figure 50: Europe Breast Implants Market Volume Share (%), by End-user 2024 & 2032
- Figure 51: Europe Breast Implants Market Revenue (Million), by Country 2024 & 2032
- Figure 52: Europe Breast Implants Market Volume (K Unit), by Country 2024 & 2032
- Figure 53: Europe Breast Implants Market Revenue Share (%), by Country 2024 & 2032
- Figure 54: Europe Breast Implants Market Volume Share (%), by Country 2024 & 2032
- Figure 55: Asia Pacific Breast Implants Market Revenue (Million), by Type 2024 & 2032
- Figure 56: Asia Pacific Breast Implants Market Volume (K Unit), by Type 2024 & 2032
- Figure 57: Asia Pacific Breast Implants Market Revenue Share (%), by Type 2024 & 2032
- Figure 58: Asia Pacific Breast Implants Market Volume Share (%), by Type 2024 & 2032
- Figure 59: Asia Pacific Breast Implants Market Revenue (Million), by Application 2024 & 2032
- Figure 60: Asia Pacific Breast Implants Market Volume (K Unit), by Application 2024 & 2032
- Figure 61: Asia Pacific Breast Implants Market Revenue Share (%), by Application 2024 & 2032
- Figure 62: Asia Pacific Breast Implants Market Volume Share (%), by Application 2024 & 2032
- Figure 63: Asia Pacific Breast Implants Market Revenue (Million), by End-user 2024 & 2032
- Figure 64: Asia Pacific Breast Implants Market Volume (K Unit), by End-user 2024 & 2032
- Figure 65: Asia Pacific Breast Implants Market Revenue Share (%), by End-user 2024 & 2032
- Figure 66: Asia Pacific Breast Implants Market Volume Share (%), by End-user 2024 & 2032
- Figure 67: Asia Pacific Breast Implants Market Revenue (Million), by Country 2024 & 2032
- Figure 68: Asia Pacific Breast Implants Market Volume (K Unit), by Country 2024 & 2032
- Figure 69: Asia Pacific Breast Implants Market Revenue Share (%), by Country 2024 & 2032
- Figure 70: Asia Pacific Breast Implants Market Volume Share (%), by Country 2024 & 2032
- Figure 71: Middle East and Africa Breast Implants Market Revenue (Million), by Type 2024 & 2032
- Figure 72: Middle East and Africa Breast Implants Market Volume (K Unit), by Type 2024 & 2032
- Figure 73: Middle East and Africa Breast Implants Market Revenue Share (%), by Type 2024 & 2032
- Figure 74: Middle East and Africa Breast Implants Market Volume Share (%), by Type 2024 & 2032
- Figure 75: Middle East and Africa Breast Implants Market Revenue (Million), by Application 2024 & 2032
- Figure 76: Middle East and Africa Breast Implants Market Volume (K Unit), by Application 2024 & 2032
- Figure 77: Middle East and Africa Breast Implants Market Revenue Share (%), by Application 2024 & 2032
- Figure 78: Middle East and Africa Breast Implants Market Volume Share (%), by Application 2024 & 2032
- Figure 79: Middle East and Africa Breast Implants Market Revenue (Million), by End-user 2024 & 2032
- Figure 80: Middle East and Africa Breast Implants Market Volume (K Unit), by End-user 2024 & 2032
- Figure 81: Middle East and Africa Breast Implants Market Revenue Share (%), by End-user 2024 & 2032
- Figure 82: Middle East and Africa Breast Implants Market Volume Share (%), by End-user 2024 & 2032
- Figure 83: Middle East and Africa Breast Implants Market Revenue (Million), by Country 2024 & 2032
- Figure 84: Middle East and Africa Breast Implants Market Volume (K Unit), by Country 2024 & 2032
- Figure 85: Middle East and Africa Breast Implants Market Revenue Share (%), by Country 2024 & 2032
- Figure 86: Middle East and Africa Breast Implants Market Volume Share (%), by Country 2024 & 2032
- Figure 87: South America Breast Implants Market Revenue (Million), by Type 2024 & 2032
- Figure 88: South America Breast Implants Market Volume (K Unit), by Type 2024 & 2032
- Figure 89: South America Breast Implants Market Revenue Share (%), by Type 2024 & 2032
- Figure 90: South America Breast Implants Market Volume Share (%), by Type 2024 & 2032
- Figure 91: South America Breast Implants Market Revenue (Million), by Application 2024 & 2032
- Figure 92: South America Breast Implants Market Volume (K Unit), by Application 2024 & 2032
- Figure 93: South America Breast Implants Market Revenue Share (%), by Application 2024 & 2032
- Figure 94: South America Breast Implants Market Volume Share (%), by Application 2024 & 2032
- Figure 95: South America Breast Implants Market Revenue (Million), by End-user 2024 & 2032
- Figure 96: South America Breast Implants Market Volume (K Unit), by End-user 2024 & 2032
- Figure 97: South America Breast Implants Market Revenue Share (%), by End-user 2024 & 2032
- Figure 98: South America Breast Implants Market Volume Share (%), by End-user 2024 & 2032
- Figure 99: South America Breast Implants Market Revenue (Million), by Country 2024 & 2032
- Figure 100: South America Breast Implants Market Volume (K Unit), by Country 2024 & 2032
- Figure 101: South America Breast Implants Market Revenue Share (%), by Country 2024 & 2032
- Figure 102: South America Breast Implants Market Volume Share (%), by Country 2024 & 2032
List of Tables
- Table 1: Global Breast Implants Market Revenue Million Forecast, by Region 2019 & 2032
- Table 2: Global Breast Implants Market Volume K Unit Forecast, by Region 2019 & 2032
- Table 3: Global Breast Implants Market Revenue Million Forecast, by Type 2019 & 2032
- Table 4: Global Breast Implants Market Volume K Unit Forecast, by Type 2019 & 2032
- Table 5: Global Breast Implants Market Revenue Million Forecast, by Application 2019 & 2032
- Table 6: Global Breast Implants Market Volume K Unit Forecast, by Application 2019 & 2032
- Table 7: Global Breast Implants Market Revenue Million Forecast, by End-user 2019 & 2032
- Table 8: Global Breast Implants Market Volume K Unit Forecast, by End-user 2019 & 2032
- Table 9: Global Breast Implants Market Revenue Million Forecast, by Region 2019 & 2032
- Table 10: Global Breast Implants Market Volume K Unit Forecast, by Region 2019 & 2032
- Table 11: Global Breast Implants Market Revenue Million Forecast, by Country 2019 & 2032
- Table 12: Global Breast Implants Market Volume K Unit Forecast, by Country 2019 & 2032
- Table 13: United States Breast Implants Market Revenue (Million) Forecast, by Application 2019 & 2032
- Table 14: United States Breast Implants Market Volume (K Unit) Forecast, by Application 2019 & 2032
- Table 15: Canada Breast Implants Market Revenue (Million) Forecast, by Application 2019 & 2032
- Table 16: Canada Breast Implants Market Volume (K Unit) Forecast, by Application 2019 & 2032
- Table 17: Mexico Breast Implants Market Revenue (Million) Forecast, by Application 2019 & 2032
- Table 18: Mexico Breast Implants Market Volume (K Unit) Forecast, by Application 2019 & 2032
- Table 19: Global Breast Implants Market Revenue Million Forecast, by Country 2019 & 2032
- Table 20: Global Breast Implants Market Volume K Unit Forecast, by Country 2019 & 2032
- Table 21: Germany Breast Implants Market Revenue (Million) Forecast, by Application 2019 & 2032
- Table 22: Germany Breast Implants Market Volume (K Unit) Forecast, by Application 2019 & 2032
- Table 23: United Kingdom Breast Implants Market Revenue (Million) Forecast, by Application 2019 & 2032
- Table 24: United Kingdom Breast Implants Market Volume (K Unit) Forecast, by Application 2019 & 2032
- Table 25: France Breast Implants Market Revenue (Million) Forecast, by Application 2019 & 2032
- Table 26: France Breast Implants Market Volume (K Unit) Forecast, by Application 2019 & 2032
- Table 27: Italy Breast Implants Market Revenue (Million) Forecast, by Application 2019 & 2032
- Table 28: Italy Breast Implants Market Volume (K Unit) Forecast, by Application 2019 & 2032
- Table 29: Spain Breast Implants Market Revenue (Million) Forecast, by Application 2019 & 2032
- Table 30: Spain Breast Implants Market Volume (K Unit) Forecast, by Application 2019 & 2032
- Table 31: Rest of Europe Breast Implants Market Revenue (Million) Forecast, by Application 2019 & 2032
- Table 32: Rest of Europe Breast Implants Market Volume (K Unit) Forecast, by Application 2019 & 2032
- Table 33: Global Breast Implants Market Revenue Million Forecast, by Country 2019 & 2032
- Table 34: Global Breast Implants Market Volume K Unit Forecast, by Country 2019 & 2032
- Table 35: China Breast Implants Market Revenue (Million) Forecast, by Application 2019 & 2032
- Table 36: China Breast Implants Market Volume (K Unit) Forecast, by Application 2019 & 2032
- Table 37: Japan Breast Implants Market Revenue (Million) Forecast, by Application 2019 & 2032
- Table 38: Japan Breast Implants Market Volume (K Unit) Forecast, by Application 2019 & 2032
- Table 39: India Breast Implants Market Revenue (Million) Forecast, by Application 2019 & 2032
- Table 40: India Breast Implants Market Volume (K Unit) Forecast, by Application 2019 & 2032
- Table 41: Australia Breast Implants Market Revenue (Million) Forecast, by Application 2019 & 2032
- Table 42: Australia Breast Implants Market Volume (K Unit) Forecast, by Application 2019 & 2032
- Table 43: South Korea Breast Implants Market Revenue (Million) Forecast, by Application 2019 & 2032
- Table 44: South Korea Breast Implants Market Volume (K Unit) Forecast, by Application 2019 & 2032
- Table 45: Rest of Asia Pacific Breast Implants Market Revenue (Million) Forecast, by Application 2019 & 2032
- Table 46: Rest of Asia Pacific Breast Implants Market Volume (K Unit) Forecast, by Application 2019 & 2032
- Table 47: Global Breast Implants Market Revenue Million Forecast, by Country 2019 & 2032
- Table 48: Global Breast Implants Market Volume K Unit Forecast, by Country 2019 & 2032
- Table 49: GCC Breast Implants Market Revenue (Million) Forecast, by Application 2019 & 2032
- Table 50: GCC Breast Implants Market Volume (K Unit) Forecast, by Application 2019 & 2032
- Table 51: South Africa Breast Implants Market Revenue (Million) Forecast, by Application 2019 & 2032
- Table 52: South Africa Breast Implants Market Volume (K Unit) Forecast, by Application 2019 & 2032
- Table 53: Rest of Middle East and Africa Breast Implants Market Revenue (Million) Forecast, by Application 2019 & 2032
- Table 54: Rest of Middle East and Africa Breast Implants Market Volume (K Unit) Forecast, by Application 2019 & 2032
- Table 55: Global Breast Implants Market Revenue Million Forecast, by Country 2019 & 2032
- Table 56: Global Breast Implants Market Volume K Unit Forecast, by Country 2019 & 2032
- Table 57: Brazil Breast Implants Market Revenue (Million) Forecast, by Application 2019 & 2032
- Table 58: Brazil Breast Implants Market Volume (K Unit) Forecast, by Application 2019 & 2032
- Table 59: Argentina Breast Implants Market Revenue (Million) Forecast, by Application 2019 & 2032
- Table 60: Argentina Breast Implants Market Volume (K Unit) Forecast, by Application 2019 & 2032
- Table 61: Rest of South America Breast Implants Market Revenue (Million) Forecast, by Application 2019 & 2032
- Table 62: Rest of South America Breast Implants Market Volume (K Unit) Forecast, by Application 2019 & 2032
- Table 63: Global Breast Implants Market Revenue Million Forecast, by Type 2019 & 2032
- Table 64: Global Breast Implants Market Volume K Unit Forecast, by Type 2019 & 2032
- Table 65: Global Breast Implants Market Revenue Million Forecast, by Application 2019 & 2032
- Table 66: Global Breast Implants Market Volume K Unit Forecast, by Application 2019 & 2032
- Table 67: Global Breast Implants Market Revenue Million Forecast, by End-user 2019 & 2032
- Table 68: Global Breast Implants Market Volume K Unit Forecast, by End-user 2019 & 2032
- Table 69: Global Breast Implants Market Revenue Million Forecast, by Country 2019 & 2032
- Table 70: Global Breast Implants Market Volume K Unit Forecast, by Country 2019 & 2032
- Table 71: United States Breast Implants Market Revenue (Million) Forecast, by Application 2019 & 2032
- Table 72: United States Breast Implants Market Volume (K Unit) Forecast, by Application 2019 & 2032
- Table 73: Canada Breast Implants Market Revenue (Million) Forecast, by Application 2019 & 2032
- Table 74: Canada Breast Implants Market Volume (K Unit) Forecast, by Application 2019 & 2032
- Table 75: Mexico Breast Implants Market Revenue (Million) Forecast, by Application 2019 & 2032
- Table 76: Mexico Breast Implants Market Volume (K Unit) Forecast, by Application 2019 & 2032
- Table 77: Global Breast Implants Market Revenue Million Forecast, by Type 2019 & 2032
- Table 78: Global Breast Implants Market Volume K Unit Forecast, by Type 2019 & 2032
- Table 79: Global Breast Implants Market Revenue Million Forecast, by Application 2019 & 2032
- Table 80: Global Breast Implants Market Volume K Unit Forecast, by Application 2019 & 2032
- Table 81: Global Breast Implants Market Revenue Million Forecast, by End-user 2019 & 2032
- Table 82: Global Breast Implants Market Volume K Unit Forecast, by End-user 2019 & 2032
- Table 83: Global Breast Implants Market Revenue Million Forecast, by Country 2019 & 2032
- Table 84: Global Breast Implants Market Volume K Unit Forecast, by Country 2019 & 2032
- Table 85: Germany Breast Implants Market Revenue (Million) Forecast, by Application 2019 & 2032
- Table 86: Germany Breast Implants Market Volume (K Unit) Forecast, by Application 2019 & 2032
- Table 87: United Kingdom Breast Implants Market Revenue (Million) Forecast, by Application 2019 & 2032
- Table 88: United Kingdom Breast Implants Market Volume (K Unit) Forecast, by Application 2019 & 2032
- Table 89: France Breast Implants Market Revenue (Million) Forecast, by Application 2019 & 2032
- Table 90: France Breast Implants Market Volume (K Unit) Forecast, by Application 2019 & 2032
- Table 91: Italy Breast Implants Market Revenue (Million) Forecast, by Application 2019 & 2032
- Table 92: Italy Breast Implants Market Volume (K Unit) Forecast, by Application 2019 & 2032
- Table 93: Spain Breast Implants Market Revenue (Million) Forecast, by Application 2019 & 2032
- Table 94: Spain Breast Implants Market Volume (K Unit) Forecast, by Application 2019 & 2032
- Table 95: Rest of Europe Breast Implants Market Revenue (Million) Forecast, by Application 2019 & 2032
- Table 96: Rest of Europe Breast Implants Market Volume (K Unit) Forecast, by Application 2019 & 2032
- Table 97: Global Breast Implants Market Revenue Million Forecast, by Type 2019 & 2032
- Table 98: Global Breast Implants Market Volume K Unit Forecast, by Type 2019 & 2032
- Table 99: Global Breast Implants Market Revenue Million Forecast, by Application 2019 & 2032
- Table 100: Global Breast Implants Market Volume K Unit Forecast, by Application 2019 & 2032
- Table 101: Global Breast Implants Market Revenue Million Forecast, by End-user 2019 & 2032
- Table 102: Global Breast Implants Market Volume K Unit Forecast, by End-user 2019 & 2032
- Table 103: Global Breast Implants Market Revenue Million Forecast, by Country 2019 & 2032
- Table 104: Global Breast Implants Market Volume K Unit Forecast, by Country 2019 & 2032
- Table 105: China Breast Implants Market Revenue (Million) Forecast, by Application 2019 & 2032
- Table 106: China Breast Implants Market Volume (K Unit) Forecast, by Application 2019 & 2032
- Table 107: Japan Breast Implants Market Revenue (Million) Forecast, by Application 2019 & 2032
- Table 108: Japan Breast Implants Market Volume (K Unit) Forecast, by Application 2019 & 2032
- Table 109: India Breast Implants Market Revenue (Million) Forecast, by Application 2019 & 2032
- Table 110: India Breast Implants Market Volume (K Unit) Forecast, by Application 2019 & 2032
- Table 111: Australia Breast Implants Market Revenue (Million) Forecast, by Application 2019 & 2032
- Table 112: Australia Breast Implants Market Volume (K Unit) Forecast, by Application 2019 & 2032
- Table 113: South Korea Breast Implants Market Revenue (Million) Forecast, by Application 2019 & 2032
- Table 114: South Korea Breast Implants Market Volume (K Unit) Forecast, by Application 2019 & 2032
- Table 115: Rest of Asia Pacific Breast Implants Market Revenue (Million) Forecast, by Application 2019 & 2032
- Table 116: Rest of Asia Pacific Breast Implants Market Volume (K Unit) Forecast, by Application 2019 & 2032
- Table 117: Global Breast Implants Market Revenue Million Forecast, by Type 2019 & 2032
- Table 118: Global Breast Implants Market Volume K Unit Forecast, by Type 2019 & 2032
- Table 119: Global Breast Implants Market Revenue Million Forecast, by Application 2019 & 2032
- Table 120: Global Breast Implants Market Volume K Unit Forecast, by Application 2019 & 2032
- Table 121: Global Breast Implants Market Revenue Million Forecast, by End-user 2019 & 2032
- Table 122: Global Breast Implants Market Volume K Unit Forecast, by End-user 2019 & 2032
- Table 123: Global Breast Implants Market Revenue Million Forecast, by Country 2019 & 2032
- Table 124: Global Breast Implants Market Volume K Unit Forecast, by Country 2019 & 2032
- Table 125: GCC Breast Implants Market Revenue (Million) Forecast, by Application 2019 & 2032
- Table 126: GCC Breast Implants Market Volume (K Unit) Forecast, by Application 2019 & 2032
- Table 127: South Africa Breast Implants Market Revenue (Million) Forecast, by Application 2019 & 2032
- Table 128: South Africa Breast Implants Market Volume (K Unit) Forecast, by Application 2019 & 2032
- Table 129: Rest of Middle East and Africa Breast Implants Market Revenue (Million) Forecast, by Application 2019 & 2032
- Table 130: Rest of Middle East and Africa Breast Implants Market Volume (K Unit) Forecast, by Application 2019 & 2032
- Table 131: Global Breast Implants Market Revenue Million Forecast, by Type 2019 & 2032
- Table 132: Global Breast Implants Market Volume K Unit Forecast, by Type 2019 & 2032
- Table 133: Global Breast Implants Market Revenue Million Forecast, by Application 2019 & 2032
- Table 134: Global Breast Implants Market Volume K Unit Forecast, by Application 2019 & 2032
- Table 135: Global Breast Implants Market Revenue Million Forecast, by End-user 2019 & 2032
- Table 136: Global Breast Implants Market Volume K Unit Forecast, by End-user 2019 & 2032
- Table 137: Global Breast Implants Market Revenue Million Forecast, by Country 2019 & 2032
- Table 138: Global Breast Implants Market Volume K Unit Forecast, by Country 2019 & 2032
- Table 139: Brazil Breast Implants Market Revenue (Million) Forecast, by Application 2019 & 2032
- Table 140: Brazil Breast Implants Market Volume (K Unit) Forecast, by Application 2019 & 2032
- Table 141: Argentina Breast Implants Market Revenue (Million) Forecast, by Application 2019 & 2032
- Table 142: Argentina Breast Implants Market Volume (K Unit) Forecast, by Application 2019 & 2032
- Table 143: Rest of South America Breast Implants Market Revenue (Million) Forecast, by Application 2019 & 2032
- Table 144: Rest of South America Breast Implants Market Volume (K Unit) Forecast, by Application 2019 & 2032
Frequently Asked Questions
1. What is the projected Compound Annual Growth Rate (CAGR) of the Breast Implants Market?
The projected CAGR is approximately 7.77%.
2. Which companies are prominent players in the Breast Implants Market?
Key companies in the market include AbbVie Inc (Allergan PLC), Silimed, Sientra Inc, HansBioMed, Cereplas, Establishment Labs SA, Polytech Health & Aesthetics GmbH, Laboratories Arion, Johnson & Johnson (Mentor Worldwide LLC ), Groupe Sebbin SAS, GC Aesthetics.
3. What are the main segments of the Breast Implants Market?
The market segments include Type, Application, End-user.
4. Can you provide details about the market size?
The market size is estimated to be USD 2.05 Million as of 2022.
5. What are some drivers contributing to market growth?
Rising Incidence of Breast Cancer; Increasing Number of Breast Augmentation Procedures; Technological Advancements.
6. What are the notable trends driving market growth?
Silicone Implant is Expected to Hold a Major Share in the Market Over the Forecast Period.
7. Are there any restraints impacting market growth?
Post Complications and Risks Associated with Breast Implants; High Cost of Breast Implants.
8. Can you provide examples of recent developments in the market?
In April 2024, GC Aesthetics introduced the LUNA XT, a micro-textured anatomical breast implant, marking one of the pioneering European Medical Device Regulation (MDR)-approved products in its category.
9. What pricing options are available for accessing the report?
Pricing options include single-user, multi-user, and enterprise licenses priced at USD 4750, USD 5250, and USD 8750 respectively.
10. Is the market size provided in terms of value or volume?
The market size is provided in terms of value, measured in Million and volume, measured in K Unit.
11. Are there any specific market keywords associated with the report?
Yes, the market keyword associated with the report is "Breast Implants Market," which aids in identifying and referencing the specific market segment covered.
12. How do I determine which pricing option suits my needs best?
The pricing options vary based on user requirements and access needs. Individual users may opt for single-user licenses, while businesses requiring broader access may choose multi-user or enterprise licenses for cost-effective access to the report.
13. Are there any additional resources or data provided in the Breast Implants Market report?
While the report offers comprehensive insights, it's advisable to review the specific contents or supplementary materials provided to ascertain if additional resources or data are available.
14. How can I stay updated on further developments or reports in the Breast Implants Market?
To stay informed about further developments, trends, and reports in the Breast Implants Market, consider subscribing to industry newsletters, following relevant companies and organizations, or regularly checking reputable industry news sources and publications.
Methodology
Step 1 - Identification of Relevant Samples Size from Population Database


Step 2 - Approaches for Defining Global Market Size (Value, Volume* & Price*)

Note*: In applicable scenarios
Step 3 - Data Sources
Primary Research
- Web Analytics
- Survey Reports
- Research Institute
- Latest Research Reports
- Opinion Leaders
Secondary Research
- Annual Reports
- White Paper
- Latest Press Release
- Industry Association
- Paid Database
- Investor Presentations

Step 4 - Data Triangulation
Involves using different sources of information in order to increase the validity of a study
These sources are likely to be stakeholders in a program - participants, other researchers, program staff, other community members, and so on.
Then we put all data in single framework & apply various statistical tools to find out the dynamic on the market.
During the analysis stage, feedback from the stakeholder groups would be compared to determine areas of agreement as well as areas of divergence


