
Key Insights
The global blood group typing market is experiencing robust growth, driven by the increasing prevalence of blood transfusions, rising incidence of blood-related disorders, and the growing demand for accurate and efficient blood typing techniques. The market's expansion is further fueled by technological advancements in blood typing technologies, such as the adoption of automated systems and advanced molecular techniques like PCR-based and massively parallel sequencing. These technologies offer improved accuracy, speed, and throughput compared to traditional methods, leading to enhanced patient safety and streamlined workflows in hospitals and blood banks. The market is segmented by product (instruments, consumables, services), technique (PCR-based, microarray, assay-based, massively parallel sequencing), test type (antibody screening, HLA typing, cross-matching, ABO blood tests), and end-user (hospitals, blood banks). The substantial growth in the number of blood transfusions globally is a major factor propelling market expansion, especially in regions with developing healthcare infrastructure. Furthermore, the increasing awareness of blood-borne diseases and the need for accurate blood typing before transfusions contributes significantly to market growth.
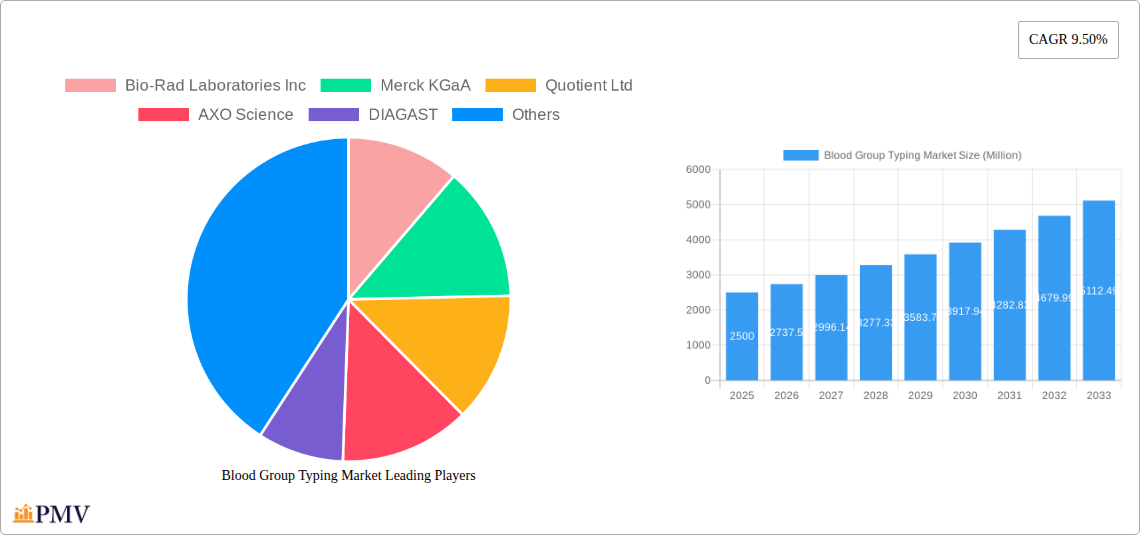
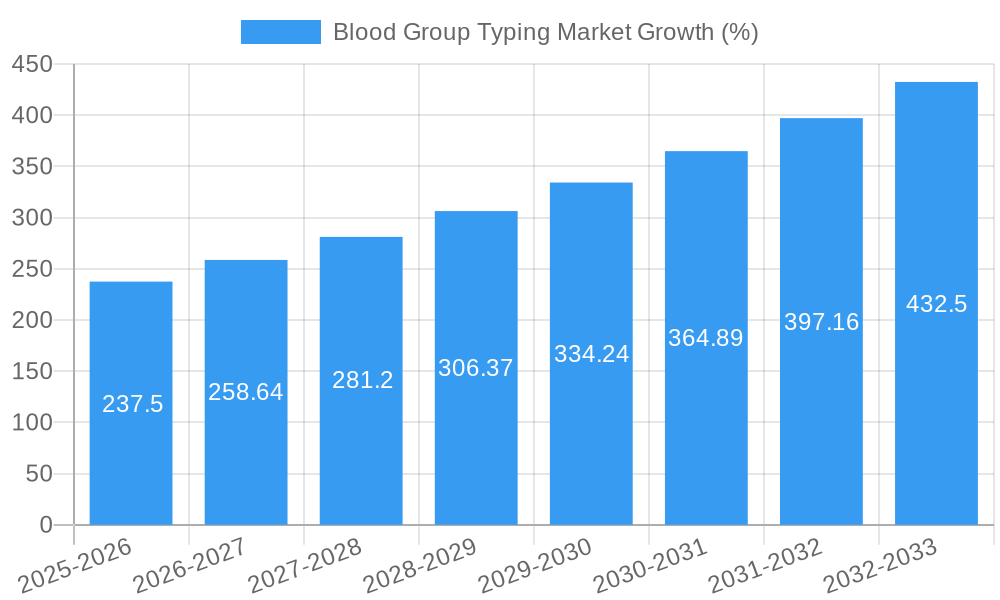
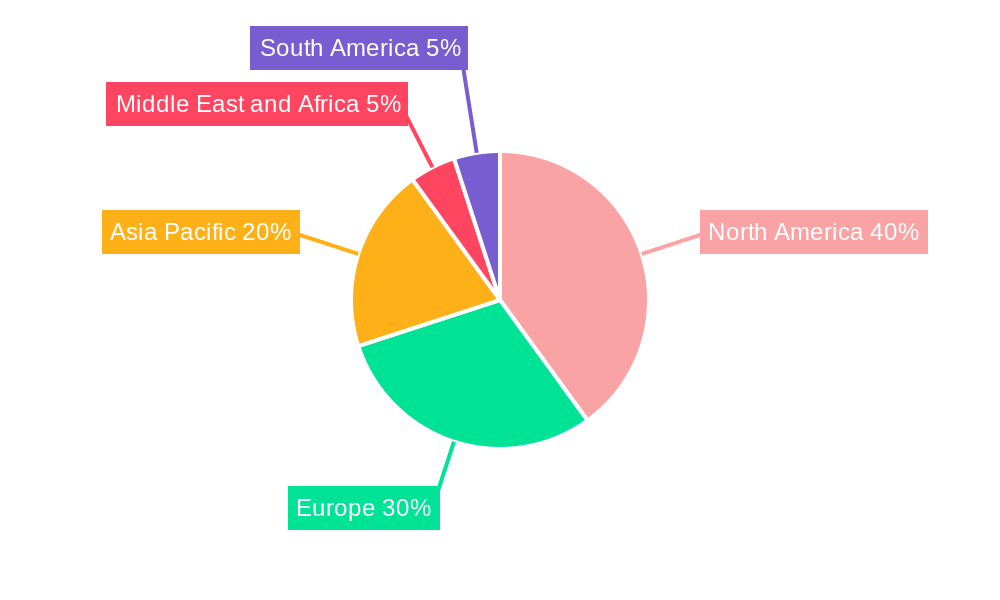
However, certain factors restrain market growth. High costs associated with advanced technologies, particularly massively parallel sequencing, can limit accessibility in resource-constrained settings. Regulatory hurdles and stringent quality control measures in the manufacturing and usage of blood typing products also present challenges. Despite these restraints, the market is expected to maintain a healthy Compound Annual Growth Rate (CAGR) of 9.50% throughout the forecast period (2025-2033), indicating a promising outlook for market players. North America and Europe currently hold a significant market share due to well-established healthcare infrastructure and high adoption rates of advanced technologies; however, Asia Pacific is poised for rapid growth, driven by increasing healthcare expenditure and rising awareness of blood-related diseases. Key players in the market are strategically focusing on product innovation, partnerships, and geographical expansion to capitalize on the market's growth potential.
Blood Group Typing Market: A Comprehensive Report (2019-2033)
This in-depth report provides a comprehensive analysis of the Blood Group Typing Market, offering invaluable insights for industry stakeholders. The study covers the period 2019-2033, with 2025 serving as the base and estimated year, and forecasts extending to 2033. The report meticulously examines market dynamics, segment performance, competitive landscapes, and future growth prospects, incorporating key developments and industry trends. This report is essential for businesses seeking to understand and capitalize on opportunities within this rapidly evolving market. The global market size in 2025 is estimated at xx Million, projected to reach xx Million by 2033, exhibiting a CAGR of xx% during the forecast period.
Blood Group Typing Market Market Structure & Competitive Dynamics
The Blood Group Typing market exhibits a moderately consolidated structure, with key players like Bio-Rad Laboratories Inc, Merck KGaA, Quotient Ltd, AXO Science, DIAGAST, Thermo Fisher Scientific, Grifols S A, Danaher Corporation (Beckman Coulter), and Mesa Laboratories Inc (Agena Bioscience Inc) holding significant market share. The market's competitive dynamics are shaped by factors such as technological advancements, regulatory approvals, and strategic mergers and acquisitions (M&A).
- Market Concentration: The top five players collectively account for approximately xx% of the global market share in 2025.
- Innovation Ecosystems: Continuous R&D efforts are driving innovation in areas like PCR-based and microarray technologies, leading to improved accuracy and efficiency in blood group typing.
- Regulatory Frameworks: Stringent regulatory approvals for diagnostic devices significantly influence market entry and product adoption. Compliance with international standards (e.g., FDA, CE marking) is crucial.
- Product Substitutes: While no direct substitutes exist, alternative methods with varying levels of accuracy and cost-effectiveness influence market segmentation and growth.
- End-User Trends: The growing prevalence of blood transfusion-related diseases and increasing demand for precise blood typing techniques in hospitals and blood banks fuel market growth.
- M&A Activities: Recent M&A activity, such as Grifols' acquisition of Biotest AG in 2022 (valued at xx Million), demonstrates the strategic importance of expanding product portfolios and strengthening market presence. These acquisitions enhance the capabilities of leading players and often lead to increased market concentration. The total value of M&A deals within the Blood Group Typing market during the historical period (2019-2024) is estimated to be xx Million.
Blood Group Typing Market Industry Trends & Insights
The Blood Group Typing market is experiencing robust growth driven by several factors. The rising prevalence of blood-related disorders necessitates accurate and efficient blood typing. Technological advancements, such as the adoption of automation, PCR-based and microarray technologies, and advanced analytical software, are enhancing the speed and accuracy of testing. Furthermore, the increasing demand for personalized medicine and point-of-care diagnostics are further boosting market growth. The increasing awareness about blood-related diseases among healthcare professionals and the public also plays a crucial role. The market is witnessing a shift toward more sophisticated techniques, with Massively Parallel Sequencing gaining traction for its high throughput capabilities. However, the high cost of advanced technologies and the complexity of implementing new techniques present challenges. The market is projected to experience substantial growth, with a CAGR of xx% from 2025 to 2033. Market penetration of PCR-based and microarray technologies is expected to reach xx% by 2033.
Dominant Markets & Segments in Blood Group Typing Market
The North American region holds the largest market share, driven by high healthcare expenditure, advanced infrastructure, and a strong presence of key players. Within the segments, the Consumables segment dominates the By Product category due to the recurring demand for reagents and kits. The Assay-based technique holds a significant share within the By Technique category, owing to its wide applicability and established clinical workflows. ABO blood tests account for the largest share in the By Test Type segment, reflecting their routine use in blood transfusion procedures. Hospitals constitute the primary end-users, owing to their high volume of blood transfusion procedures.
- Key Drivers (North America): Strong healthcare infrastructure, high healthcare expenditure, stringent regulatory environment driving adoption of advanced technologies.
- Key Drivers (Europe): Growing prevalence of blood-related diseases, increasing adoption of sophisticated techniques, government initiatives supporting healthcare infrastructure.
- Key Drivers (Asia-Pacific): Rising disposable incomes, expanding healthcare sector, increasing awareness about blood-related diseases, growing adoption of advanced technologies in emerging economies.
Blood Group Typing Market Product Innovations
Recent advancements in blood group typing include the development of automated systems, point-of-care testing devices, and improved reagents for increased accuracy and efficiency. These innovations address the need for faster turnaround times and improved workflow efficiency in high-throughput settings. The market trend indicates a shift towards integrated solutions that combine different testing modalities for comprehensive analysis, leading to improved diagnostics and treatment outcomes.
Report Segmentation & Scope
This report segments the Blood Group Typing Market based on Product (Instruments, Consumables, Services), Technique (PCR-based and Microarray, Assay-based, Massively Parallel Sequencing, Other), Test Type (Antibody Screening, HLA Typing, Cross-matching Tests, ABO blood Tests, Other), and End User (Hospitals, Blood Banks, Others). Each segment is analyzed based on market size, growth rate, and competitive dynamics. The forecast period (2025-2033) provides detailed projections for each segment, highlighting growth potential and market opportunities.
Key Drivers of Blood Group Typing Market Growth
Several factors drive the growth of the Blood Group Typing market. Technological advancements leading to faster, more accurate, and automated testing methods are key drivers. The increasing prevalence of blood-related diseases and the growing demand for accurate blood typing in transfusion medicine significantly contribute to market expansion. Furthermore, supportive regulatory frameworks and increasing healthcare investments in developed and developing countries fuel market growth.
Challenges in the Blood Group Typing Market Sector
The Blood Group Typing market faces challenges such as the high cost of advanced technologies, stringent regulatory requirements impacting market entry, and the need for skilled professionals to operate sophisticated equipment. Supply chain disruptions and the competition from established and emerging players further influence market dynamics.
Leading Players in the Blood Group Typing Market Market
- Bio-Rad Laboratories Inc
- Merck KGaA
- Quotient Ltd
- AXO Science
- DIAGAST
- Thermo Fisher Scientific
- Grifols S A
- Danaher Corporation (Beckman Coulter)
- Mesa Laboratories Inc (Agena Bioscience Inc)
Key Developments in Blood Group Typing Market Sector
- April 2022: Grifols acquires Tiancheng (Germany) Pharmaceutical Holdings AG's 100% share capital, including Biotest AG, expanding its product portfolio and market presence.
- February 2022: Grifols collaborates with Endpoint Health, Inc., further enhancing its product portfolio for blood group typing.
Strategic Blood Group Typing Market Market Outlook
The Blood Group Typing market holds significant future potential, driven by continuous technological advancements, increasing demand for accurate blood typing, and growing healthcare investments. Strategic opportunities exist for companies focusing on innovation, automation, point-of-care diagnostics, and personalized medicine solutions. The market is poised for continued growth, particularly in emerging economies with expanding healthcare infrastructure.
Blood Group Typing Market Segmentation
-
1. Product
- 1.1. Instruments
- 1.2. Consumables
- 1.3. Services
-
2. Technique
- 2.1. PCR-based and Microarray
- 2.2. Assay-based
- 2.3. Massively Parallel Sequencing
- 2.4. Other
-
3. Test Type
- 3.1. Antibody Screening
- 3.2. HLA Typing
- 3.3. Cross-matching Tests
- 3.4. ABO blood Tests
- 3.5. Other
-
4. End User
- 4.1. Hospitals
- 4.2. Blood Banks
- 4.3. Others
Blood Group Typing Market Segmentation By Geography
-
1. North America
- 1.1. United States
- 1.2. Canada
- 1.3. Mexico
-
2. Europe
- 2.1. Germany
- 2.2. United Kingdom
- 2.3. France
- 2.4. Italy
- 2.5. Spain
- 2.6. Rest of Europe
-
3. Asia Pacific
- 3.1. China
- 3.2. Japan
- 3.3. India
- 3.4. Australia
- 3.5. South Korea
- 3.6. Rest of Asia Pacific
-
4. Middle East and Africa
- 4.1. GCC
- 4.2. South Africa
- 4.3. Rest of Middle East and Africa
-
5. South America
- 5.1. Brazil
- 5.2. Argentina
- 5.3. Rest of South America
Blood Group Typing Market REPORT HIGHLIGHTS
| Aspects | Details |
|---|---|
| Study Period | 2019-2033 |
| Base Year | 2024 |
| Estimated Year | 2025 |
| Forecast Period | 2025-2033 |
| Historical Period | 2019-2024 |
| Growth Rate | CAGR of 9.50% from 2019-2033 |
| Segmentation |
|
Table of Contents
- 1. Introduction
- 1.1. Research Scope
- 1.2. Market Segmentation
- 1.3. Research Methodology
- 1.4. Definitions and Assumptions
- 2. Executive Summary
- 2.1. Introduction
- 3. Market Dynamics
- 3.1. Introduction
- 3.2. Market Drivers
- 3.2.1 Increasing Demand for Blood Group Typing in Prenatal Testing; Growing Number of Road Accidents
- 3.2.2 Emergencies
- 3.2.3 and Trauma Cases Necessitating Blood Transfusions; Rising Number of Blood Donations
- 3.3. Market Restrains
- 3.3.1. Poor Blood Service Infrastructure; Lack of Awareness and Skilled Professionals
- 3.4. Market Trends
- 3.4.1. Blood Banks are expected to Witness Healthy Growth Over the Forecast Period
- 4. Market Factor Analysis
- 4.1. Porters Five Forces
- 4.2. Supply/Value Chain
- 4.3. PESTEL analysis
- 4.4. Market Entropy
- 4.5. Patent/Trademark Analysis
- 5. Global Blood Group Typing Market Analysis, Insights and Forecast, 2019-2031
- 5.1. Market Analysis, Insights and Forecast - by Product
- 5.1.1. Instruments
- 5.1.2. Consumables
- 5.1.3. Services
- 5.2. Market Analysis, Insights and Forecast - by Technique
- 5.2.1. PCR-based and Microarray
- 5.2.2. Assay-based
- 5.2.3. Massively Parallel Sequencing
- 5.2.4. Other
- 5.3. Market Analysis, Insights and Forecast - by Test Type
- 5.3.1. Antibody Screening
- 5.3.2. HLA Typing
- 5.3.3. Cross-matching Tests
- 5.3.4. ABO blood Tests
- 5.3.5. Other
- 5.4. Market Analysis, Insights and Forecast - by End User
- 5.4.1. Hospitals
- 5.4.2. Blood Banks
- 5.4.3. Others
- 5.5. Market Analysis, Insights and Forecast - by Region
- 5.5.1. North America
- 5.5.2. Europe
- 5.5.3. Asia Pacific
- 5.5.4. Middle East and Africa
- 5.5.5. South America
- 5.1. Market Analysis, Insights and Forecast - by Product
- 6. North America Blood Group Typing Market Analysis, Insights and Forecast, 2019-2031
- 6.1. Market Analysis, Insights and Forecast - by Product
- 6.1.1. Instruments
- 6.1.2. Consumables
- 6.1.3. Services
- 6.2. Market Analysis, Insights and Forecast - by Technique
- 6.2.1. PCR-based and Microarray
- 6.2.2. Assay-based
- 6.2.3. Massively Parallel Sequencing
- 6.2.4. Other
- 6.3. Market Analysis, Insights and Forecast - by Test Type
- 6.3.1. Antibody Screening
- 6.3.2. HLA Typing
- 6.3.3. Cross-matching Tests
- 6.3.4. ABO blood Tests
- 6.3.5. Other
- 6.4. Market Analysis, Insights and Forecast - by End User
- 6.4.1. Hospitals
- 6.4.2. Blood Banks
- 6.4.3. Others
- 6.1. Market Analysis, Insights and Forecast - by Product
- 7. Europe Blood Group Typing Market Analysis, Insights and Forecast, 2019-2031
- 7.1. Market Analysis, Insights and Forecast - by Product
- 7.1.1. Instruments
- 7.1.2. Consumables
- 7.1.3. Services
- 7.2. Market Analysis, Insights and Forecast - by Technique
- 7.2.1. PCR-based and Microarray
- 7.2.2. Assay-based
- 7.2.3. Massively Parallel Sequencing
- 7.2.4. Other
- 7.3. Market Analysis, Insights and Forecast - by Test Type
- 7.3.1. Antibody Screening
- 7.3.2. HLA Typing
- 7.3.3. Cross-matching Tests
- 7.3.4. ABO blood Tests
- 7.3.5. Other
- 7.4. Market Analysis, Insights and Forecast - by End User
- 7.4.1. Hospitals
- 7.4.2. Blood Banks
- 7.4.3. Others
- 7.1. Market Analysis, Insights and Forecast - by Product
- 8. Asia Pacific Blood Group Typing Market Analysis, Insights and Forecast, 2019-2031
- 8.1. Market Analysis, Insights and Forecast - by Product
- 8.1.1. Instruments
- 8.1.2. Consumables
- 8.1.3. Services
- 8.2. Market Analysis, Insights and Forecast - by Technique
- 8.2.1. PCR-based and Microarray
- 8.2.2. Assay-based
- 8.2.3. Massively Parallel Sequencing
- 8.2.4. Other
- 8.3. Market Analysis, Insights and Forecast - by Test Type
- 8.3.1. Antibody Screening
- 8.3.2. HLA Typing
- 8.3.3. Cross-matching Tests
- 8.3.4. ABO blood Tests
- 8.3.5. Other
- 8.4. Market Analysis, Insights and Forecast - by End User
- 8.4.1. Hospitals
- 8.4.2. Blood Banks
- 8.4.3. Others
- 8.1. Market Analysis, Insights and Forecast - by Product
- 9. Middle East and Africa Blood Group Typing Market Analysis, Insights and Forecast, 2019-2031
- 9.1. Market Analysis, Insights and Forecast - by Product
- 9.1.1. Instruments
- 9.1.2. Consumables
- 9.1.3. Services
- 9.2. Market Analysis, Insights and Forecast - by Technique
- 9.2.1. PCR-based and Microarray
- 9.2.2. Assay-based
- 9.2.3. Massively Parallel Sequencing
- 9.2.4. Other
- 9.3. Market Analysis, Insights and Forecast - by Test Type
- 9.3.1. Antibody Screening
- 9.3.2. HLA Typing
- 9.3.3. Cross-matching Tests
- 9.3.4. ABO blood Tests
- 9.3.5. Other
- 9.4. Market Analysis, Insights and Forecast - by End User
- 9.4.1. Hospitals
- 9.4.2. Blood Banks
- 9.4.3. Others
- 9.1. Market Analysis, Insights and Forecast - by Product
- 10. South America Blood Group Typing Market Analysis, Insights and Forecast, 2019-2031
- 10.1. Market Analysis, Insights and Forecast - by Product
- 10.1.1. Instruments
- 10.1.2. Consumables
- 10.1.3. Services
- 10.2. Market Analysis, Insights and Forecast - by Technique
- 10.2.1. PCR-based and Microarray
- 10.2.2. Assay-based
- 10.2.3. Massively Parallel Sequencing
- 10.2.4. Other
- 10.3. Market Analysis, Insights and Forecast - by Test Type
- 10.3.1. Antibody Screening
- 10.3.2. HLA Typing
- 10.3.3. Cross-matching Tests
- 10.3.4. ABO blood Tests
- 10.3.5. Other
- 10.4. Market Analysis, Insights and Forecast - by End User
- 10.4.1. Hospitals
- 10.4.2. Blood Banks
- 10.4.3. Others
- 10.1. Market Analysis, Insights and Forecast - by Product
- 11. North America Blood Group Typing Market Analysis, Insights and Forecast, 2019-2031
- 11.1. Market Analysis, Insights and Forecast - By Country/Sub-region
- 11.1.1 United States
- 11.1.2 Canada
- 11.1.3 Mexico
- 12. Europe Blood Group Typing Market Analysis, Insights and Forecast, 2019-2031
- 12.1. Market Analysis, Insights and Forecast - By Country/Sub-region
- 12.1.1 Germany
- 12.1.2 United Kingdom
- 12.1.3 France
- 12.1.4 Italy
- 12.1.5 Spain
- 12.1.6 Rest of Europe
- 13. Asia Pacific Blood Group Typing Market Analysis, Insights and Forecast, 2019-2031
- 13.1. Market Analysis, Insights and Forecast - By Country/Sub-region
- 13.1.1 China
- 13.1.2 Japan
- 13.1.3 India
- 13.1.4 Australia
- 13.1.5 South Korea
- 13.1.6 Rest of Asia Pacific
- 14. Middle East and Africa Blood Group Typing Market Analysis, Insights and Forecast, 2019-2031
- 14.1. Market Analysis, Insights and Forecast - By Country/Sub-region
- 14.1.1 GCC
- 14.1.2 South Africa
- 14.1.3 Rest of Middle East and Africa
- 15. South America Blood Group Typing Market Analysis, Insights and Forecast, 2019-2031
- 15.1. Market Analysis, Insights and Forecast - By Country/Sub-region
- 15.1.1 Brazil
- 15.1.2 Argentina
- 15.1.3 Rest of South America
- 16. Competitive Analysis
- 16.1. Global Market Share Analysis 2024
- 16.2. Company Profiles
- 16.2.1 Bio-Rad Laboratories Inc
- 16.2.1.1. Overview
- 16.2.1.2. Products
- 16.2.1.3. SWOT Analysis
- 16.2.1.4. Recent Developments
- 16.2.1.5. Financials (Based on Availability)
- 16.2.2 Merck KGaA
- 16.2.2.1. Overview
- 16.2.2.2. Products
- 16.2.2.3. SWOT Analysis
- 16.2.2.4. Recent Developments
- 16.2.2.5. Financials (Based on Availability)
- 16.2.3 Quotient Ltd
- 16.2.3.1. Overview
- 16.2.3.2. Products
- 16.2.3.3. SWOT Analysis
- 16.2.3.4. Recent Developments
- 16.2.3.5. Financials (Based on Availability)
- 16.2.4 AXO Science
- 16.2.4.1. Overview
- 16.2.4.2. Products
- 16.2.4.3. SWOT Analysis
- 16.2.4.4. Recent Developments
- 16.2.4.5. Financials (Based on Availability)
- 16.2.5 DIAGAST
- 16.2.5.1. Overview
- 16.2.5.2. Products
- 16.2.5.3. SWOT Analysis
- 16.2.5.4. Recent Developments
- 16.2.5.5. Financials (Based on Availability)
- 16.2.6 Thermo Fisher Scientific
- 16.2.6.1. Overview
- 16.2.6.2. Products
- 16.2.6.3. SWOT Analysis
- 16.2.6.4. Recent Developments
- 16.2.6.5. Financials (Based on Availability)
- 16.2.7 Grifols S A
- 16.2.7.1. Overview
- 16.2.7.2. Products
- 16.2.7.3. SWOT Analysis
- 16.2.7.4. Recent Developments
- 16.2.7.5. Financials (Based on Availability)
- 16.2.8 Danaher Corporation (Beckman Coulter)
- 16.2.8.1. Overview
- 16.2.8.2. Products
- 16.2.8.3. SWOT Analysis
- 16.2.8.4. Recent Developments
- 16.2.8.5. Financials (Based on Availability)
- 16.2.9 Mesa Laboratories Inc (Agena Bioscience Inc )
- 16.2.9.1. Overview
- 16.2.9.2. Products
- 16.2.9.3. SWOT Analysis
- 16.2.9.4. Recent Developments
- 16.2.9.5. Financials (Based on Availability)
- 16.2.1 Bio-Rad Laboratories Inc
List of Figures
- Figure 1: Global Blood Group Typing Market Revenue Breakdown (Million, %) by Region 2024 & 2032
- Figure 2: Global Blood Group Typing Market Volume Breakdown (K Unit, %) by Region 2024 & 2032
- Figure 3: North America Blood Group Typing Market Revenue (Million), by Country 2024 & 2032
- Figure 4: North America Blood Group Typing Market Volume (K Unit), by Country 2024 & 2032
- Figure 5: North America Blood Group Typing Market Revenue Share (%), by Country 2024 & 2032
- Figure 6: North America Blood Group Typing Market Volume Share (%), by Country 2024 & 2032
- Figure 7: Europe Blood Group Typing Market Revenue (Million), by Country 2024 & 2032
- Figure 8: Europe Blood Group Typing Market Volume (K Unit), by Country 2024 & 2032
- Figure 9: Europe Blood Group Typing Market Revenue Share (%), by Country 2024 & 2032
- Figure 10: Europe Blood Group Typing Market Volume Share (%), by Country 2024 & 2032
- Figure 11: Asia Pacific Blood Group Typing Market Revenue (Million), by Country 2024 & 2032
- Figure 12: Asia Pacific Blood Group Typing Market Volume (K Unit), by Country 2024 & 2032
- Figure 13: Asia Pacific Blood Group Typing Market Revenue Share (%), by Country 2024 & 2032
- Figure 14: Asia Pacific Blood Group Typing Market Volume Share (%), by Country 2024 & 2032
- Figure 15: Middle East and Africa Blood Group Typing Market Revenue (Million), by Country 2024 & 2032
- Figure 16: Middle East and Africa Blood Group Typing Market Volume (K Unit), by Country 2024 & 2032
- Figure 17: Middle East and Africa Blood Group Typing Market Revenue Share (%), by Country 2024 & 2032
- Figure 18: Middle East and Africa Blood Group Typing Market Volume Share (%), by Country 2024 & 2032
- Figure 19: South America Blood Group Typing Market Revenue (Million), by Country 2024 & 2032
- Figure 20: South America Blood Group Typing Market Volume (K Unit), by Country 2024 & 2032
- Figure 21: South America Blood Group Typing Market Revenue Share (%), by Country 2024 & 2032
- Figure 22: South America Blood Group Typing Market Volume Share (%), by Country 2024 & 2032
- Figure 23: North America Blood Group Typing Market Revenue (Million), by Product 2024 & 2032
- Figure 24: North America Blood Group Typing Market Volume (K Unit), by Product 2024 & 2032
- Figure 25: North America Blood Group Typing Market Revenue Share (%), by Product 2024 & 2032
- Figure 26: North America Blood Group Typing Market Volume Share (%), by Product 2024 & 2032
- Figure 27: North America Blood Group Typing Market Revenue (Million), by Technique 2024 & 2032
- Figure 28: North America Blood Group Typing Market Volume (K Unit), by Technique 2024 & 2032
- Figure 29: North America Blood Group Typing Market Revenue Share (%), by Technique 2024 & 2032
- Figure 30: North America Blood Group Typing Market Volume Share (%), by Technique 2024 & 2032
- Figure 31: North America Blood Group Typing Market Revenue (Million), by Test Type 2024 & 2032
- Figure 32: North America Blood Group Typing Market Volume (K Unit), by Test Type 2024 & 2032
- Figure 33: North America Blood Group Typing Market Revenue Share (%), by Test Type 2024 & 2032
- Figure 34: North America Blood Group Typing Market Volume Share (%), by Test Type 2024 & 2032
- Figure 35: North America Blood Group Typing Market Revenue (Million), by End User 2024 & 2032
- Figure 36: North America Blood Group Typing Market Volume (K Unit), by End User 2024 & 2032
- Figure 37: North America Blood Group Typing Market Revenue Share (%), by End User 2024 & 2032
- Figure 38: North America Blood Group Typing Market Volume Share (%), by End User 2024 & 2032
- Figure 39: North America Blood Group Typing Market Revenue (Million), by Country 2024 & 2032
- Figure 40: North America Blood Group Typing Market Volume (K Unit), by Country 2024 & 2032
- Figure 41: North America Blood Group Typing Market Revenue Share (%), by Country 2024 & 2032
- Figure 42: North America Blood Group Typing Market Volume Share (%), by Country 2024 & 2032
- Figure 43: Europe Blood Group Typing Market Revenue (Million), by Product 2024 & 2032
- Figure 44: Europe Blood Group Typing Market Volume (K Unit), by Product 2024 & 2032
- Figure 45: Europe Blood Group Typing Market Revenue Share (%), by Product 2024 & 2032
- Figure 46: Europe Blood Group Typing Market Volume Share (%), by Product 2024 & 2032
- Figure 47: Europe Blood Group Typing Market Revenue (Million), by Technique 2024 & 2032
- Figure 48: Europe Blood Group Typing Market Volume (K Unit), by Technique 2024 & 2032
- Figure 49: Europe Blood Group Typing Market Revenue Share (%), by Technique 2024 & 2032
- Figure 50: Europe Blood Group Typing Market Volume Share (%), by Technique 2024 & 2032
- Figure 51: Europe Blood Group Typing Market Revenue (Million), by Test Type 2024 & 2032
- Figure 52: Europe Blood Group Typing Market Volume (K Unit), by Test Type 2024 & 2032
- Figure 53: Europe Blood Group Typing Market Revenue Share (%), by Test Type 2024 & 2032
- Figure 54: Europe Blood Group Typing Market Volume Share (%), by Test Type 2024 & 2032
- Figure 55: Europe Blood Group Typing Market Revenue (Million), by End User 2024 & 2032
- Figure 56: Europe Blood Group Typing Market Volume (K Unit), by End User 2024 & 2032
- Figure 57: Europe Blood Group Typing Market Revenue Share (%), by End User 2024 & 2032
- Figure 58: Europe Blood Group Typing Market Volume Share (%), by End User 2024 & 2032
- Figure 59: Europe Blood Group Typing Market Revenue (Million), by Country 2024 & 2032
- Figure 60: Europe Blood Group Typing Market Volume (K Unit), by Country 2024 & 2032
- Figure 61: Europe Blood Group Typing Market Revenue Share (%), by Country 2024 & 2032
- Figure 62: Europe Blood Group Typing Market Volume Share (%), by Country 2024 & 2032
- Figure 63: Asia Pacific Blood Group Typing Market Revenue (Million), by Product 2024 & 2032
- Figure 64: Asia Pacific Blood Group Typing Market Volume (K Unit), by Product 2024 & 2032
- Figure 65: Asia Pacific Blood Group Typing Market Revenue Share (%), by Product 2024 & 2032
- Figure 66: Asia Pacific Blood Group Typing Market Volume Share (%), by Product 2024 & 2032
- Figure 67: Asia Pacific Blood Group Typing Market Revenue (Million), by Technique 2024 & 2032
- Figure 68: Asia Pacific Blood Group Typing Market Volume (K Unit), by Technique 2024 & 2032
- Figure 69: Asia Pacific Blood Group Typing Market Revenue Share (%), by Technique 2024 & 2032
- Figure 70: Asia Pacific Blood Group Typing Market Volume Share (%), by Technique 2024 & 2032
- Figure 71: Asia Pacific Blood Group Typing Market Revenue (Million), by Test Type 2024 & 2032
- Figure 72: Asia Pacific Blood Group Typing Market Volume (K Unit), by Test Type 2024 & 2032
- Figure 73: Asia Pacific Blood Group Typing Market Revenue Share (%), by Test Type 2024 & 2032
- Figure 74: Asia Pacific Blood Group Typing Market Volume Share (%), by Test Type 2024 & 2032
- Figure 75: Asia Pacific Blood Group Typing Market Revenue (Million), by End User 2024 & 2032
- Figure 76: Asia Pacific Blood Group Typing Market Volume (K Unit), by End User 2024 & 2032
- Figure 77: Asia Pacific Blood Group Typing Market Revenue Share (%), by End User 2024 & 2032
- Figure 78: Asia Pacific Blood Group Typing Market Volume Share (%), by End User 2024 & 2032
- Figure 79: Asia Pacific Blood Group Typing Market Revenue (Million), by Country 2024 & 2032
- Figure 80: Asia Pacific Blood Group Typing Market Volume (K Unit), by Country 2024 & 2032
- Figure 81: Asia Pacific Blood Group Typing Market Revenue Share (%), by Country 2024 & 2032
- Figure 82: Asia Pacific Blood Group Typing Market Volume Share (%), by Country 2024 & 2032
- Figure 83: Middle East and Africa Blood Group Typing Market Revenue (Million), by Product 2024 & 2032
- Figure 84: Middle East and Africa Blood Group Typing Market Volume (K Unit), by Product 2024 & 2032
- Figure 85: Middle East and Africa Blood Group Typing Market Revenue Share (%), by Product 2024 & 2032
- Figure 86: Middle East and Africa Blood Group Typing Market Volume Share (%), by Product 2024 & 2032
- Figure 87: Middle East and Africa Blood Group Typing Market Revenue (Million), by Technique 2024 & 2032
- Figure 88: Middle East and Africa Blood Group Typing Market Volume (K Unit), by Technique 2024 & 2032
- Figure 89: Middle East and Africa Blood Group Typing Market Revenue Share (%), by Technique 2024 & 2032
- Figure 90: Middle East and Africa Blood Group Typing Market Volume Share (%), by Technique 2024 & 2032
- Figure 91: Middle East and Africa Blood Group Typing Market Revenue (Million), by Test Type 2024 & 2032
- Figure 92: Middle East and Africa Blood Group Typing Market Volume (K Unit), by Test Type 2024 & 2032
- Figure 93: Middle East and Africa Blood Group Typing Market Revenue Share (%), by Test Type 2024 & 2032
- Figure 94: Middle East and Africa Blood Group Typing Market Volume Share (%), by Test Type 2024 & 2032
- Figure 95: Middle East and Africa Blood Group Typing Market Revenue (Million), by End User 2024 & 2032
- Figure 96: Middle East and Africa Blood Group Typing Market Volume (K Unit), by End User 2024 & 2032
- Figure 97: Middle East and Africa Blood Group Typing Market Revenue Share (%), by End User 2024 & 2032
- Figure 98: Middle East and Africa Blood Group Typing Market Volume Share (%), by End User 2024 & 2032
- Figure 99: Middle East and Africa Blood Group Typing Market Revenue (Million), by Country 2024 & 2032
- Figure 100: Middle East and Africa Blood Group Typing Market Volume (K Unit), by Country 2024 & 2032
- Figure 101: Middle East and Africa Blood Group Typing Market Revenue Share (%), by Country 2024 & 2032
- Figure 102: Middle East and Africa Blood Group Typing Market Volume Share (%), by Country 2024 & 2032
- Figure 103: South America Blood Group Typing Market Revenue (Million), by Product 2024 & 2032
- Figure 104: South America Blood Group Typing Market Volume (K Unit), by Product 2024 & 2032
- Figure 105: South America Blood Group Typing Market Revenue Share (%), by Product 2024 & 2032
- Figure 106: South America Blood Group Typing Market Volume Share (%), by Product 2024 & 2032
- Figure 107: South America Blood Group Typing Market Revenue (Million), by Technique 2024 & 2032
- Figure 108: South America Blood Group Typing Market Volume (K Unit), by Technique 2024 & 2032
- Figure 109: South America Blood Group Typing Market Revenue Share (%), by Technique 2024 & 2032
- Figure 110: South America Blood Group Typing Market Volume Share (%), by Technique 2024 & 2032
- Figure 111: South America Blood Group Typing Market Revenue (Million), by Test Type 2024 & 2032
- Figure 112: South America Blood Group Typing Market Volume (K Unit), by Test Type 2024 & 2032
- Figure 113: South America Blood Group Typing Market Revenue Share (%), by Test Type 2024 & 2032
- Figure 114: South America Blood Group Typing Market Volume Share (%), by Test Type 2024 & 2032
- Figure 115: South America Blood Group Typing Market Revenue (Million), by End User 2024 & 2032
- Figure 116: South America Blood Group Typing Market Volume (K Unit), by End User 2024 & 2032
- Figure 117: South America Blood Group Typing Market Revenue Share (%), by End User 2024 & 2032
- Figure 118: South America Blood Group Typing Market Volume Share (%), by End User 2024 & 2032
- Figure 119: South America Blood Group Typing Market Revenue (Million), by Country 2024 & 2032
- Figure 120: South America Blood Group Typing Market Volume (K Unit), by Country 2024 & 2032
- Figure 121: South America Blood Group Typing Market Revenue Share (%), by Country 2024 & 2032
- Figure 122: South America Blood Group Typing Market Volume Share (%), by Country 2024 & 2032
List of Tables
- Table 1: Global Blood Group Typing Market Revenue Million Forecast, by Region 2019 & 2032
- Table 2: Global Blood Group Typing Market Volume K Unit Forecast, by Region 2019 & 2032
- Table 3: Global Blood Group Typing Market Revenue Million Forecast, by Product 2019 & 2032
- Table 4: Global Blood Group Typing Market Volume K Unit Forecast, by Product 2019 & 2032
- Table 5: Global Blood Group Typing Market Revenue Million Forecast, by Technique 2019 & 2032
- Table 6: Global Blood Group Typing Market Volume K Unit Forecast, by Technique 2019 & 2032
- Table 7: Global Blood Group Typing Market Revenue Million Forecast, by Test Type 2019 & 2032
- Table 8: Global Blood Group Typing Market Volume K Unit Forecast, by Test Type 2019 & 2032
- Table 9: Global Blood Group Typing Market Revenue Million Forecast, by End User 2019 & 2032
- Table 10: Global Blood Group Typing Market Volume K Unit Forecast, by End User 2019 & 2032
- Table 11: Global Blood Group Typing Market Revenue Million Forecast, by Region 2019 & 2032
- Table 12: Global Blood Group Typing Market Volume K Unit Forecast, by Region 2019 & 2032
- Table 13: Global Blood Group Typing Market Revenue Million Forecast, by Country 2019 & 2032
- Table 14: Global Blood Group Typing Market Volume K Unit Forecast, by Country 2019 & 2032
- Table 15: United States Blood Group Typing Market Revenue (Million) Forecast, by Application 2019 & 2032
- Table 16: United States Blood Group Typing Market Volume (K Unit) Forecast, by Application 2019 & 2032
- Table 17: Canada Blood Group Typing Market Revenue (Million) Forecast, by Application 2019 & 2032
- Table 18: Canada Blood Group Typing Market Volume (K Unit) Forecast, by Application 2019 & 2032
- Table 19: Mexico Blood Group Typing Market Revenue (Million) Forecast, by Application 2019 & 2032
- Table 20: Mexico Blood Group Typing Market Volume (K Unit) Forecast, by Application 2019 & 2032
- Table 21: Global Blood Group Typing Market Revenue Million Forecast, by Country 2019 & 2032
- Table 22: Global Blood Group Typing Market Volume K Unit Forecast, by Country 2019 & 2032
- Table 23: Germany Blood Group Typing Market Revenue (Million) Forecast, by Application 2019 & 2032
- Table 24: Germany Blood Group Typing Market Volume (K Unit) Forecast, by Application 2019 & 2032
- Table 25: United Kingdom Blood Group Typing Market Revenue (Million) Forecast, by Application 2019 & 2032
- Table 26: United Kingdom Blood Group Typing Market Volume (K Unit) Forecast, by Application 2019 & 2032
- Table 27: France Blood Group Typing Market Revenue (Million) Forecast, by Application 2019 & 2032
- Table 28: France Blood Group Typing Market Volume (K Unit) Forecast, by Application 2019 & 2032
- Table 29: Italy Blood Group Typing Market Revenue (Million) Forecast, by Application 2019 & 2032
- Table 30: Italy Blood Group Typing Market Volume (K Unit) Forecast, by Application 2019 & 2032
- Table 31: Spain Blood Group Typing Market Revenue (Million) Forecast, by Application 2019 & 2032
- Table 32: Spain Blood Group Typing Market Volume (K Unit) Forecast, by Application 2019 & 2032
- Table 33: Rest of Europe Blood Group Typing Market Revenue (Million) Forecast, by Application 2019 & 2032
- Table 34: Rest of Europe Blood Group Typing Market Volume (K Unit) Forecast, by Application 2019 & 2032
- Table 35: Global Blood Group Typing Market Revenue Million Forecast, by Country 2019 & 2032
- Table 36: Global Blood Group Typing Market Volume K Unit Forecast, by Country 2019 & 2032
- Table 37: China Blood Group Typing Market Revenue (Million) Forecast, by Application 2019 & 2032
- Table 38: China Blood Group Typing Market Volume (K Unit) Forecast, by Application 2019 & 2032
- Table 39: Japan Blood Group Typing Market Revenue (Million) Forecast, by Application 2019 & 2032
- Table 40: Japan Blood Group Typing Market Volume (K Unit) Forecast, by Application 2019 & 2032
- Table 41: India Blood Group Typing Market Revenue (Million) Forecast, by Application 2019 & 2032
- Table 42: India Blood Group Typing Market Volume (K Unit) Forecast, by Application 2019 & 2032
- Table 43: Australia Blood Group Typing Market Revenue (Million) Forecast, by Application 2019 & 2032
- Table 44: Australia Blood Group Typing Market Volume (K Unit) Forecast, by Application 2019 & 2032
- Table 45: South Korea Blood Group Typing Market Revenue (Million) Forecast, by Application 2019 & 2032
- Table 46: South Korea Blood Group Typing Market Volume (K Unit) Forecast, by Application 2019 & 2032
- Table 47: Rest of Asia Pacific Blood Group Typing Market Revenue (Million) Forecast, by Application 2019 & 2032
- Table 48: Rest of Asia Pacific Blood Group Typing Market Volume (K Unit) Forecast, by Application 2019 & 2032
- Table 49: Global Blood Group Typing Market Revenue Million Forecast, by Country 2019 & 2032
- Table 50: Global Blood Group Typing Market Volume K Unit Forecast, by Country 2019 & 2032
- Table 51: GCC Blood Group Typing Market Revenue (Million) Forecast, by Application 2019 & 2032
- Table 52: GCC Blood Group Typing Market Volume (K Unit) Forecast, by Application 2019 & 2032
- Table 53: South Africa Blood Group Typing Market Revenue (Million) Forecast, by Application 2019 & 2032
- Table 54: South Africa Blood Group Typing Market Volume (K Unit) Forecast, by Application 2019 & 2032
- Table 55: Rest of Middle East and Africa Blood Group Typing Market Revenue (Million) Forecast, by Application 2019 & 2032
- Table 56: Rest of Middle East and Africa Blood Group Typing Market Volume (K Unit) Forecast, by Application 2019 & 2032
- Table 57: Global Blood Group Typing Market Revenue Million Forecast, by Country 2019 & 2032
- Table 58: Global Blood Group Typing Market Volume K Unit Forecast, by Country 2019 & 2032
- Table 59: Brazil Blood Group Typing Market Revenue (Million) Forecast, by Application 2019 & 2032
- Table 60: Brazil Blood Group Typing Market Volume (K Unit) Forecast, by Application 2019 & 2032
- Table 61: Argentina Blood Group Typing Market Revenue (Million) Forecast, by Application 2019 & 2032
- Table 62: Argentina Blood Group Typing Market Volume (K Unit) Forecast, by Application 2019 & 2032
- Table 63: Rest of South America Blood Group Typing Market Revenue (Million) Forecast, by Application 2019 & 2032
- Table 64: Rest of South America Blood Group Typing Market Volume (K Unit) Forecast, by Application 2019 & 2032
- Table 65: Global Blood Group Typing Market Revenue Million Forecast, by Product 2019 & 2032
- Table 66: Global Blood Group Typing Market Volume K Unit Forecast, by Product 2019 & 2032
- Table 67: Global Blood Group Typing Market Revenue Million Forecast, by Technique 2019 & 2032
- Table 68: Global Blood Group Typing Market Volume K Unit Forecast, by Technique 2019 & 2032
- Table 69: Global Blood Group Typing Market Revenue Million Forecast, by Test Type 2019 & 2032
- Table 70: Global Blood Group Typing Market Volume K Unit Forecast, by Test Type 2019 & 2032
- Table 71: Global Blood Group Typing Market Revenue Million Forecast, by End User 2019 & 2032
- Table 72: Global Blood Group Typing Market Volume K Unit Forecast, by End User 2019 & 2032
- Table 73: Global Blood Group Typing Market Revenue Million Forecast, by Country 2019 & 2032
- Table 74: Global Blood Group Typing Market Volume K Unit Forecast, by Country 2019 & 2032
- Table 75: United States Blood Group Typing Market Revenue (Million) Forecast, by Application 2019 & 2032
- Table 76: United States Blood Group Typing Market Volume (K Unit) Forecast, by Application 2019 & 2032
- Table 77: Canada Blood Group Typing Market Revenue (Million) Forecast, by Application 2019 & 2032
- Table 78: Canada Blood Group Typing Market Volume (K Unit) Forecast, by Application 2019 & 2032
- Table 79: Mexico Blood Group Typing Market Revenue (Million) Forecast, by Application 2019 & 2032
- Table 80: Mexico Blood Group Typing Market Volume (K Unit) Forecast, by Application 2019 & 2032
- Table 81: Global Blood Group Typing Market Revenue Million Forecast, by Product 2019 & 2032
- Table 82: Global Blood Group Typing Market Volume K Unit Forecast, by Product 2019 & 2032
- Table 83: Global Blood Group Typing Market Revenue Million Forecast, by Technique 2019 & 2032
- Table 84: Global Blood Group Typing Market Volume K Unit Forecast, by Technique 2019 & 2032
- Table 85: Global Blood Group Typing Market Revenue Million Forecast, by Test Type 2019 & 2032
- Table 86: Global Blood Group Typing Market Volume K Unit Forecast, by Test Type 2019 & 2032
- Table 87: Global Blood Group Typing Market Revenue Million Forecast, by End User 2019 & 2032
- Table 88: Global Blood Group Typing Market Volume K Unit Forecast, by End User 2019 & 2032
- Table 89: Global Blood Group Typing Market Revenue Million Forecast, by Country 2019 & 2032
- Table 90: Global Blood Group Typing Market Volume K Unit Forecast, by Country 2019 & 2032
- Table 91: Germany Blood Group Typing Market Revenue (Million) Forecast, by Application 2019 & 2032
- Table 92: Germany Blood Group Typing Market Volume (K Unit) Forecast, by Application 2019 & 2032
- Table 93: United Kingdom Blood Group Typing Market Revenue (Million) Forecast, by Application 2019 & 2032
- Table 94: United Kingdom Blood Group Typing Market Volume (K Unit) Forecast, by Application 2019 & 2032
- Table 95: France Blood Group Typing Market Revenue (Million) Forecast, by Application 2019 & 2032
- Table 96: France Blood Group Typing Market Volume (K Unit) Forecast, by Application 2019 & 2032
- Table 97: Italy Blood Group Typing Market Revenue (Million) Forecast, by Application 2019 & 2032
- Table 98: Italy Blood Group Typing Market Volume (K Unit) Forecast, by Application 2019 & 2032
- Table 99: Spain Blood Group Typing Market Revenue (Million) Forecast, by Application 2019 & 2032
- Table 100: Spain Blood Group Typing Market Volume (K Unit) Forecast, by Application 2019 & 2032
- Table 101: Rest of Europe Blood Group Typing Market Revenue (Million) Forecast, by Application 2019 & 2032
- Table 102: Rest of Europe Blood Group Typing Market Volume (K Unit) Forecast, by Application 2019 & 2032
- Table 103: Global Blood Group Typing Market Revenue Million Forecast, by Product 2019 & 2032
- Table 104: Global Blood Group Typing Market Volume K Unit Forecast, by Product 2019 & 2032
- Table 105: Global Blood Group Typing Market Revenue Million Forecast, by Technique 2019 & 2032
- Table 106: Global Blood Group Typing Market Volume K Unit Forecast, by Technique 2019 & 2032
- Table 107: Global Blood Group Typing Market Revenue Million Forecast, by Test Type 2019 & 2032
- Table 108: Global Blood Group Typing Market Volume K Unit Forecast, by Test Type 2019 & 2032
- Table 109: Global Blood Group Typing Market Revenue Million Forecast, by End User 2019 & 2032
- Table 110: Global Blood Group Typing Market Volume K Unit Forecast, by End User 2019 & 2032
- Table 111: Global Blood Group Typing Market Revenue Million Forecast, by Country 2019 & 2032
- Table 112: Global Blood Group Typing Market Volume K Unit Forecast, by Country 2019 & 2032
- Table 113: China Blood Group Typing Market Revenue (Million) Forecast, by Application 2019 & 2032
- Table 114: China Blood Group Typing Market Volume (K Unit) Forecast, by Application 2019 & 2032
- Table 115: Japan Blood Group Typing Market Revenue (Million) Forecast, by Application 2019 & 2032
- Table 116: Japan Blood Group Typing Market Volume (K Unit) Forecast, by Application 2019 & 2032
- Table 117: India Blood Group Typing Market Revenue (Million) Forecast, by Application 2019 & 2032
- Table 118: India Blood Group Typing Market Volume (K Unit) Forecast, by Application 2019 & 2032
- Table 119: Australia Blood Group Typing Market Revenue (Million) Forecast, by Application 2019 & 2032
- Table 120: Australia Blood Group Typing Market Volume (K Unit) Forecast, by Application 2019 & 2032
- Table 121: South Korea Blood Group Typing Market Revenue (Million) Forecast, by Application 2019 & 2032
- Table 122: South Korea Blood Group Typing Market Volume (K Unit) Forecast, by Application 2019 & 2032
- Table 123: Rest of Asia Pacific Blood Group Typing Market Revenue (Million) Forecast, by Application 2019 & 2032
- Table 124: Rest of Asia Pacific Blood Group Typing Market Volume (K Unit) Forecast, by Application 2019 & 2032
- Table 125: Global Blood Group Typing Market Revenue Million Forecast, by Product 2019 & 2032
- Table 126: Global Blood Group Typing Market Volume K Unit Forecast, by Product 2019 & 2032
- Table 127: Global Blood Group Typing Market Revenue Million Forecast, by Technique 2019 & 2032
- Table 128: Global Blood Group Typing Market Volume K Unit Forecast, by Technique 2019 & 2032
- Table 129: Global Blood Group Typing Market Revenue Million Forecast, by Test Type 2019 & 2032
- Table 130: Global Blood Group Typing Market Volume K Unit Forecast, by Test Type 2019 & 2032
- Table 131: Global Blood Group Typing Market Revenue Million Forecast, by End User 2019 & 2032
- Table 132: Global Blood Group Typing Market Volume K Unit Forecast, by End User 2019 & 2032
- Table 133: Global Blood Group Typing Market Revenue Million Forecast, by Country 2019 & 2032
- Table 134: Global Blood Group Typing Market Volume K Unit Forecast, by Country 2019 & 2032
- Table 135: GCC Blood Group Typing Market Revenue (Million) Forecast, by Application 2019 & 2032
- Table 136: GCC Blood Group Typing Market Volume (K Unit) Forecast, by Application 2019 & 2032
- Table 137: South Africa Blood Group Typing Market Revenue (Million) Forecast, by Application 2019 & 2032
- Table 138: South Africa Blood Group Typing Market Volume (K Unit) Forecast, by Application 2019 & 2032
- Table 139: Rest of Middle East and Africa Blood Group Typing Market Revenue (Million) Forecast, by Application 2019 & 2032
- Table 140: Rest of Middle East and Africa Blood Group Typing Market Volume (K Unit) Forecast, by Application 2019 & 2032
- Table 141: Global Blood Group Typing Market Revenue Million Forecast, by Product 2019 & 2032
- Table 142: Global Blood Group Typing Market Volume K Unit Forecast, by Product 2019 & 2032
- Table 143: Global Blood Group Typing Market Revenue Million Forecast, by Technique 2019 & 2032
- Table 144: Global Blood Group Typing Market Volume K Unit Forecast, by Technique 2019 & 2032
- Table 145: Global Blood Group Typing Market Revenue Million Forecast, by Test Type 2019 & 2032
- Table 146: Global Blood Group Typing Market Volume K Unit Forecast, by Test Type 2019 & 2032
- Table 147: Global Blood Group Typing Market Revenue Million Forecast, by End User 2019 & 2032
- Table 148: Global Blood Group Typing Market Volume K Unit Forecast, by End User 2019 & 2032
- Table 149: Global Blood Group Typing Market Revenue Million Forecast, by Country 2019 & 2032
- Table 150: Global Blood Group Typing Market Volume K Unit Forecast, by Country 2019 & 2032
- Table 151: Brazil Blood Group Typing Market Revenue (Million) Forecast, by Application 2019 & 2032
- Table 152: Brazil Blood Group Typing Market Volume (K Unit) Forecast, by Application 2019 & 2032
- Table 153: Argentina Blood Group Typing Market Revenue (Million) Forecast, by Application 2019 & 2032
- Table 154: Argentina Blood Group Typing Market Volume (K Unit) Forecast, by Application 2019 & 2032
- Table 155: Rest of South America Blood Group Typing Market Revenue (Million) Forecast, by Application 2019 & 2032
- Table 156: Rest of South America Blood Group Typing Market Volume (K Unit) Forecast, by Application 2019 & 2032
Frequently Asked Questions
1. What is the projected Compound Annual Growth Rate (CAGR) of the Blood Group Typing Market?
The projected CAGR is approximately 9.50%.
2. Which companies are prominent players in the Blood Group Typing Market?
Key companies in the market include Bio-Rad Laboratories Inc, Merck KGaA, Quotient Ltd, AXO Science, DIAGAST, Thermo Fisher Scientific, Grifols S A, Danaher Corporation (Beckman Coulter), Mesa Laboratories Inc (Agena Bioscience Inc ).
3. What are the main segments of the Blood Group Typing Market?
The market segments include Product, Technique, Test Type, End User.
4. Can you provide details about the market size?
The market size is estimated to be USD XX Million as of 2022.
5. What are some drivers contributing to market growth?
Increasing Demand for Blood Group Typing in Prenatal Testing; Growing Number of Road Accidents. Emergencies. and Trauma Cases Necessitating Blood Transfusions; Rising Number of Blood Donations.
6. What are the notable trends driving market growth?
Blood Banks are expected to Witness Healthy Growth Over the Forecast Period.
7. Are there any restraints impacting market growth?
Poor Blood Service Infrastructure; Lack of Awareness and Skilled Professionals.
8. Can you provide examples of recent developments in the market?
In April 2022, Grifols, a global pioneer in plasma-derived pharmaceuticals, announced its acquisition of Tiancheng (Germany) Pharmaceutical Holdings AG's 100% share capital. Grifols' acquisition of Biotest AG, which is majorly owned by Tiancheng (Germany) Pharmaceutical Holdings AG, allows it to accelerate and broaden its product range, boost patient access to plasma medicines, operate the most extensive private European network of plasma facilities (87 sites), and increase business and margin expansion.
9. What pricing options are available for accessing the report?
Pricing options include single-user, multi-user, and enterprise licenses priced at USD 4750, USD 5250, and USD 8750 respectively.
10. Is the market size provided in terms of value or volume?
The market size is provided in terms of value, measured in Million and volume, measured in K Unit.
11. Are there any specific market keywords associated with the report?
Yes, the market keyword associated with the report is "Blood Group Typing Market," which aids in identifying and referencing the specific market segment covered.
12. How do I determine which pricing option suits my needs best?
The pricing options vary based on user requirements and access needs. Individual users may opt for single-user licenses, while businesses requiring broader access may choose multi-user or enterprise licenses for cost-effective access to the report.
13. Are there any additional resources or data provided in the Blood Group Typing Market report?
While the report offers comprehensive insights, it's advisable to review the specific contents or supplementary materials provided to ascertain if additional resources or data are available.
14. How can I stay updated on further developments or reports in the Blood Group Typing Market?
To stay informed about further developments, trends, and reports in the Blood Group Typing Market, consider subscribing to industry newsletters, following relevant companies and organizations, or regularly checking reputable industry news sources and publications.
Methodology
Step 1 - Identification of Relevant Samples Size from Population Database


Step 2 - Approaches for Defining Global Market Size (Value, Volume* & Price*)

Note*: In applicable scenarios
Step 3 - Data Sources
Primary Research
- Web Analytics
- Survey Reports
- Research Institute
- Latest Research Reports
- Opinion Leaders
Secondary Research
- Annual Reports
- White Paper
- Latest Press Release
- Industry Association
- Paid Database
- Investor Presentations

Step 4 - Data Triangulation
Involves using different sources of information in order to increase the validity of a study
These sources are likely to be stakeholders in a program - participants, other researchers, program staff, other community members, and so on.
Then we put all data in single framework & apply various statistical tools to find out the dynamic on the market.
During the analysis stage, feedback from the stakeholder groups would be compared to determine areas of agreement as well as areas of divergence


