
Key Insights
The global blood collection bags market is experiencing robust growth, driven by the increasing prevalence of chronic diseases requiring frequent blood transfusions, rising surgical procedures, and expanding healthcare infrastructure, particularly in developing economies. A compound annual growth rate (CAGR) of 10.80% from 2019 to 2024 suggests a significant market expansion. This growth is further fueled by technological advancements in bag design, including the introduction of triple blood bags offering improved efficiency and reduced risk of contamination. The market is segmented by product type (single, double, triple, and other), bag type (collection and transfer), and end-user (hospitals and clinics, blood banks, and others). Hospitals and clinics currently dominate the end-user segment, reflecting the high volume of blood transfusions and collection procedures performed in these settings. However, growth is expected across all segments, with the increasing adoption of advanced blood collection and processing techniques in blood banks contributing significantly to market expansion. The Asia-Pacific region, driven by increasing healthcare expenditure and rising awareness of blood safety, is projected to show substantial growth in the coming years. While regulatory hurdles and pricing pressures may pose some challenges, the overall market outlook remains positive, driven by the consistent demand for safe and efficient blood collection solutions.
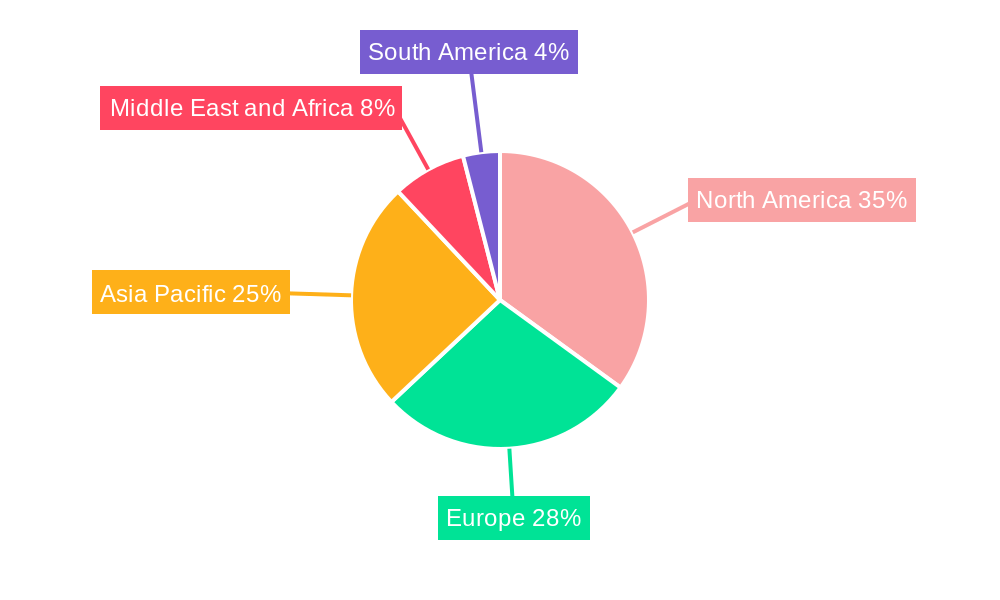
The competitive landscape is characterized by a mix of established multinational corporations and regional players. Key players like Terumo Corporation, Fresenius SE & Co. KGaA, and Haemonetics Corporation hold significant market share, leveraging their established distribution networks and technological expertise. However, smaller companies are also gaining traction, particularly those specializing in innovative product designs and catering to specific niche markets. The market is likely to witness further consolidation through strategic partnerships, mergers, and acquisitions, as companies strive to enhance their product portfolios and expand their geographical reach. The North American market, currently a dominant force, is expected to maintain its significant share due to the well-established healthcare infrastructure and advanced medical practices. However, emerging markets in Asia-Pacific and other developing regions present significant opportunities for growth, promising further market expansion and diversification in the coming years.
Blood Collection Bags Industry Market Report: 2019-2033
This comprehensive report provides an in-depth analysis of the global Blood Collection Bags industry, offering valuable insights for stakeholders, investors, and industry professionals. Covering the period from 2019 to 2033, with a focus on 2025, this report meticulously examines market dynamics, competitive landscapes, and future growth projections. The report's robust methodology leverages extensive primary and secondary research, ensuring accurate and reliable data. The USD xx Million market is segmented by product, type, and end-user, providing a granular understanding of this critical healthcare sector.
Blood Collection Bags Industry Market Structure & Competitive Dynamics
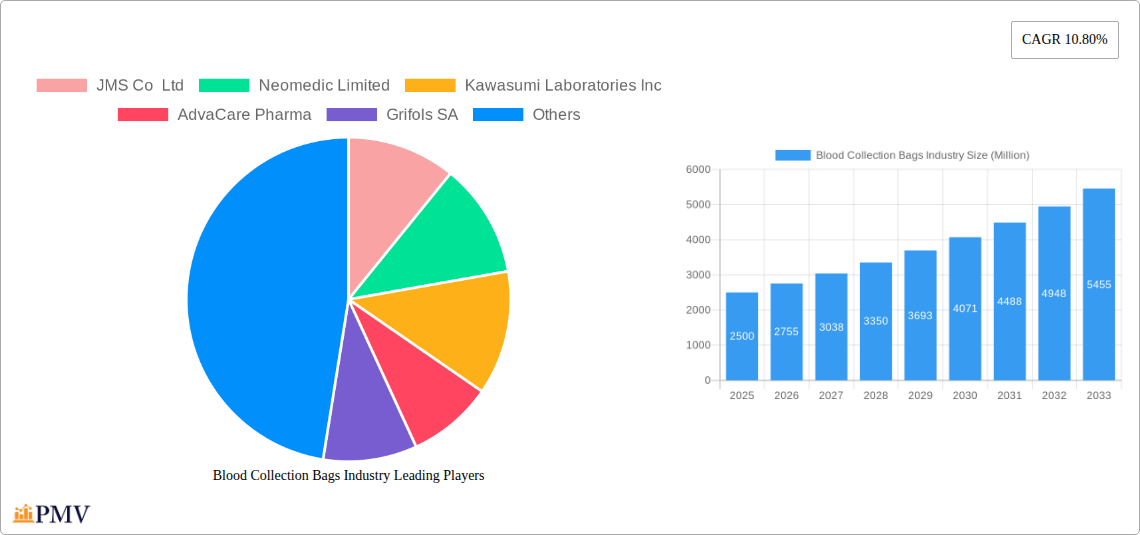
The global blood collection bags market is moderately consolidated, with several key players holding significant market share. The competitive landscape is characterized by both intense competition and strategic collaborations. Market share data for 2024 reveals that the top 5 players – Grifols SA, Terumo Corporation, Haemonetics Corporation, Fresenius SE & Co KGaA, and JMS Co Ltd – collectively account for approximately xx% of the global market. Innovation plays a pivotal role, with companies continuously investing in research and development to improve product features, such as enhanced anticoagulant properties and improved safety features. Regulatory frameworks, particularly those related to blood safety and quality, significantly impact market dynamics. The presence of substitute products, including alternative blood preservation methods, poses a challenge to market growth. End-user trends, particularly the increasing demand for advanced blood collection techniques in hospitals and blood banks, are driving market expansion. M&A activities have been relatively moderate in recent years, with deal values typically ranging from USD xx Million to USD xx Million. Key recent M&A activities include [Insert details of any significant M&A activities within the study period, if available. Otherwise, state "No significant M&A activities were recorded within the study period"].
- Market Concentration: Moderately consolidated, top 5 players hold xx% market share (2024).
- Innovation Ecosystem: High R&D investment focused on improved anticoagulants and safety.
- Regulatory Frameworks: Stringent regulations governing blood safety and quality.
- Product Substitutes: Alternative blood preservation methods pose a competitive threat.
- End-User Trends: Increasing demand from hospitals and blood banks drives growth.
- M&A Activity: Moderate activity, with deal values ranging from USD xx Million to USD xx Million.
Blood Collection Bags Industry Industry Trends & Insights
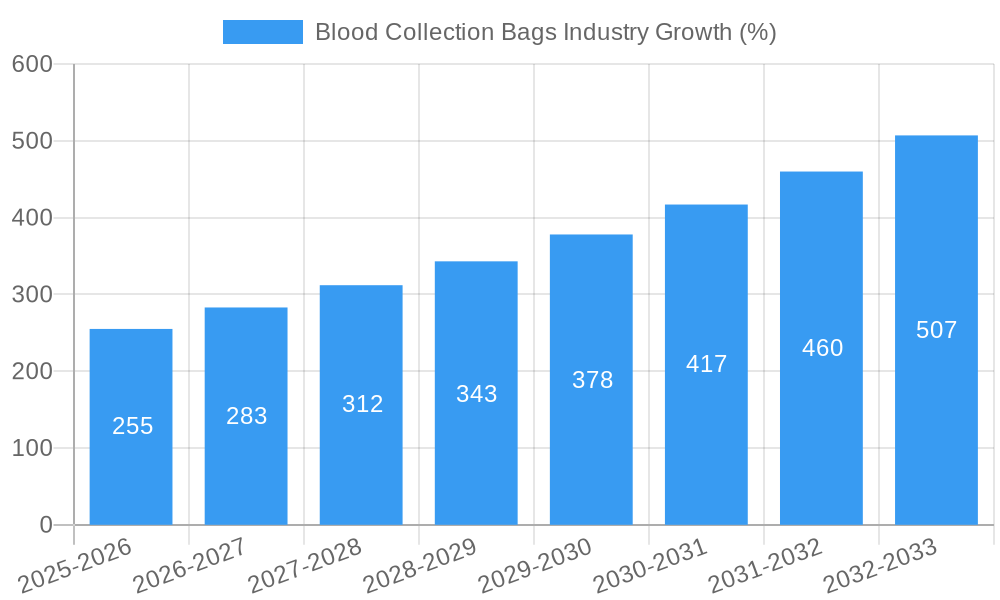
The blood collection bags market exhibits a steady growth trajectory, driven by several key factors. The global market is projected to reach USD xx Million by 2033, expanding at a CAGR of xx% during the forecast period (2025-2033). This growth is primarily fueled by the rising prevalence of chronic diseases requiring frequent blood transfusions, increasing surgical procedures, and the growing demand for blood products in developing economies. Technological advancements, such as the development of automated blood collection systems and improved bag designs with enhanced safety features, are further bolstering market expansion. Consumer preferences are shifting towards safer, more efficient, and user-friendly blood collection bags. However, factors such as stringent regulatory approvals and price sensitivity in certain markets could potentially hinder market growth. The market penetration rate of advanced blood collection bags is steadily increasing, projected to reach xx% by 2033. Competitive dynamics remain robust, with key players focusing on product innovation, strategic partnerships, and geographic expansion to maintain market share.
Dominant Markets & Segments in Blood Collection Bags Industry
The North American region currently holds the largest market share in the blood collection bags industry, driven by factors such as high healthcare expenditure, advanced healthcare infrastructure, and a robust regulatory framework. Within the product segment, single blood bags dominate the market due to their widespread use in routine blood collection procedures. Hospitals and clinics are the largest end-users, owing to the high volume of blood collection procedures performed in these settings.
Key Drivers for North American Dominance:
- High healthcare expenditure.
- Advanced healthcare infrastructure.
- Strong regulatory framework supporting innovation and adoption.
Segment Dominance Analysis:
- By Product: Single blood bags dominate due to widespread usage.
- By Type: Collection bags represent the larger segment.
- By End-User: Hospitals and clinics constitute the largest end-user segment.
Blood Collection Bags Industry Product Innovations
Recent product innovations in the blood collection bags market focus on improving safety, efficiency, and ease of use. New designs incorporate features such as improved leak-proof seals, integrated anticoagulant systems, and enhanced labeling for improved traceability. Technological advancements like the incorporation of sensors for real-time monitoring of blood quality are gaining traction. These innovations cater to the growing demand for improved safety and efficiency in blood collection processes, aligning with the overall trends in the healthcare sector.
Report Segmentation & Scope
This report segments the blood collection bags market comprehensively across various parameters.
- By Product: Single Blood Bag, Double Blood Bag, Triple Blood Bag, Other Products (with growth projections and market size estimations for each).
- By Type: Collection Bag, Transfer Bag (with growth projections and market size estimations for each).
- By End User: Hospitals and Clinics, Blood Banks, Other End Users (with growth projections and market size estimations for each).
Each segment is analyzed in detail, examining competitive dynamics, market size, and growth projections, offering a 360° view of the market.
Key Drivers of Blood Collection Bags Industry Growth
Several key factors are driving the growth of the blood collection bags market. These include:
- Technological advancements: Development of automated systems and improved bag designs.
- Rising prevalence of chronic diseases: Increased need for blood transfusions.
- Growing demand in emerging economies: Expansion into new markets.
- Stringent regulatory frameworks: Driving adoption of safer and more efficient products.
Challenges in the Blood Collection Bags Industry Sector
The blood collection bags industry faces several challenges. These include:
- Stringent regulatory hurdles: Time-consuming and costly approval processes.
- Supply chain disruptions: Fluctuations in raw material prices and availability.
- Intense competition: Pressure to innovate and offer competitive pricing.
Leading Players in the Blood Collection Bags Industry Market
- JMS Co Ltd
- Neomedic Limited
- Kawasumi Laboratories Inc
- AdvaCare Pharma
- Grifols SA
- Terumo Corporation
- Demophorius Healthcare Ltd
- Haemonetics Corporation
- Qingdao Sinoland International Trade Co
- Fresenius SE & Co KGaA
- Troge Medical GmbH
- HLL Lifecare Limited
- Poly Medicure Ltd
- Teleflex Incorporated
- Maco Pharma International GmbH
Key Developments in Blood Collection Bags Industry Sector
- April 2022: Terumo Blood and Cell Technologies received a USD 10.6 Million contract from MTEC for freeze-dried plasma (FDP) research, signifying increased investment in blood product innovation.
- April 2022: Inauguration of a new blood bank center in Imphal East, India, expanding access to blood transfusion services and potentially increasing demand for blood collection bags.
Strategic Blood Collection Bags Industry Market Outlook
The blood collection bags market presents significant growth potential driven by ongoing technological advancements, increasing healthcare expenditure, and expanding global healthcare infrastructure. Strategic opportunities lie in focusing on innovation, particularly in areas such as automated blood collection systems and improved bag designs. Expansion into emerging markets with significant unmet needs presents a further avenue for growth. Companies that effectively navigate regulatory hurdles and establish strong supply chains will be best positioned to capitalize on the future market opportunities.
Blood Collection Bags Industry Segmentation
-
1. Product
- 1.1. Single Blood Bag
- 1.2. Double Blood Bag
- 1.3. Triple Blood Bag
- 1.4. Other Products
-
2. Type
- 2.1. Collection Bag
- 2.2. Transfer Bag
-
3. End User
- 3.1. Hospitals and Clinics
- 3.2. Blood Banks
- 3.3. Other End Users
Blood Collection Bags Industry Segmentation By Geography
-
1. North America
- 1.1. United States
- 1.2. Canada
- 1.3. Mexico
-
2. Europe
- 2.1. Germany
- 2.2. United Kingdom
- 2.3. France
- 2.4. Italy
- 2.5. Spain
- 2.6. Rest of Europe
-
3. Asia Pacific
- 3.1. China
- 3.2. Japan
- 3.3. India
- 3.4. Australia
- 3.5. South Korea
- 3.6. Rest of Asia Pacific
-
4. Middle East and Africa
- 4.1. GCC
- 4.2. South Africa
- 4.3. Rest of Middle East and Africa
-
5. South America
- 5.1. Brazil
- 5.2. Argentina
- 5.3. Rest of South America
Blood Collection Bags Industry REPORT HIGHLIGHTS
| Aspects | Details |
|---|---|
| Study Period | 2019-2033 |
| Base Year | 2024 |
| Estimated Year | 2025 |
| Forecast Period | 2025-2033 |
| Historical Period | 2019-2024 |
| Growth Rate | CAGR of 10.80% from 2019-2033 |
| Segmentation |
|
Table of Contents
- 1. Introduction
- 1.1. Research Scope
- 1.2. Market Segmentation
- 1.3. Research Methodology
- 1.4. Definitions and Assumptions
- 2. Executive Summary
- 2.1. Introduction
- 3. Market Dynamics
- 3.1. Introduction
- 3.2. Market Drivers
- 3.2.1. Growing Incidences of Blood-related Disorders; Increasing Number of Trauma and Road Accidents; Growing Awareness About Blood Donation Among Citizens
- 3.3. Market Restrains
- 3.3.1. Hazardous Waste Created by the Excessive Usage of Blood Bags
- 3.4. Market Trends
- 3.4.1. Hospitals and Clinics Based Segment is Expected to Witness Growth Over the Forecast Period
- 4. Market Factor Analysis
- 4.1. Porters Five Forces
- 4.2. Supply/Value Chain
- 4.3. PESTEL analysis
- 4.4. Market Entropy
- 4.5. Patent/Trademark Analysis
- 5. Global Blood Collection Bags Industry Analysis, Insights and Forecast, 2019-2031
- 5.1. Market Analysis, Insights and Forecast - by Product
- 5.1.1. Single Blood Bag
- 5.1.2. Double Blood Bag
- 5.1.3. Triple Blood Bag
- 5.1.4. Other Products
- 5.2. Market Analysis, Insights and Forecast - by Type
- 5.2.1. Collection Bag
- 5.2.2. Transfer Bag
- 5.3. Market Analysis, Insights and Forecast - by End User
- 5.3.1. Hospitals and Clinics
- 5.3.2. Blood Banks
- 5.3.3. Other End Users
- 5.4. Market Analysis, Insights and Forecast - by Region
- 5.4.1. North America
- 5.4.2. Europe
- 5.4.3. Asia Pacific
- 5.4.4. Middle East and Africa
- 5.4.5. South America
- 5.1. Market Analysis, Insights and Forecast - by Product
- 6. North America Blood Collection Bags Industry Analysis, Insights and Forecast, 2019-2031
- 6.1. Market Analysis, Insights and Forecast - by Product
- 6.1.1. Single Blood Bag
- 6.1.2. Double Blood Bag
- 6.1.3. Triple Blood Bag
- 6.1.4. Other Products
- 6.2. Market Analysis, Insights and Forecast - by Type
- 6.2.1. Collection Bag
- 6.2.2. Transfer Bag
- 6.3. Market Analysis, Insights and Forecast - by End User
- 6.3.1. Hospitals and Clinics
- 6.3.2. Blood Banks
- 6.3.3. Other End Users
- 6.1. Market Analysis, Insights and Forecast - by Product
- 7. Europe Blood Collection Bags Industry Analysis, Insights and Forecast, 2019-2031
- 7.1. Market Analysis, Insights and Forecast - by Product
- 7.1.1. Single Blood Bag
- 7.1.2. Double Blood Bag
- 7.1.3. Triple Blood Bag
- 7.1.4. Other Products
- 7.2. Market Analysis, Insights and Forecast - by Type
- 7.2.1. Collection Bag
- 7.2.2. Transfer Bag
- 7.3. Market Analysis, Insights and Forecast - by End User
- 7.3.1. Hospitals and Clinics
- 7.3.2. Blood Banks
- 7.3.3. Other End Users
- 7.1. Market Analysis, Insights and Forecast - by Product
- 8. Asia Pacific Blood Collection Bags Industry Analysis, Insights and Forecast, 2019-2031
- 8.1. Market Analysis, Insights and Forecast - by Product
- 8.1.1. Single Blood Bag
- 8.1.2. Double Blood Bag
- 8.1.3. Triple Blood Bag
- 8.1.4. Other Products
- 8.2. Market Analysis, Insights and Forecast - by Type
- 8.2.1. Collection Bag
- 8.2.2. Transfer Bag
- 8.3. Market Analysis, Insights and Forecast - by End User
- 8.3.1. Hospitals and Clinics
- 8.3.2. Blood Banks
- 8.3.3. Other End Users
- 8.1. Market Analysis, Insights and Forecast - by Product
- 9. Middle East and Africa Blood Collection Bags Industry Analysis, Insights and Forecast, 2019-2031
- 9.1. Market Analysis, Insights and Forecast - by Product
- 9.1.1. Single Blood Bag
- 9.1.2. Double Blood Bag
- 9.1.3. Triple Blood Bag
- 9.1.4. Other Products
- 9.2. Market Analysis, Insights and Forecast - by Type
- 9.2.1. Collection Bag
- 9.2.2. Transfer Bag
- 9.3. Market Analysis, Insights and Forecast - by End User
- 9.3.1. Hospitals and Clinics
- 9.3.2. Blood Banks
- 9.3.3. Other End Users
- 9.1. Market Analysis, Insights and Forecast - by Product
- 10. South America Blood Collection Bags Industry Analysis, Insights and Forecast, 2019-2031
- 10.1. Market Analysis, Insights and Forecast - by Product
- 10.1.1. Single Blood Bag
- 10.1.2. Double Blood Bag
- 10.1.3. Triple Blood Bag
- 10.1.4. Other Products
- 10.2. Market Analysis, Insights and Forecast - by Type
- 10.2.1. Collection Bag
- 10.2.2. Transfer Bag
- 10.3. Market Analysis, Insights and Forecast - by End User
- 10.3.1. Hospitals and Clinics
- 10.3.2. Blood Banks
- 10.3.3. Other End Users
- 10.1. Market Analysis, Insights and Forecast - by Product
- 11. North America Blood Collection Bags Industry Analysis, Insights and Forecast, 2019-2031
- 11.1. Market Analysis, Insights and Forecast - By Country/Sub-region
- 11.1.1 United States
- 11.1.2 Canada
- 11.1.3 Mexico
- 12. Europe Blood Collection Bags Industry Analysis, Insights and Forecast, 2019-2031
- 12.1. Market Analysis, Insights and Forecast - By Country/Sub-region
- 12.1.1 Germany
- 12.1.2 United Kingdom
- 12.1.3 France
- 12.1.4 Italy
- 12.1.5 Spain
- 12.1.6 Rest of Europe
- 13. Asia Pacific Blood Collection Bags Industry Analysis, Insights and Forecast, 2019-2031
- 13.1. Market Analysis, Insights and Forecast - By Country/Sub-region
- 13.1.1 China
- 13.1.2 Japan
- 13.1.3 India
- 13.1.4 Australia
- 13.1.5 South Korea
- 13.1.6 Rest of Asia Pacific
- 14. Middle East and Africa Blood Collection Bags Industry Analysis, Insights and Forecast, 2019-2031
- 14.1. Market Analysis, Insights and Forecast - By Country/Sub-region
- 14.1.1 GCC
- 14.1.2 South Africa
- 14.1.3 Rest of Middle East and Africa
- 15. South America Blood Collection Bags Industry Analysis, Insights and Forecast, 2019-2031
- 15.1. Market Analysis, Insights and Forecast - By Country/Sub-region
- 15.1.1 Brazil
- 15.1.2 Argentina
- 15.1.3 Rest of South America
- 16. Competitive Analysis
- 16.1. Global Market Share Analysis 2024
- 16.2. Company Profiles
- 16.2.1 JMS Co Ltd
- 16.2.1.1. Overview
- 16.2.1.2. Products
- 16.2.1.3. SWOT Analysis
- 16.2.1.4. Recent Developments
- 16.2.1.5. Financials (Based on Availability)
- 16.2.2 Neomedic Limited
- 16.2.2.1. Overview
- 16.2.2.2. Products
- 16.2.2.3. SWOT Analysis
- 16.2.2.4. Recent Developments
- 16.2.2.5. Financials (Based on Availability)
- 16.2.3 Kawasumi Laboratories Inc
- 16.2.3.1. Overview
- 16.2.3.2. Products
- 16.2.3.3. SWOT Analysis
- 16.2.3.4. Recent Developments
- 16.2.3.5. Financials (Based on Availability)
- 16.2.4 AdvaCare Pharma
- 16.2.4.1. Overview
- 16.2.4.2. Products
- 16.2.4.3. SWOT Analysis
- 16.2.4.4. Recent Developments
- 16.2.4.5. Financials (Based on Availability)
- 16.2.5 Grifols SA
- 16.2.5.1. Overview
- 16.2.5.2. Products
- 16.2.5.3. SWOT Analysis
- 16.2.5.4. Recent Developments
- 16.2.5.5. Financials (Based on Availability)
- 16.2.6 Terumo Corporation
- 16.2.6.1. Overview
- 16.2.6.2. Products
- 16.2.6.3. SWOT Analysis
- 16.2.6.4. Recent Developments
- 16.2.6.5. Financials (Based on Availability)
- 16.2.7 Demophorius Healthcare Ltd
- 16.2.7.1. Overview
- 16.2.7.2. Products
- 16.2.7.3. SWOT Analysis
- 16.2.7.4. Recent Developments
- 16.2.7.5. Financials (Based on Availability)
- 16.2.8 Haemonetics Corporation
- 16.2.8.1. Overview
- 16.2.8.2. Products
- 16.2.8.3. SWOT Analysis
- 16.2.8.4. Recent Developments
- 16.2.8.5. Financials (Based on Availability)
- 16.2.9 Qingdao Sinoland International Trade Co
- 16.2.9.1. Overview
- 16.2.9.2. Products
- 16.2.9.3. SWOT Analysis
- 16.2.9.4. Recent Developments
- 16.2.9.5. Financials (Based on Availability)
- 16.2.10 Fresenius SE & Co KGaA
- 16.2.10.1. Overview
- 16.2.10.2. Products
- 16.2.10.3. SWOT Analysis
- 16.2.10.4. Recent Developments
- 16.2.10.5. Financials (Based on Availability)
- 16.2.11 Troge Medical GmbH
- 16.2.11.1. Overview
- 16.2.11.2. Products
- 16.2.11.3. SWOT Analysis
- 16.2.11.4. Recent Developments
- 16.2.11.5. Financials (Based on Availability)
- 16.2.12 HLL Lifecare Limited
- 16.2.12.1. Overview
- 16.2.12.2. Products
- 16.2.12.3. SWOT Analysis
- 16.2.12.4. Recent Developments
- 16.2.12.5. Financials (Based on Availability)
- 16.2.13 Poly Medicure Ltd
- 16.2.13.1. Overview
- 16.2.13.2. Products
- 16.2.13.3. SWOT Analysis
- 16.2.13.4. Recent Developments
- 16.2.13.5. Financials (Based on Availability)
- 16.2.14 Teleflex Incorporated
- 16.2.14.1. Overview
- 16.2.14.2. Products
- 16.2.14.3. SWOT Analysis
- 16.2.14.4. Recent Developments
- 16.2.14.5. Financials (Based on Availability)
- 16.2.15 Maco Pharma International GmbH
- 16.2.15.1. Overview
- 16.2.15.2. Products
- 16.2.15.3. SWOT Analysis
- 16.2.15.4. Recent Developments
- 16.2.15.5. Financials (Based on Availability)
- 16.2.1 JMS Co Ltd
List of Figures
- Figure 1: Global Blood Collection Bags Industry Revenue Breakdown (Million, %) by Region 2024 & 2032
- Figure 2: Global Blood Collection Bags Industry Volume Breakdown (K Unit, %) by Region 2024 & 2032
- Figure 3: North America Blood Collection Bags Industry Revenue (Million), by Country 2024 & 2032
- Figure 4: North America Blood Collection Bags Industry Volume (K Unit), by Country 2024 & 2032
- Figure 5: North America Blood Collection Bags Industry Revenue Share (%), by Country 2024 & 2032
- Figure 6: North America Blood Collection Bags Industry Volume Share (%), by Country 2024 & 2032
- Figure 7: Europe Blood Collection Bags Industry Revenue (Million), by Country 2024 & 2032
- Figure 8: Europe Blood Collection Bags Industry Volume (K Unit), by Country 2024 & 2032
- Figure 9: Europe Blood Collection Bags Industry Revenue Share (%), by Country 2024 & 2032
- Figure 10: Europe Blood Collection Bags Industry Volume Share (%), by Country 2024 & 2032
- Figure 11: Asia Pacific Blood Collection Bags Industry Revenue (Million), by Country 2024 & 2032
- Figure 12: Asia Pacific Blood Collection Bags Industry Volume (K Unit), by Country 2024 & 2032
- Figure 13: Asia Pacific Blood Collection Bags Industry Revenue Share (%), by Country 2024 & 2032
- Figure 14: Asia Pacific Blood Collection Bags Industry Volume Share (%), by Country 2024 & 2032
- Figure 15: Middle East and Africa Blood Collection Bags Industry Revenue (Million), by Country 2024 & 2032
- Figure 16: Middle East and Africa Blood Collection Bags Industry Volume (K Unit), by Country 2024 & 2032
- Figure 17: Middle East and Africa Blood Collection Bags Industry Revenue Share (%), by Country 2024 & 2032
- Figure 18: Middle East and Africa Blood Collection Bags Industry Volume Share (%), by Country 2024 & 2032
- Figure 19: South America Blood Collection Bags Industry Revenue (Million), by Country 2024 & 2032
- Figure 20: South America Blood Collection Bags Industry Volume (K Unit), by Country 2024 & 2032
- Figure 21: South America Blood Collection Bags Industry Revenue Share (%), by Country 2024 & 2032
- Figure 22: South America Blood Collection Bags Industry Volume Share (%), by Country 2024 & 2032
- Figure 23: North America Blood Collection Bags Industry Revenue (Million), by Product 2024 & 2032
- Figure 24: North America Blood Collection Bags Industry Volume (K Unit), by Product 2024 & 2032
- Figure 25: North America Blood Collection Bags Industry Revenue Share (%), by Product 2024 & 2032
- Figure 26: North America Blood Collection Bags Industry Volume Share (%), by Product 2024 & 2032
- Figure 27: North America Blood Collection Bags Industry Revenue (Million), by Type 2024 & 2032
- Figure 28: North America Blood Collection Bags Industry Volume (K Unit), by Type 2024 & 2032
- Figure 29: North America Blood Collection Bags Industry Revenue Share (%), by Type 2024 & 2032
- Figure 30: North America Blood Collection Bags Industry Volume Share (%), by Type 2024 & 2032
- Figure 31: North America Blood Collection Bags Industry Revenue (Million), by End User 2024 & 2032
- Figure 32: North America Blood Collection Bags Industry Volume (K Unit), by End User 2024 & 2032
- Figure 33: North America Blood Collection Bags Industry Revenue Share (%), by End User 2024 & 2032
- Figure 34: North America Blood Collection Bags Industry Volume Share (%), by End User 2024 & 2032
- Figure 35: North America Blood Collection Bags Industry Revenue (Million), by Country 2024 & 2032
- Figure 36: North America Blood Collection Bags Industry Volume (K Unit), by Country 2024 & 2032
- Figure 37: North America Blood Collection Bags Industry Revenue Share (%), by Country 2024 & 2032
- Figure 38: North America Blood Collection Bags Industry Volume Share (%), by Country 2024 & 2032
- Figure 39: Europe Blood Collection Bags Industry Revenue (Million), by Product 2024 & 2032
- Figure 40: Europe Blood Collection Bags Industry Volume (K Unit), by Product 2024 & 2032
- Figure 41: Europe Blood Collection Bags Industry Revenue Share (%), by Product 2024 & 2032
- Figure 42: Europe Blood Collection Bags Industry Volume Share (%), by Product 2024 & 2032
- Figure 43: Europe Blood Collection Bags Industry Revenue (Million), by Type 2024 & 2032
- Figure 44: Europe Blood Collection Bags Industry Volume (K Unit), by Type 2024 & 2032
- Figure 45: Europe Blood Collection Bags Industry Revenue Share (%), by Type 2024 & 2032
- Figure 46: Europe Blood Collection Bags Industry Volume Share (%), by Type 2024 & 2032
- Figure 47: Europe Blood Collection Bags Industry Revenue (Million), by End User 2024 & 2032
- Figure 48: Europe Blood Collection Bags Industry Volume (K Unit), by End User 2024 & 2032
- Figure 49: Europe Blood Collection Bags Industry Revenue Share (%), by End User 2024 & 2032
- Figure 50: Europe Blood Collection Bags Industry Volume Share (%), by End User 2024 & 2032
- Figure 51: Europe Blood Collection Bags Industry Revenue (Million), by Country 2024 & 2032
- Figure 52: Europe Blood Collection Bags Industry Volume (K Unit), by Country 2024 & 2032
- Figure 53: Europe Blood Collection Bags Industry Revenue Share (%), by Country 2024 & 2032
- Figure 54: Europe Blood Collection Bags Industry Volume Share (%), by Country 2024 & 2032
- Figure 55: Asia Pacific Blood Collection Bags Industry Revenue (Million), by Product 2024 & 2032
- Figure 56: Asia Pacific Blood Collection Bags Industry Volume (K Unit), by Product 2024 & 2032
- Figure 57: Asia Pacific Blood Collection Bags Industry Revenue Share (%), by Product 2024 & 2032
- Figure 58: Asia Pacific Blood Collection Bags Industry Volume Share (%), by Product 2024 & 2032
- Figure 59: Asia Pacific Blood Collection Bags Industry Revenue (Million), by Type 2024 & 2032
- Figure 60: Asia Pacific Blood Collection Bags Industry Volume (K Unit), by Type 2024 & 2032
- Figure 61: Asia Pacific Blood Collection Bags Industry Revenue Share (%), by Type 2024 & 2032
- Figure 62: Asia Pacific Blood Collection Bags Industry Volume Share (%), by Type 2024 & 2032
- Figure 63: Asia Pacific Blood Collection Bags Industry Revenue (Million), by End User 2024 & 2032
- Figure 64: Asia Pacific Blood Collection Bags Industry Volume (K Unit), by End User 2024 & 2032
- Figure 65: Asia Pacific Blood Collection Bags Industry Revenue Share (%), by End User 2024 & 2032
- Figure 66: Asia Pacific Blood Collection Bags Industry Volume Share (%), by End User 2024 & 2032
- Figure 67: Asia Pacific Blood Collection Bags Industry Revenue (Million), by Country 2024 & 2032
- Figure 68: Asia Pacific Blood Collection Bags Industry Volume (K Unit), by Country 2024 & 2032
- Figure 69: Asia Pacific Blood Collection Bags Industry Revenue Share (%), by Country 2024 & 2032
- Figure 70: Asia Pacific Blood Collection Bags Industry Volume Share (%), by Country 2024 & 2032
- Figure 71: Middle East and Africa Blood Collection Bags Industry Revenue (Million), by Product 2024 & 2032
- Figure 72: Middle East and Africa Blood Collection Bags Industry Volume (K Unit), by Product 2024 & 2032
- Figure 73: Middle East and Africa Blood Collection Bags Industry Revenue Share (%), by Product 2024 & 2032
- Figure 74: Middle East and Africa Blood Collection Bags Industry Volume Share (%), by Product 2024 & 2032
- Figure 75: Middle East and Africa Blood Collection Bags Industry Revenue (Million), by Type 2024 & 2032
- Figure 76: Middle East and Africa Blood Collection Bags Industry Volume (K Unit), by Type 2024 & 2032
- Figure 77: Middle East and Africa Blood Collection Bags Industry Revenue Share (%), by Type 2024 & 2032
- Figure 78: Middle East and Africa Blood Collection Bags Industry Volume Share (%), by Type 2024 & 2032
- Figure 79: Middle East and Africa Blood Collection Bags Industry Revenue (Million), by End User 2024 & 2032
- Figure 80: Middle East and Africa Blood Collection Bags Industry Volume (K Unit), by End User 2024 & 2032
- Figure 81: Middle East and Africa Blood Collection Bags Industry Revenue Share (%), by End User 2024 & 2032
- Figure 82: Middle East and Africa Blood Collection Bags Industry Volume Share (%), by End User 2024 & 2032
- Figure 83: Middle East and Africa Blood Collection Bags Industry Revenue (Million), by Country 2024 & 2032
- Figure 84: Middle East and Africa Blood Collection Bags Industry Volume (K Unit), by Country 2024 & 2032
- Figure 85: Middle East and Africa Blood Collection Bags Industry Revenue Share (%), by Country 2024 & 2032
- Figure 86: Middle East and Africa Blood Collection Bags Industry Volume Share (%), by Country 2024 & 2032
- Figure 87: South America Blood Collection Bags Industry Revenue (Million), by Product 2024 & 2032
- Figure 88: South America Blood Collection Bags Industry Volume (K Unit), by Product 2024 & 2032
- Figure 89: South America Blood Collection Bags Industry Revenue Share (%), by Product 2024 & 2032
- Figure 90: South America Blood Collection Bags Industry Volume Share (%), by Product 2024 & 2032
- Figure 91: South America Blood Collection Bags Industry Revenue (Million), by Type 2024 & 2032
- Figure 92: South America Blood Collection Bags Industry Volume (K Unit), by Type 2024 & 2032
- Figure 93: South America Blood Collection Bags Industry Revenue Share (%), by Type 2024 & 2032
- Figure 94: South America Blood Collection Bags Industry Volume Share (%), by Type 2024 & 2032
- Figure 95: South America Blood Collection Bags Industry Revenue (Million), by End User 2024 & 2032
- Figure 96: South America Blood Collection Bags Industry Volume (K Unit), by End User 2024 & 2032
- Figure 97: South America Blood Collection Bags Industry Revenue Share (%), by End User 2024 & 2032
- Figure 98: South America Blood Collection Bags Industry Volume Share (%), by End User 2024 & 2032
- Figure 99: South America Blood Collection Bags Industry Revenue (Million), by Country 2024 & 2032
- Figure 100: South America Blood Collection Bags Industry Volume (K Unit), by Country 2024 & 2032
- Figure 101: South America Blood Collection Bags Industry Revenue Share (%), by Country 2024 & 2032
- Figure 102: South America Blood Collection Bags Industry Volume Share (%), by Country 2024 & 2032
List of Tables
- Table 1: Global Blood Collection Bags Industry Revenue Million Forecast, by Region 2019 & 2032
- Table 2: Global Blood Collection Bags Industry Volume K Unit Forecast, by Region 2019 & 2032
- Table 3: Global Blood Collection Bags Industry Revenue Million Forecast, by Product 2019 & 2032
- Table 4: Global Blood Collection Bags Industry Volume K Unit Forecast, by Product 2019 & 2032
- Table 5: Global Blood Collection Bags Industry Revenue Million Forecast, by Type 2019 & 2032
- Table 6: Global Blood Collection Bags Industry Volume K Unit Forecast, by Type 2019 & 2032
- Table 7: Global Blood Collection Bags Industry Revenue Million Forecast, by End User 2019 & 2032
- Table 8: Global Blood Collection Bags Industry Volume K Unit Forecast, by End User 2019 & 2032
- Table 9: Global Blood Collection Bags Industry Revenue Million Forecast, by Region 2019 & 2032
- Table 10: Global Blood Collection Bags Industry Volume K Unit Forecast, by Region 2019 & 2032
- Table 11: Global Blood Collection Bags Industry Revenue Million Forecast, by Country 2019 & 2032
- Table 12: Global Blood Collection Bags Industry Volume K Unit Forecast, by Country 2019 & 2032
- Table 13: United States Blood Collection Bags Industry Revenue (Million) Forecast, by Application 2019 & 2032
- Table 14: United States Blood Collection Bags Industry Volume (K Unit) Forecast, by Application 2019 & 2032
- Table 15: Canada Blood Collection Bags Industry Revenue (Million) Forecast, by Application 2019 & 2032
- Table 16: Canada Blood Collection Bags Industry Volume (K Unit) Forecast, by Application 2019 & 2032
- Table 17: Mexico Blood Collection Bags Industry Revenue (Million) Forecast, by Application 2019 & 2032
- Table 18: Mexico Blood Collection Bags Industry Volume (K Unit) Forecast, by Application 2019 & 2032
- Table 19: Global Blood Collection Bags Industry Revenue Million Forecast, by Country 2019 & 2032
- Table 20: Global Blood Collection Bags Industry Volume K Unit Forecast, by Country 2019 & 2032
- Table 21: Germany Blood Collection Bags Industry Revenue (Million) Forecast, by Application 2019 & 2032
- Table 22: Germany Blood Collection Bags Industry Volume (K Unit) Forecast, by Application 2019 & 2032
- Table 23: United Kingdom Blood Collection Bags Industry Revenue (Million) Forecast, by Application 2019 & 2032
- Table 24: United Kingdom Blood Collection Bags Industry Volume (K Unit) Forecast, by Application 2019 & 2032
- Table 25: France Blood Collection Bags Industry Revenue (Million) Forecast, by Application 2019 & 2032
- Table 26: France Blood Collection Bags Industry Volume (K Unit) Forecast, by Application 2019 & 2032
- Table 27: Italy Blood Collection Bags Industry Revenue (Million) Forecast, by Application 2019 & 2032
- Table 28: Italy Blood Collection Bags Industry Volume (K Unit) Forecast, by Application 2019 & 2032
- Table 29: Spain Blood Collection Bags Industry Revenue (Million) Forecast, by Application 2019 & 2032
- Table 30: Spain Blood Collection Bags Industry Volume (K Unit) Forecast, by Application 2019 & 2032
- Table 31: Rest of Europe Blood Collection Bags Industry Revenue (Million) Forecast, by Application 2019 & 2032
- Table 32: Rest of Europe Blood Collection Bags Industry Volume (K Unit) Forecast, by Application 2019 & 2032
- Table 33: Global Blood Collection Bags Industry Revenue Million Forecast, by Country 2019 & 2032
- Table 34: Global Blood Collection Bags Industry Volume K Unit Forecast, by Country 2019 & 2032
- Table 35: China Blood Collection Bags Industry Revenue (Million) Forecast, by Application 2019 & 2032
- Table 36: China Blood Collection Bags Industry Volume (K Unit) Forecast, by Application 2019 & 2032
- Table 37: Japan Blood Collection Bags Industry Revenue (Million) Forecast, by Application 2019 & 2032
- Table 38: Japan Blood Collection Bags Industry Volume (K Unit) Forecast, by Application 2019 & 2032
- Table 39: India Blood Collection Bags Industry Revenue (Million) Forecast, by Application 2019 & 2032
- Table 40: India Blood Collection Bags Industry Volume (K Unit) Forecast, by Application 2019 & 2032
- Table 41: Australia Blood Collection Bags Industry Revenue (Million) Forecast, by Application 2019 & 2032
- Table 42: Australia Blood Collection Bags Industry Volume (K Unit) Forecast, by Application 2019 & 2032
- Table 43: South Korea Blood Collection Bags Industry Revenue (Million) Forecast, by Application 2019 & 2032
- Table 44: South Korea Blood Collection Bags Industry Volume (K Unit) Forecast, by Application 2019 & 2032
- Table 45: Rest of Asia Pacific Blood Collection Bags Industry Revenue (Million) Forecast, by Application 2019 & 2032
- Table 46: Rest of Asia Pacific Blood Collection Bags Industry Volume (K Unit) Forecast, by Application 2019 & 2032
- Table 47: Global Blood Collection Bags Industry Revenue Million Forecast, by Country 2019 & 2032
- Table 48: Global Blood Collection Bags Industry Volume K Unit Forecast, by Country 2019 & 2032
- Table 49: GCC Blood Collection Bags Industry Revenue (Million) Forecast, by Application 2019 & 2032
- Table 50: GCC Blood Collection Bags Industry Volume (K Unit) Forecast, by Application 2019 & 2032
- Table 51: South Africa Blood Collection Bags Industry Revenue (Million) Forecast, by Application 2019 & 2032
- Table 52: South Africa Blood Collection Bags Industry Volume (K Unit) Forecast, by Application 2019 & 2032
- Table 53: Rest of Middle East and Africa Blood Collection Bags Industry Revenue (Million) Forecast, by Application 2019 & 2032
- Table 54: Rest of Middle East and Africa Blood Collection Bags Industry Volume (K Unit) Forecast, by Application 2019 & 2032
- Table 55: Global Blood Collection Bags Industry Revenue Million Forecast, by Country 2019 & 2032
- Table 56: Global Blood Collection Bags Industry Volume K Unit Forecast, by Country 2019 & 2032
- Table 57: Brazil Blood Collection Bags Industry Revenue (Million) Forecast, by Application 2019 & 2032
- Table 58: Brazil Blood Collection Bags Industry Volume (K Unit) Forecast, by Application 2019 & 2032
- Table 59: Argentina Blood Collection Bags Industry Revenue (Million) Forecast, by Application 2019 & 2032
- Table 60: Argentina Blood Collection Bags Industry Volume (K Unit) Forecast, by Application 2019 & 2032
- Table 61: Rest of South America Blood Collection Bags Industry Revenue (Million) Forecast, by Application 2019 & 2032
- Table 62: Rest of South America Blood Collection Bags Industry Volume (K Unit) Forecast, by Application 2019 & 2032
- Table 63: Global Blood Collection Bags Industry Revenue Million Forecast, by Product 2019 & 2032
- Table 64: Global Blood Collection Bags Industry Volume K Unit Forecast, by Product 2019 & 2032
- Table 65: Global Blood Collection Bags Industry Revenue Million Forecast, by Type 2019 & 2032
- Table 66: Global Blood Collection Bags Industry Volume K Unit Forecast, by Type 2019 & 2032
- Table 67: Global Blood Collection Bags Industry Revenue Million Forecast, by End User 2019 & 2032
- Table 68: Global Blood Collection Bags Industry Volume K Unit Forecast, by End User 2019 & 2032
- Table 69: Global Blood Collection Bags Industry Revenue Million Forecast, by Country 2019 & 2032
- Table 70: Global Blood Collection Bags Industry Volume K Unit Forecast, by Country 2019 & 2032
- Table 71: United States Blood Collection Bags Industry Revenue (Million) Forecast, by Application 2019 & 2032
- Table 72: United States Blood Collection Bags Industry Volume (K Unit) Forecast, by Application 2019 & 2032
- Table 73: Canada Blood Collection Bags Industry Revenue (Million) Forecast, by Application 2019 & 2032
- Table 74: Canada Blood Collection Bags Industry Volume (K Unit) Forecast, by Application 2019 & 2032
- Table 75: Mexico Blood Collection Bags Industry Revenue (Million) Forecast, by Application 2019 & 2032
- Table 76: Mexico Blood Collection Bags Industry Volume (K Unit) Forecast, by Application 2019 & 2032
- Table 77: Global Blood Collection Bags Industry Revenue Million Forecast, by Product 2019 & 2032
- Table 78: Global Blood Collection Bags Industry Volume K Unit Forecast, by Product 2019 & 2032
- Table 79: Global Blood Collection Bags Industry Revenue Million Forecast, by Type 2019 & 2032
- Table 80: Global Blood Collection Bags Industry Volume K Unit Forecast, by Type 2019 & 2032
- Table 81: Global Blood Collection Bags Industry Revenue Million Forecast, by End User 2019 & 2032
- Table 82: Global Blood Collection Bags Industry Volume K Unit Forecast, by End User 2019 & 2032
- Table 83: Global Blood Collection Bags Industry Revenue Million Forecast, by Country 2019 & 2032
- Table 84: Global Blood Collection Bags Industry Volume K Unit Forecast, by Country 2019 & 2032
- Table 85: Germany Blood Collection Bags Industry Revenue (Million) Forecast, by Application 2019 & 2032
- Table 86: Germany Blood Collection Bags Industry Volume (K Unit) Forecast, by Application 2019 & 2032
- Table 87: United Kingdom Blood Collection Bags Industry Revenue (Million) Forecast, by Application 2019 & 2032
- Table 88: United Kingdom Blood Collection Bags Industry Volume (K Unit) Forecast, by Application 2019 & 2032
- Table 89: France Blood Collection Bags Industry Revenue (Million) Forecast, by Application 2019 & 2032
- Table 90: France Blood Collection Bags Industry Volume (K Unit) Forecast, by Application 2019 & 2032
- Table 91: Italy Blood Collection Bags Industry Revenue (Million) Forecast, by Application 2019 & 2032
- Table 92: Italy Blood Collection Bags Industry Volume (K Unit) Forecast, by Application 2019 & 2032
- Table 93: Spain Blood Collection Bags Industry Revenue (Million) Forecast, by Application 2019 & 2032
- Table 94: Spain Blood Collection Bags Industry Volume (K Unit) Forecast, by Application 2019 & 2032
- Table 95: Rest of Europe Blood Collection Bags Industry Revenue (Million) Forecast, by Application 2019 & 2032
- Table 96: Rest of Europe Blood Collection Bags Industry Volume (K Unit) Forecast, by Application 2019 & 2032
- Table 97: Global Blood Collection Bags Industry Revenue Million Forecast, by Product 2019 & 2032
- Table 98: Global Blood Collection Bags Industry Volume K Unit Forecast, by Product 2019 & 2032
- Table 99: Global Blood Collection Bags Industry Revenue Million Forecast, by Type 2019 & 2032
- Table 100: Global Blood Collection Bags Industry Volume K Unit Forecast, by Type 2019 & 2032
- Table 101: Global Blood Collection Bags Industry Revenue Million Forecast, by End User 2019 & 2032
- Table 102: Global Blood Collection Bags Industry Volume K Unit Forecast, by End User 2019 & 2032
- Table 103: Global Blood Collection Bags Industry Revenue Million Forecast, by Country 2019 & 2032
- Table 104: Global Blood Collection Bags Industry Volume K Unit Forecast, by Country 2019 & 2032
- Table 105: China Blood Collection Bags Industry Revenue (Million) Forecast, by Application 2019 & 2032
- Table 106: China Blood Collection Bags Industry Volume (K Unit) Forecast, by Application 2019 & 2032
- Table 107: Japan Blood Collection Bags Industry Revenue (Million) Forecast, by Application 2019 & 2032
- Table 108: Japan Blood Collection Bags Industry Volume (K Unit) Forecast, by Application 2019 & 2032
- Table 109: India Blood Collection Bags Industry Revenue (Million) Forecast, by Application 2019 & 2032
- Table 110: India Blood Collection Bags Industry Volume (K Unit) Forecast, by Application 2019 & 2032
- Table 111: Australia Blood Collection Bags Industry Revenue (Million) Forecast, by Application 2019 & 2032
- Table 112: Australia Blood Collection Bags Industry Volume (K Unit) Forecast, by Application 2019 & 2032
- Table 113: South Korea Blood Collection Bags Industry Revenue (Million) Forecast, by Application 2019 & 2032
- Table 114: South Korea Blood Collection Bags Industry Volume (K Unit) Forecast, by Application 2019 & 2032
- Table 115: Rest of Asia Pacific Blood Collection Bags Industry Revenue (Million) Forecast, by Application 2019 & 2032
- Table 116: Rest of Asia Pacific Blood Collection Bags Industry Volume (K Unit) Forecast, by Application 2019 & 2032
- Table 117: Global Blood Collection Bags Industry Revenue Million Forecast, by Product 2019 & 2032
- Table 118: Global Blood Collection Bags Industry Volume K Unit Forecast, by Product 2019 & 2032
- Table 119: Global Blood Collection Bags Industry Revenue Million Forecast, by Type 2019 & 2032
- Table 120: Global Blood Collection Bags Industry Volume K Unit Forecast, by Type 2019 & 2032
- Table 121: Global Blood Collection Bags Industry Revenue Million Forecast, by End User 2019 & 2032
- Table 122: Global Blood Collection Bags Industry Volume K Unit Forecast, by End User 2019 & 2032
- Table 123: Global Blood Collection Bags Industry Revenue Million Forecast, by Country 2019 & 2032
- Table 124: Global Blood Collection Bags Industry Volume K Unit Forecast, by Country 2019 & 2032
- Table 125: GCC Blood Collection Bags Industry Revenue (Million) Forecast, by Application 2019 & 2032
- Table 126: GCC Blood Collection Bags Industry Volume (K Unit) Forecast, by Application 2019 & 2032
- Table 127: South Africa Blood Collection Bags Industry Revenue (Million) Forecast, by Application 2019 & 2032
- Table 128: South Africa Blood Collection Bags Industry Volume (K Unit) Forecast, by Application 2019 & 2032
- Table 129: Rest of Middle East and Africa Blood Collection Bags Industry Revenue (Million) Forecast, by Application 2019 & 2032
- Table 130: Rest of Middle East and Africa Blood Collection Bags Industry Volume (K Unit) Forecast, by Application 2019 & 2032
- Table 131: Global Blood Collection Bags Industry Revenue Million Forecast, by Product 2019 & 2032
- Table 132: Global Blood Collection Bags Industry Volume K Unit Forecast, by Product 2019 & 2032
- Table 133: Global Blood Collection Bags Industry Revenue Million Forecast, by Type 2019 & 2032
- Table 134: Global Blood Collection Bags Industry Volume K Unit Forecast, by Type 2019 & 2032
- Table 135: Global Blood Collection Bags Industry Revenue Million Forecast, by End User 2019 & 2032
- Table 136: Global Blood Collection Bags Industry Volume K Unit Forecast, by End User 2019 & 2032
- Table 137: Global Blood Collection Bags Industry Revenue Million Forecast, by Country 2019 & 2032
- Table 138: Global Blood Collection Bags Industry Volume K Unit Forecast, by Country 2019 & 2032
- Table 139: Brazil Blood Collection Bags Industry Revenue (Million) Forecast, by Application 2019 & 2032
- Table 140: Brazil Blood Collection Bags Industry Volume (K Unit) Forecast, by Application 2019 & 2032
- Table 141: Argentina Blood Collection Bags Industry Revenue (Million) Forecast, by Application 2019 & 2032
- Table 142: Argentina Blood Collection Bags Industry Volume (K Unit) Forecast, by Application 2019 & 2032
- Table 143: Rest of South America Blood Collection Bags Industry Revenue (Million) Forecast, by Application 2019 & 2032
- Table 144: Rest of South America Blood Collection Bags Industry Volume (K Unit) Forecast, by Application 2019 & 2032
Frequently Asked Questions
1. What is the projected Compound Annual Growth Rate (CAGR) of the Blood Collection Bags Industry?
The projected CAGR is approximately 10.80%.
2. Which companies are prominent players in the Blood Collection Bags Industry?
Key companies in the market include JMS Co Ltd, Neomedic Limited, Kawasumi Laboratories Inc, AdvaCare Pharma, Grifols SA, Terumo Corporation, Demophorius Healthcare Ltd, Haemonetics Corporation, Qingdao Sinoland International Trade Co, Fresenius SE & Co KGaA, Troge Medical GmbH, HLL Lifecare Limited, Poly Medicure Ltd, Teleflex Incorporated, Maco Pharma International GmbH.
3. What are the main segments of the Blood Collection Bags Industry?
The market segments include Product, Type, End User.
4. Can you provide details about the market size?
The market size is estimated to be USD XX Million as of 2022.
5. What are some drivers contributing to market growth?
Growing Incidences of Blood-related Disorders; Increasing Number of Trauma and Road Accidents; Growing Awareness About Blood Donation Among Citizens.
6. What are the notable trends driving market growth?
Hospitals and Clinics Based Segment is Expected to Witness Growth Over the Forecast Period.
7. Are there any restraints impacting market growth?
Hazardous Waste Created by the Excessive Usage of Blood Bags.
8. Can you provide examples of recent developments in the market?
In April 2022, Terumo Blood and Cell Technologies received a USD 10.6 million contract to continue its work on freeze-dried plasma (FDP). The contract is with MTEC, the Medical Technology Enterprise Consortium, a 501(c)(3) biomedical technology consortium collaborating under an Other Transaction Agreement (OTA) with the United States. Army Medical Research and Development Command is sponsored by the Defense Health Agency (DHA) and managed by the Naval Medical Research Center (NMRC) to drive healthcare advances on the battlefield.
9. What pricing options are available for accessing the report?
Pricing options include single-user, multi-user, and enterprise licenses priced at USD 4750, USD 5250, and USD 8750 respectively.
10. Is the market size provided in terms of value or volume?
The market size is provided in terms of value, measured in Million and volume, measured in K Unit.
11. Are there any specific market keywords associated with the report?
Yes, the market keyword associated with the report is "Blood Collection Bags Industry," which aids in identifying and referencing the specific market segment covered.
12. How do I determine which pricing option suits my needs best?
The pricing options vary based on user requirements and access needs. Individual users may opt for single-user licenses, while businesses requiring broader access may choose multi-user or enterprise licenses for cost-effective access to the report.
13. Are there any additional resources or data provided in the Blood Collection Bags Industry report?
While the report offers comprehensive insights, it's advisable to review the specific contents or supplementary materials provided to ascertain if additional resources or data are available.
14. How can I stay updated on further developments or reports in the Blood Collection Bags Industry?
To stay informed about further developments, trends, and reports in the Blood Collection Bags Industry, consider subscribing to industry newsletters, following relevant companies and organizations, or regularly checking reputable industry news sources and publications.
Methodology
Step 1 - Identification of Relevant Samples Size from Population Database


Step 2 - Approaches for Defining Global Market Size (Value, Volume* & Price*)

Note*: In applicable scenarios
Step 3 - Data Sources
Primary Research
- Web Analytics
- Survey Reports
- Research Institute
- Latest Research Reports
- Opinion Leaders
Secondary Research
- Annual Reports
- White Paper
- Latest Press Release
- Industry Association
- Paid Database
- Investor Presentations

Step 4 - Data Triangulation
Involves using different sources of information in order to increase the validity of a study
These sources are likely to be stakeholders in a program - participants, other researchers, program staff, other community members, and so on.
Then we put all data in single framework & apply various statistical tools to find out the dynamic on the market.
During the analysis stage, feedback from the stakeholder groups would be compared to determine areas of agreement as well as areas of divergence


