
Key Insights
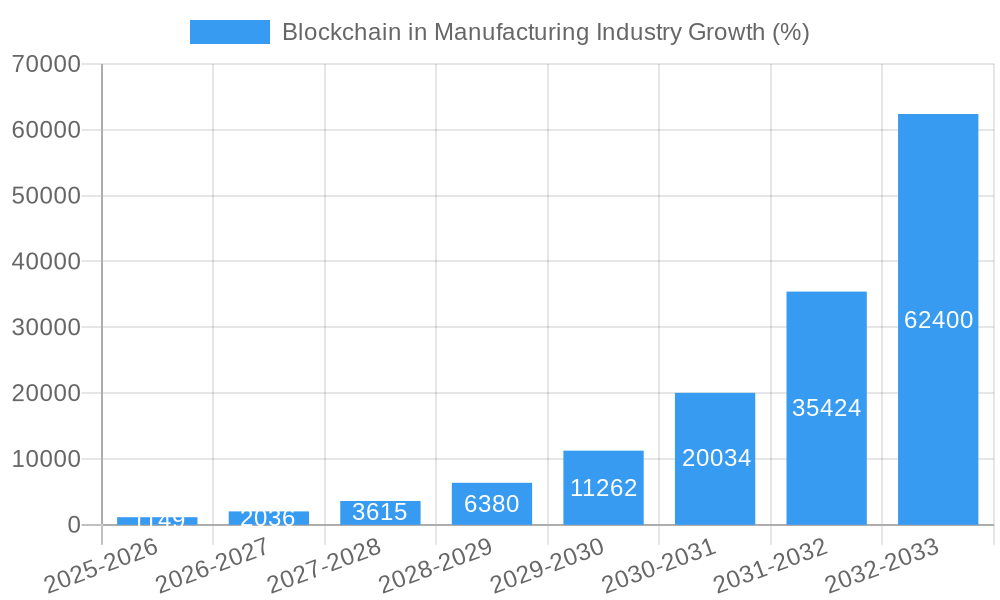
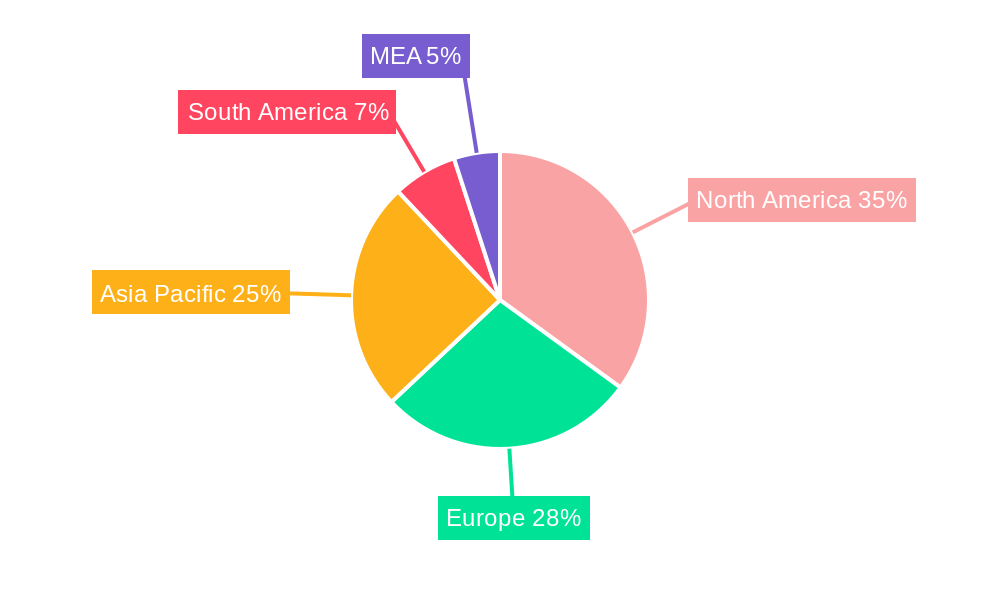
The Blockchain in Manufacturing market is experiencing explosive growth, projected to reach a substantial size by 2033, driven by a remarkable Compound Annual Growth Rate (CAGR) of 76.26% from 2025 to 2033. This surge is fueled by the increasing need for enhanced supply chain transparency, traceability, and security across diverse manufacturing sectors. Key drivers include the rising incidence of counterfeiting, stringent regulatory compliance requirements, and the growing demand for improved quality control. Logistics and supply chain management are currently the leading application segments, followed by counterfeit management and quality control initiatives. The automotive, aerospace & defense, and pharmaceutical industries are early adopters, leveraging blockchain technology to optimize their processes and reduce risks. The global nature of manufacturing necessitates regional analysis. North America, Europe, and Asia Pacific are expected to dominate the market, fueled by significant technological advancements and early adoption by major players. However, the market's expansion isn't without challenges. Integration complexities, scalability issues, and the lack of a standardized blockchain infrastructure represent significant hurdles. Overcoming these obstacles will be crucial for unlocking the full potential of blockchain technology in manufacturing.
The competitive landscape is dynamic, featuring a blend of established technology giants like IBM, Microsoft, and SAP, alongside specialized blockchain solution providers like Factom and emerging players from diverse industries such as Wipro and Accenture who are leveraging their expertise in consulting and IT services to offer blockchain solutions to the manufacturing sector. The market's future hinges on the continued development of user-friendly blockchain platforms, improved interoperability, and the growing acceptance of blockchain technology across various manufacturing verticals. As more companies realize the significant benefits of enhanced security, efficiency, and transparency, the adoption of blockchain solutions within the manufacturing sector is poised for continued and substantial growth, solidifying its position as a transformative technology shaping the future of manufacturing.

Blockchain in Manufacturing Industry: A Comprehensive Market Report (2019-2033)
This in-depth report provides a comprehensive analysis of the Blockchain in Manufacturing Industry market, covering its structure, competitive dynamics, key trends, dominant segments, and future outlook. With a study period spanning 2019-2033, a base year of 2025, and a forecast period of 2025-2033, this report offers invaluable insights for businesses, investors, and stakeholders seeking to understand and capitalize on the transformative potential of blockchain technology within the manufacturing sector. The report projects a market valued at xx Million by 2033, exhibiting a CAGR of xx% during the forecast period.
Blockchain in Manufacturing Industry Market Structure & Competitive Dynamics
The Blockchain in Manufacturing Industry market exhibits a moderately concentrated structure, with several major players vying for market share. Key players include Wipro Limited, Accenture PLC, IBM Corporation, Factom Inc, Microsoft Corporation, Advanced Micro Devices Inc, Amazon Web Services Inc, Oracle Corporation, Infosys Ltd, SAP SE, and Intel Corporation. The market is characterized by intense competition driven by innovation in blockchain solutions tailored to diverse manufacturing needs.
Market share is dynamic, with leading players continuously investing in R&D and strategic acquisitions to expand their footprint. The total value of M&A deals in the sector during the historical period (2019-2024) is estimated at xx Million. Regulatory frameworks are evolving, impacting the adoption and integration of blockchain across various manufacturing segments. The existence of substitute technologies presents challenges, but the unique features of blockchain, such as enhanced security and transparency, maintain its appeal. End-user trends heavily influence market growth, with increasing demand for efficient supply chain management and counterfeit prevention.
Blockchain in Manufacturing Industry Industry Trends & Insights
The Blockchain in Manufacturing Industry market is experiencing robust growth, driven by several factors. The rising need for secure and transparent supply chains is a significant impetus, particularly in industries with complex global networks. Technological advancements, such as the development of more efficient and scalable blockchain platforms, are further fueling market expansion. The increasing adoption of Industry 4.0 technologies and the growing awareness of data security risks are also major contributing factors. Consumer preferences for ethically sourced and traceable products are increasing the demand for blockchain-enabled solutions. Intense competitive dynamics push companies to constantly innovate and develop more effective blockchain applications, thus creating a positive feedback loop for market growth. The market penetration rate for blockchain solutions in manufacturing is expected to reach xx% by 2033.
Dominant Markets & Segments in Blockchain in Manufacturing Industry
The Automotive and Pharmaceutical sectors are currently the dominant end-user verticals for Blockchain in Manufacturing. Logistics and Supply Chain Management is the leading application segment, driven by the need for increased traceability and efficiency in complex global supply chains.
Key Drivers for Dominant Segments:
- Automotive: Stringent quality control requirements, need for supply chain transparency, and rising consumer demand for traceability.
- Pharmaceutical: Strict regulatory compliance needs, emphasis on preventing counterfeit drugs, and the need to track drug provenance.
- Logistics & Supply Chain Management: Improved efficiency, reduced fraud, enhanced traceability, and increased transparency.
Dominance Analysis: The dominance of Automotive and Pharmaceutical segments stems from their stringent regulatory environments and high-value products susceptible to counterfeiting. The Logistics and Supply Chain Management segment benefits from its applicability across diverse manufacturing industries.
Blockchain in Manufacturing Industry Product Innovations
Recent product innovations focus on improving scalability, interoperability, and ease of integration with existing manufacturing systems. New solutions offer enhanced security features, improved data analytics capabilities, and streamlined workflows. The market is witnessing the rise of hybrid blockchain platforms that combine the benefits of public and private networks, catering to diverse security and privacy requirements. These innovations address key industry challenges and provide a better market fit by focusing on user-friendliness and cost-effectiveness.
Report Segmentation & Scope
The report segments the market by Application (Logistics and Supply Chain Management, Counterfeit Management, Quality Control and Compliance, Other Applications) and End-user Vertical (Automotive, Aerospace and Defense, Pharmaceutical, Consumer Electronics, Other End-user Verticals). Each segment's market size, growth projections, and competitive dynamics are thoroughly analyzed. For example, the Logistics and Supply Chain Management segment is expected to exhibit the highest growth rate, driven by the increasing complexity of global supply chains. The Automotive segment is projected to maintain a significant market share due to the industry's stringent requirements for quality control and traceability.
Key Drivers of Blockchain in Manufacturing Industry Growth
The growth of the Blockchain in Manufacturing Industry is driven by several factors including the increasing demand for improved supply chain transparency and traceability, the need for enhanced security and data integrity, the rising adoption of Industry 4.0 technologies, and supportive government regulations. The development of more efficient and scalable blockchain platforms is another significant driver, enabling wider adoption across various manufacturing segments.
Challenges in the Blockchain in Manufacturing Industry Sector
Challenges include the high initial investment costs associated with implementing blockchain solutions, the lack of standardization and interoperability across different platforms, concerns about data privacy and security, and the complexity of integrating blockchain technology into existing legacy systems. Regulatory uncertainty in some regions also poses a hurdle to wider adoption. These challenges represent approximately xx Million in lost revenue potential annually.
Leading Players in the Blockchain in Manufacturing Industry Market
- Wipro Limited
- Accenture PLC
- IBM Corporation
- Factom Inc
- Microsoft Corporation
- Advanced Micro Devices Inc
- Amazon Web Services Inc
- Oracle Corporation
- Infosys Ltd
- SAP SE
- Intel Corporation
Key Developments in Blockchain in Manufacturing Industry Sector
- June 2022: Shell, Accenture, and American Express Global Business Travel launched Avelia, a blockchain-based platform for sustainable aviation fuel (SAF) tracking, demonstrating the potential of blockchain for environmental initiatives and supply chain transparency within the travel industry.
- April 2022: Intel Corporation launched the Intel Blockscale ASIC, a specialized chip boosting blockchain's energy efficiency and scalability, potentially accelerating the adoption of blockchain technologies in various sectors, including manufacturing.
Strategic Blockchain in Manufacturing Industry Market Outlook
The Blockchain in Manufacturing Industry is poised for significant growth, driven by ongoing technological advancements, increasing regulatory support, and the growing need for secure and transparent supply chains. Strategic opportunities exist for companies that can develop innovative blockchain solutions addressing specific industry needs, improve interoperability, and enhance data security and privacy. The market’s future potential is vast, particularly in sectors emphasizing traceability and ethical sourcing.
Blockchain in Manufacturing Industry Segmentation
-
1. Application
- 1.1. Logistics and Supply Chain Management
- 1.2. Counterfeit Management
- 1.3. Quality Control and Compliance
- 1.4. Other Applications
-
2. End-user Vertical
- 2.1. Automotive
- 2.2. Aerospace and Defense
- 2.3. Pharmaceutical
- 2.4. Consumer Electronics
- 2.5. Other End-user Verticals
Blockchain in Manufacturing Industry Segmentation By Geography
- 1. North America
- 2. Europe
- 3. Asia Pacific
- 4. Rest of the World
Blockchain in Manufacturing Industry REPORT HIGHLIGHTS
| Aspects | Details |
|---|---|
| Study Period | 2019-2033 |
| Base Year | 2024 |
| Estimated Year | 2025 |
| Forecast Period | 2025-2033 |
| Historical Period | 2019-2024 |
| Growth Rate | CAGR of 76.26% from 2019-2033 |
| Segmentation |
|
Table of Contents
- 1. Introduction
- 1.1. Research Scope
- 1.2. Market Segmentation
- 1.3. Research Methodology
- 1.4. Definitions and Assumptions
- 2. Executive Summary
- 2.1. Introduction
- 3. Market Dynamics
- 3.1. Introduction
- 3.2. Market Drivers
- 3.2.1. Blockchain-as-a-Service Solutions for Enterprises; Simplifies Business Processes and Reduces Cost of Production
- 3.3. Market Restrains
- 3.3.1. Absence of Common Set of Standards and Regulatory Bodies
- 3.4. Market Trends
- 3.4.1. Automotive Vertical is to Witness the Significant Growth
- 4. Market Factor Analysis
- 4.1. Porters Five Forces
- 4.2. Supply/Value Chain
- 4.3. PESTEL analysis
- 4.4. Market Entropy
- 4.5. Patent/Trademark Analysis
- 5. Global Blockchain in Manufacturing Industry Analysis, Insights and Forecast, 2019-2031
- 5.1. Market Analysis, Insights and Forecast - by Application
- 5.1.1. Logistics and Supply Chain Management
- 5.1.2. Counterfeit Management
- 5.1.3. Quality Control and Compliance
- 5.1.4. Other Applications
- 5.2. Market Analysis, Insights and Forecast - by End-user Vertical
- 5.2.1. Automotive
- 5.2.2. Aerospace and Defense
- 5.2.3. Pharmaceutical
- 5.2.4. Consumer Electronics
- 5.2.5. Other End-user Verticals
- 5.3. Market Analysis, Insights and Forecast - by Region
- 5.3.1. North America
- 5.3.2. Europe
- 5.3.3. Asia Pacific
- 5.3.4. Rest of the World
- 5.1. Market Analysis, Insights and Forecast - by Application
- 6. North America Blockchain in Manufacturing Industry Analysis, Insights and Forecast, 2019-2031
- 6.1. Market Analysis, Insights and Forecast - by Application
- 6.1.1. Logistics and Supply Chain Management
- 6.1.2. Counterfeit Management
- 6.1.3. Quality Control and Compliance
- 6.1.4. Other Applications
- 6.2. Market Analysis, Insights and Forecast - by End-user Vertical
- 6.2.1. Automotive
- 6.2.2. Aerospace and Defense
- 6.2.3. Pharmaceutical
- 6.2.4. Consumer Electronics
- 6.2.5. Other End-user Verticals
- 6.1. Market Analysis, Insights and Forecast - by Application
- 7. Europe Blockchain in Manufacturing Industry Analysis, Insights and Forecast, 2019-2031
- 7.1. Market Analysis, Insights and Forecast - by Application
- 7.1.1. Logistics and Supply Chain Management
- 7.1.2. Counterfeit Management
- 7.1.3. Quality Control and Compliance
- 7.1.4. Other Applications
- 7.2. Market Analysis, Insights and Forecast - by End-user Vertical
- 7.2.1. Automotive
- 7.2.2. Aerospace and Defense
- 7.2.3. Pharmaceutical
- 7.2.4. Consumer Electronics
- 7.2.5. Other End-user Verticals
- 7.1. Market Analysis, Insights and Forecast - by Application
- 8. Asia Pacific Blockchain in Manufacturing Industry Analysis, Insights and Forecast, 2019-2031
- 8.1. Market Analysis, Insights and Forecast - by Application
- 8.1.1. Logistics and Supply Chain Management
- 8.1.2. Counterfeit Management
- 8.1.3. Quality Control and Compliance
- 8.1.4. Other Applications
- 8.2. Market Analysis, Insights and Forecast - by End-user Vertical
- 8.2.1. Automotive
- 8.2.2. Aerospace and Defense
- 8.2.3. Pharmaceutical
- 8.2.4. Consumer Electronics
- 8.2.5. Other End-user Verticals
- 8.1. Market Analysis, Insights and Forecast - by Application
- 9. Rest of the World Blockchain in Manufacturing Industry Analysis, Insights and Forecast, 2019-2031
- 9.1. Market Analysis, Insights and Forecast - by Application
- 9.1.1. Logistics and Supply Chain Management
- 9.1.2. Counterfeit Management
- 9.1.3. Quality Control and Compliance
- 9.1.4. Other Applications
- 9.2. Market Analysis, Insights and Forecast - by End-user Vertical
- 9.2.1. Automotive
- 9.2.2. Aerospace and Defense
- 9.2.3. Pharmaceutical
- 9.2.4. Consumer Electronics
- 9.2.5. Other End-user Verticals
- 9.1. Market Analysis, Insights and Forecast - by Application
- 10. North America Blockchain in Manufacturing Industry Analysis, Insights and Forecast, 2019-2031
- 10.1. Market Analysis, Insights and Forecast - By Country/Sub-region
- 10.1.1 United States
- 10.1.2 Canada
- 10.1.3 Mexico
- 11. Europe Blockchain in Manufacturing Industry Analysis, Insights and Forecast, 2019-2031
- 11.1. Market Analysis, Insights and Forecast - By Country/Sub-region
- 11.1.1 Germany
- 11.1.2 United Kingdom
- 11.1.3 France
- 11.1.4 Spain
- 11.1.5 Italy
- 11.1.6 Spain
- 11.1.7 Belgium
- 11.1.8 Netherland
- 11.1.9 Nordics
- 11.1.10 Rest of Europe
- 12. Asia Pacific Blockchain in Manufacturing Industry Analysis, Insights and Forecast, 2019-2031
- 12.1. Market Analysis, Insights and Forecast - By Country/Sub-region
- 12.1.1 China
- 12.1.2 Japan
- 12.1.3 India
- 12.1.4 South Korea
- 12.1.5 Southeast Asia
- 12.1.6 Australia
- 12.1.7 Indonesia
- 12.1.8 Phillipes
- 12.1.9 Singapore
- 12.1.10 Thailandc
- 12.1.11 Rest of Asia Pacific
- 13. South America Blockchain in Manufacturing Industry Analysis, Insights and Forecast, 2019-2031
- 13.1. Market Analysis, Insights and Forecast - By Country/Sub-region
- 13.1.1 Brazil
- 13.1.2 Argentina
- 13.1.3 Peru
- 13.1.4 Chile
- 13.1.5 Colombia
- 13.1.6 Ecuador
- 13.1.7 Venezuela
- 13.1.8 Rest of South America
- 14. North America Blockchain in Manufacturing Industry Analysis, Insights and Forecast, 2019-2031
- 14.1. Market Analysis, Insights and Forecast - By Country/Sub-region
- 14.1.1 United States
- 14.1.2 Canada
- 14.1.3 Mexico
- 15. MEA Blockchain in Manufacturing Industry Analysis, Insights and Forecast, 2019-2031
- 15.1. Market Analysis, Insights and Forecast - By Country/Sub-region
- 15.1.1 United Arab Emirates
- 15.1.2 Saudi Arabia
- 15.1.3 South Africa
- 15.1.4 Rest of Middle East and Africa
- 16. Competitive Analysis
- 16.1. Global Market Share Analysis 2024
- 16.2. Company Profiles
- 16.2.1 Wipro Limited
- 16.2.1.1. Overview
- 16.2.1.2. Products
- 16.2.1.3. SWOT Analysis
- 16.2.1.4. Recent Developments
- 16.2.1.5. Financials (Based on Availability)
- 16.2.2 Accenture PLC
- 16.2.2.1. Overview
- 16.2.2.2. Products
- 16.2.2.3. SWOT Analysis
- 16.2.2.4. Recent Developments
- 16.2.2.5. Financials (Based on Availability)
- 16.2.3 IBM Corporation
- 16.2.3.1. Overview
- 16.2.3.2. Products
- 16.2.3.3. SWOT Analysis
- 16.2.3.4. Recent Developments
- 16.2.3.5. Financials (Based on Availability)
- 16.2.4 Factom Inc
- 16.2.4.1. Overview
- 16.2.4.2. Products
- 16.2.4.3. SWOT Analysis
- 16.2.4.4. Recent Developments
- 16.2.4.5. Financials (Based on Availability)
- 16.2.5 Microsoft Corporation
- 16.2.5.1. Overview
- 16.2.5.2. Products
- 16.2.5.3. SWOT Analysis
- 16.2.5.4. Recent Developments
- 16.2.5.5. Financials (Based on Availability)
- 16.2.6 Advanced Micro Devices Inc
- 16.2.6.1. Overview
- 16.2.6.2. Products
- 16.2.6.3. SWOT Analysis
- 16.2.6.4. Recent Developments
- 16.2.6.5. Financials (Based on Availability)
- 16.2.7 Amazon Web Services Inc
- 16.2.7.1. Overview
- 16.2.7.2. Products
- 16.2.7.3. SWOT Analysis
- 16.2.7.4. Recent Developments
- 16.2.7.5. Financials (Based on Availability)
- 16.2.8 Oracle Corporation
- 16.2.8.1. Overview
- 16.2.8.2. Products
- 16.2.8.3. SWOT Analysis
- 16.2.8.4. Recent Developments
- 16.2.8.5. Financials (Based on Availability)
- 16.2.9 Infosys Ltd*List Not Exhaustive
- 16.2.9.1. Overview
- 16.2.9.2. Products
- 16.2.9.3. SWOT Analysis
- 16.2.9.4. Recent Developments
- 16.2.9.5. Financials (Based on Availability)
- 16.2.10 SAP SE
- 16.2.10.1. Overview
- 16.2.10.2. Products
- 16.2.10.3. SWOT Analysis
- 16.2.10.4. Recent Developments
- 16.2.10.5. Financials (Based on Availability)
- 16.2.11 Intel Corporation
- 16.2.11.1. Overview
- 16.2.11.2. Products
- 16.2.11.3. SWOT Analysis
- 16.2.11.4. Recent Developments
- 16.2.11.5. Financials (Based on Availability)
- 16.2.1 Wipro Limited
List of Figures
- Figure 1: Global Blockchain in Manufacturing Industry Revenue Breakdown (Million, %) by Region 2024 & 2032
- Figure 2: North America Blockchain in Manufacturing Industry Revenue (Million), by Country 2024 & 2032
- Figure 3: North America Blockchain in Manufacturing Industry Revenue Share (%), by Country 2024 & 2032
- Figure 4: Europe Blockchain in Manufacturing Industry Revenue (Million), by Country 2024 & 2032
- Figure 5: Europe Blockchain in Manufacturing Industry Revenue Share (%), by Country 2024 & 2032
- Figure 6: Asia Pacific Blockchain in Manufacturing Industry Revenue (Million), by Country 2024 & 2032
- Figure 7: Asia Pacific Blockchain in Manufacturing Industry Revenue Share (%), by Country 2024 & 2032
- Figure 8: South America Blockchain in Manufacturing Industry Revenue (Million), by Country 2024 & 2032
- Figure 9: South America Blockchain in Manufacturing Industry Revenue Share (%), by Country 2024 & 2032
- Figure 10: North America Blockchain in Manufacturing Industry Revenue (Million), by Country 2024 & 2032
- Figure 11: North America Blockchain in Manufacturing Industry Revenue Share (%), by Country 2024 & 2032
- Figure 12: MEA Blockchain in Manufacturing Industry Revenue (Million), by Country 2024 & 2032
- Figure 13: MEA Blockchain in Manufacturing Industry Revenue Share (%), by Country 2024 & 2032
- Figure 14: North America Blockchain in Manufacturing Industry Revenue (Million), by Application 2024 & 2032
- Figure 15: North America Blockchain in Manufacturing Industry Revenue Share (%), by Application 2024 & 2032
- Figure 16: North America Blockchain in Manufacturing Industry Revenue (Million), by End-user Vertical 2024 & 2032
- Figure 17: North America Blockchain in Manufacturing Industry Revenue Share (%), by End-user Vertical 2024 & 2032
- Figure 18: North America Blockchain in Manufacturing Industry Revenue (Million), by Country 2024 & 2032
- Figure 19: North America Blockchain in Manufacturing Industry Revenue Share (%), by Country 2024 & 2032
- Figure 20: Europe Blockchain in Manufacturing Industry Revenue (Million), by Application 2024 & 2032
- Figure 21: Europe Blockchain in Manufacturing Industry Revenue Share (%), by Application 2024 & 2032
- Figure 22: Europe Blockchain in Manufacturing Industry Revenue (Million), by End-user Vertical 2024 & 2032
- Figure 23: Europe Blockchain in Manufacturing Industry Revenue Share (%), by End-user Vertical 2024 & 2032
- Figure 24: Europe Blockchain in Manufacturing Industry Revenue (Million), by Country 2024 & 2032
- Figure 25: Europe Blockchain in Manufacturing Industry Revenue Share (%), by Country 2024 & 2032
- Figure 26: Asia Pacific Blockchain in Manufacturing Industry Revenue (Million), by Application 2024 & 2032
- Figure 27: Asia Pacific Blockchain in Manufacturing Industry Revenue Share (%), by Application 2024 & 2032
- Figure 28: Asia Pacific Blockchain in Manufacturing Industry Revenue (Million), by End-user Vertical 2024 & 2032
- Figure 29: Asia Pacific Blockchain in Manufacturing Industry Revenue Share (%), by End-user Vertical 2024 & 2032
- Figure 30: Asia Pacific Blockchain in Manufacturing Industry Revenue (Million), by Country 2024 & 2032
- Figure 31: Asia Pacific Blockchain in Manufacturing Industry Revenue Share (%), by Country 2024 & 2032
- Figure 32: Rest of the World Blockchain in Manufacturing Industry Revenue (Million), by Application 2024 & 2032
- Figure 33: Rest of the World Blockchain in Manufacturing Industry Revenue Share (%), by Application 2024 & 2032
- Figure 34: Rest of the World Blockchain in Manufacturing Industry Revenue (Million), by End-user Vertical 2024 & 2032
- Figure 35: Rest of the World Blockchain in Manufacturing Industry Revenue Share (%), by End-user Vertical 2024 & 2032
- Figure 36: Rest of the World Blockchain in Manufacturing Industry Revenue (Million), by Country 2024 & 2032
- Figure 37: Rest of the World Blockchain in Manufacturing Industry Revenue Share (%), by Country 2024 & 2032
List of Tables
- Table 1: Global Blockchain in Manufacturing Industry Revenue Million Forecast, by Region 2019 & 2032
- Table 2: Global Blockchain in Manufacturing Industry Revenue Million Forecast, by Application 2019 & 2032
- Table 3: Global Blockchain in Manufacturing Industry Revenue Million Forecast, by End-user Vertical 2019 & 2032
- Table 4: Global Blockchain in Manufacturing Industry Revenue Million Forecast, by Region 2019 & 2032
- Table 5: Global Blockchain in Manufacturing Industry Revenue Million Forecast, by Country 2019 & 2032
- Table 6: United States Blockchain in Manufacturing Industry Revenue (Million) Forecast, by Application 2019 & 2032
- Table 7: Canada Blockchain in Manufacturing Industry Revenue (Million) Forecast, by Application 2019 & 2032
- Table 8: Mexico Blockchain in Manufacturing Industry Revenue (Million) Forecast, by Application 2019 & 2032
- Table 9: Global Blockchain in Manufacturing Industry Revenue Million Forecast, by Country 2019 & 2032
- Table 10: Germany Blockchain in Manufacturing Industry Revenue (Million) Forecast, by Application 2019 & 2032
- Table 11: United Kingdom Blockchain in Manufacturing Industry Revenue (Million) Forecast, by Application 2019 & 2032
- Table 12: France Blockchain in Manufacturing Industry Revenue (Million) Forecast, by Application 2019 & 2032
- Table 13: Spain Blockchain in Manufacturing Industry Revenue (Million) Forecast, by Application 2019 & 2032
- Table 14: Italy Blockchain in Manufacturing Industry Revenue (Million) Forecast, by Application 2019 & 2032
- Table 15: Spain Blockchain in Manufacturing Industry Revenue (Million) Forecast, by Application 2019 & 2032
- Table 16: Belgium Blockchain in Manufacturing Industry Revenue (Million) Forecast, by Application 2019 & 2032
- Table 17: Netherland Blockchain in Manufacturing Industry Revenue (Million) Forecast, by Application 2019 & 2032
- Table 18: Nordics Blockchain in Manufacturing Industry Revenue (Million) Forecast, by Application 2019 & 2032
- Table 19: Rest of Europe Blockchain in Manufacturing Industry Revenue (Million) Forecast, by Application 2019 & 2032
- Table 20: Global Blockchain in Manufacturing Industry Revenue Million Forecast, by Country 2019 & 2032
- Table 21: China Blockchain in Manufacturing Industry Revenue (Million) Forecast, by Application 2019 & 2032
- Table 22: Japan Blockchain in Manufacturing Industry Revenue (Million) Forecast, by Application 2019 & 2032
- Table 23: India Blockchain in Manufacturing Industry Revenue (Million) Forecast, by Application 2019 & 2032
- Table 24: South Korea Blockchain in Manufacturing Industry Revenue (Million) Forecast, by Application 2019 & 2032
- Table 25: Southeast Asia Blockchain in Manufacturing Industry Revenue (Million) Forecast, by Application 2019 & 2032
- Table 26: Australia Blockchain in Manufacturing Industry Revenue (Million) Forecast, by Application 2019 & 2032
- Table 27: Indonesia Blockchain in Manufacturing Industry Revenue (Million) Forecast, by Application 2019 & 2032
- Table 28: Phillipes Blockchain in Manufacturing Industry Revenue (Million) Forecast, by Application 2019 & 2032
- Table 29: Singapore Blockchain in Manufacturing Industry Revenue (Million) Forecast, by Application 2019 & 2032
- Table 30: Thailandc Blockchain in Manufacturing Industry Revenue (Million) Forecast, by Application 2019 & 2032
- Table 31: Rest of Asia Pacific Blockchain in Manufacturing Industry Revenue (Million) Forecast, by Application 2019 & 2032
- Table 32: Global Blockchain in Manufacturing Industry Revenue Million Forecast, by Country 2019 & 2032
- Table 33: Brazil Blockchain in Manufacturing Industry Revenue (Million) Forecast, by Application 2019 & 2032
- Table 34: Argentina Blockchain in Manufacturing Industry Revenue (Million) Forecast, by Application 2019 & 2032
- Table 35: Peru Blockchain in Manufacturing Industry Revenue (Million) Forecast, by Application 2019 & 2032
- Table 36: Chile Blockchain in Manufacturing Industry Revenue (Million) Forecast, by Application 2019 & 2032
- Table 37: Colombia Blockchain in Manufacturing Industry Revenue (Million) Forecast, by Application 2019 & 2032
- Table 38: Ecuador Blockchain in Manufacturing Industry Revenue (Million) Forecast, by Application 2019 & 2032
- Table 39: Venezuela Blockchain in Manufacturing Industry Revenue (Million) Forecast, by Application 2019 & 2032
- Table 40: Rest of South America Blockchain in Manufacturing Industry Revenue (Million) Forecast, by Application 2019 & 2032
- Table 41: Global Blockchain in Manufacturing Industry Revenue Million Forecast, by Country 2019 & 2032
- Table 42: United States Blockchain in Manufacturing Industry Revenue (Million) Forecast, by Application 2019 & 2032
- Table 43: Canada Blockchain in Manufacturing Industry Revenue (Million) Forecast, by Application 2019 & 2032
- Table 44: Mexico Blockchain in Manufacturing Industry Revenue (Million) Forecast, by Application 2019 & 2032
- Table 45: Global Blockchain in Manufacturing Industry Revenue Million Forecast, by Country 2019 & 2032
- Table 46: United Arab Emirates Blockchain in Manufacturing Industry Revenue (Million) Forecast, by Application 2019 & 2032
- Table 47: Saudi Arabia Blockchain in Manufacturing Industry Revenue (Million) Forecast, by Application 2019 & 2032
- Table 48: South Africa Blockchain in Manufacturing Industry Revenue (Million) Forecast, by Application 2019 & 2032
- Table 49: Rest of Middle East and Africa Blockchain in Manufacturing Industry Revenue (Million) Forecast, by Application 2019 & 2032
- Table 50: Global Blockchain in Manufacturing Industry Revenue Million Forecast, by Application 2019 & 2032
- Table 51: Global Blockchain in Manufacturing Industry Revenue Million Forecast, by End-user Vertical 2019 & 2032
- Table 52: Global Blockchain in Manufacturing Industry Revenue Million Forecast, by Country 2019 & 2032
- Table 53: Global Blockchain in Manufacturing Industry Revenue Million Forecast, by Application 2019 & 2032
- Table 54: Global Blockchain in Manufacturing Industry Revenue Million Forecast, by End-user Vertical 2019 & 2032
- Table 55: Global Blockchain in Manufacturing Industry Revenue Million Forecast, by Country 2019 & 2032
- Table 56: Global Blockchain in Manufacturing Industry Revenue Million Forecast, by Application 2019 & 2032
- Table 57: Global Blockchain in Manufacturing Industry Revenue Million Forecast, by End-user Vertical 2019 & 2032
- Table 58: Global Blockchain in Manufacturing Industry Revenue Million Forecast, by Country 2019 & 2032
- Table 59: Global Blockchain in Manufacturing Industry Revenue Million Forecast, by Application 2019 & 2032
- Table 60: Global Blockchain in Manufacturing Industry Revenue Million Forecast, by End-user Vertical 2019 & 2032
- Table 61: Global Blockchain in Manufacturing Industry Revenue Million Forecast, by Country 2019 & 2032
Frequently Asked Questions
1. What is the projected Compound Annual Growth Rate (CAGR) of the Blockchain in Manufacturing Industry?
The projected CAGR is approximately 76.26%.
2. Which companies are prominent players in the Blockchain in Manufacturing Industry?
Key companies in the market include Wipro Limited, Accenture PLC, IBM Corporation, Factom Inc, Microsoft Corporation, Advanced Micro Devices Inc, Amazon Web Services Inc, Oracle Corporation, Infosys Ltd*List Not Exhaustive, SAP SE, Intel Corporation.
3. What are the main segments of the Blockchain in Manufacturing Industry?
The market segments include Application, End-user Vertical.
4. Can you provide details about the market size?
The market size is estimated to be USD XX Million as of 2022.
5. What are some drivers contributing to market growth?
Blockchain-as-a-Service Solutions for Enterprises; Simplifies Business Processes and Reduces Cost of Production.
6. What are the notable trends driving market growth?
Automotive Vertical is to Witness the Significant Growth.
7. Are there any restraints impacting market growth?
Absence of Common Set of Standards and Regulatory Bodies.
8. Can you provide examples of recent developments in the market?
June 2022: Shell, Accenture, and American Express Global Business Travel collaborated to launch Avelia, one of the first digital book-and-claim services for sustainable aviation fuel (SAF) backed by blockchain for business travel. The program's pilot phase intends to show the validity of the book-and-claim concept by securing the distribution of SAF's environmental qualities to businesses and airlines after the fuel has been supplied into the fuel network using blockchain technology.
9. What pricing options are available for accessing the report?
Pricing options include single-user, multi-user, and enterprise licenses priced at USD 4750, USD 5250, and USD 8750 respectively.
10. Is the market size provided in terms of value or volume?
The market size is provided in terms of value, measured in Million.
11. Are there any specific market keywords associated with the report?
Yes, the market keyword associated with the report is "Blockchain in Manufacturing Industry," which aids in identifying and referencing the specific market segment covered.
12. How do I determine which pricing option suits my needs best?
The pricing options vary based on user requirements and access needs. Individual users may opt for single-user licenses, while businesses requiring broader access may choose multi-user or enterprise licenses for cost-effective access to the report.
13. Are there any additional resources or data provided in the Blockchain in Manufacturing Industry report?
While the report offers comprehensive insights, it's advisable to review the specific contents or supplementary materials provided to ascertain if additional resources or data are available.
14. How can I stay updated on further developments or reports in the Blockchain in Manufacturing Industry?
To stay informed about further developments, trends, and reports in the Blockchain in Manufacturing Industry, consider subscribing to industry newsletters, following relevant companies and organizations, or regularly checking reputable industry news sources and publications.
Methodology
Step 1 - Identification of Relevant Samples Size from Population Database


Step 2 - Approaches for Defining Global Market Size (Value, Volume* & Price*)

Note*: In applicable scenarios
Step 3 - Data Sources
Primary Research
- Web Analytics
- Survey Reports
- Research Institute
- Latest Research Reports
- Opinion Leaders
Secondary Research
- Annual Reports
- White Paper
- Latest Press Release
- Industry Association
- Paid Database
- Investor Presentations

Step 4 - Data Triangulation
Involves using different sources of information in order to increase the validity of a study
These sources are likely to be stakeholders in a program - participants, other researchers, program staff, other community members, and so on.
Then we put all data in single framework & apply various statistical tools to find out the dynamic on the market.
During the analysis stage, feedback from the stakeholder groups would be compared to determine areas of agreement as well as areas of divergence


