
Key Insights
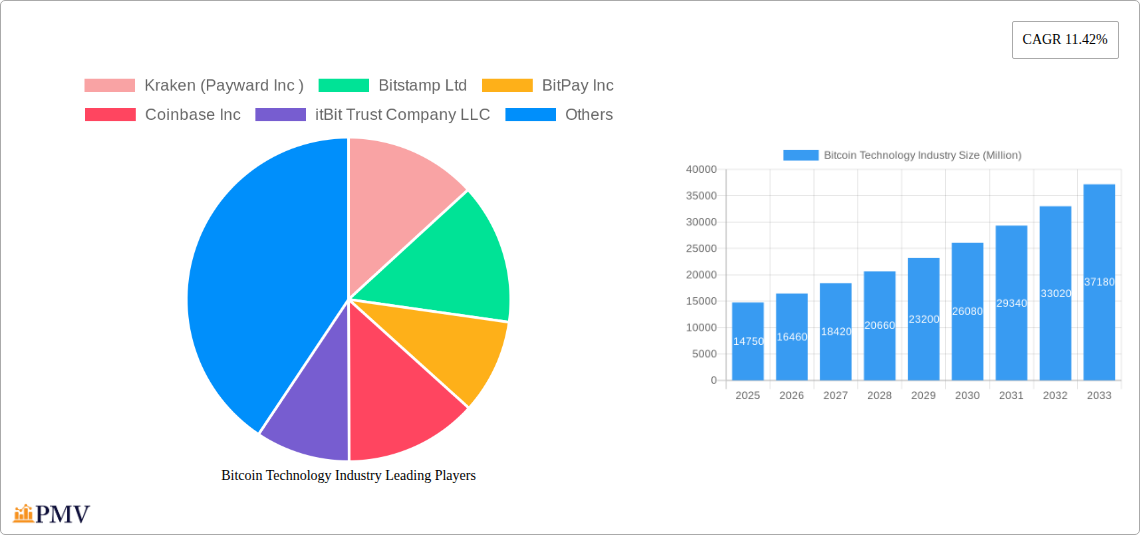
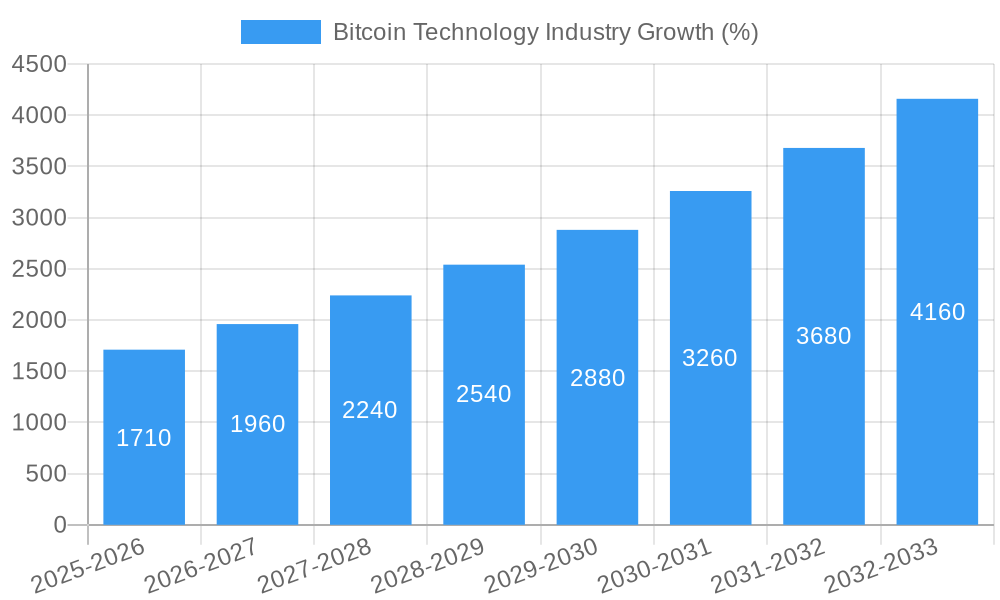
The Bitcoin technology industry, currently valued at $14.75 billion (2025), is experiencing robust growth, projected to expand at a compound annual growth rate (CAGR) of 11.42% from 2025 to 2033. This expansion is driven by several key factors. Increasing mainstream adoption of cryptocurrencies, fueled by growing awareness and regulatory clarity in certain jurisdictions, is a significant driver. Furthermore, the development of innovative applications built on Bitcoin's blockchain technology, extending beyond simple currency transactions to encompass areas like decentralized finance (DeFi), supply chain management, and digital identity verification, is propelling market growth. The rise of institutional investment in Bitcoin and related technologies further contributes to market expansion. The BFSI (Banking, Financial Services, and Insurance) sector and the e-commerce industry represent major end-user verticals, driving demand for secure and efficient payment solutions and digital asset management. While regulatory uncertainty and volatility in cryptocurrency prices remain potential restraints, the overall trajectory indicates substantial future growth potential.
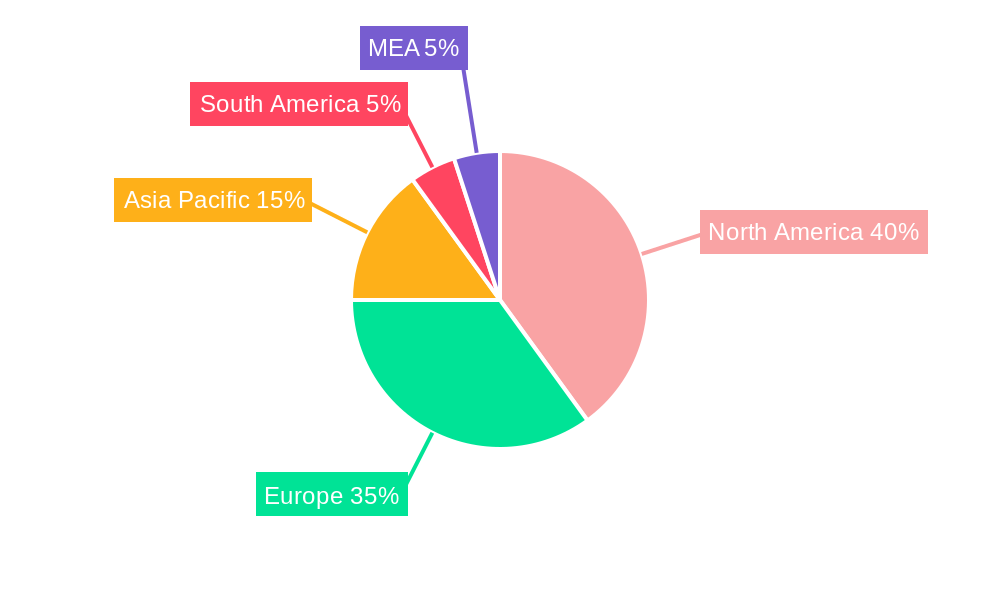
The market segmentation reveals significant opportunities. The payment and wallet services segment holds considerable market share, driven by the increasing preference for digital payment methods and the expanding use of cryptocurrency wallets. Remittance services using Bitcoin technology are also gaining traction, offering faster and cheaper cross-border transactions. Geographical analysis suggests North America and Europe currently hold a dominant market share, but the Asia-Pacific region is poised for significant growth, driven by rising internet penetration, technological advancement, and increasing cryptocurrency adoption in countries like India and China. Competition within the industry is fierce, with established players like Coinbase and Kraken alongside emerging companies vying for market share. The industry is dynamic and characterized by continuous innovation and regulatory adjustments. Strategic partnerships, technological advancements, and aggressive marketing initiatives are crucial for success in this competitive landscape. The forecast period suggests a significant increase in market valuation by 2033, driven by the factors mentioned above.
This detailed report provides a comprehensive analysis of the Bitcoin technology industry, covering market structure, competitive dynamics, industry trends, dominant segments, product innovations, and future outlook. The study period spans 2019-2033, with 2025 as the base and estimated year, and a forecast period of 2025-2033. The historical period covered is 2019-2024. The report analyzes a market valued at xx Million in 2025, projected to reach xx Million by 2033, exhibiting a CAGR of xx%.
Bitcoin Technology Industry Market Structure & Competitive Dynamics
This section analyzes the Bitcoin technology market's concentration, innovation, regulatory landscape, substitutes, end-user trends, and mergers and acquisitions (M&A) activities. The market is characterized by a moderately concentrated structure with several major players holding significant market share. However, the landscape is dynamic, with numerous smaller firms and startups contributing to innovation.
- Market Concentration: The top five players—Coinbase Inc, Kraken (Payward Inc), Bitstamp Ltd, BitPay Inc, and itBit Trust Company LLC—collectively hold an estimated xx% market share in 2025, while the remaining players are actively competing for market dominance.
- Innovation Ecosystems: Rapid technological advancements, particularly in blockchain technology, drive innovation. Open-source development and community participation foster a vibrant ecosystem, encouraging continuous improvement and the emergence of new applications and services.
- Regulatory Frameworks: The regulatory environment varies significantly across jurisdictions, presenting both opportunities and challenges for market participants. Stringent regulations in some regions could hinder growth, while a more favorable regulatory climate could accelerate adoption.
- Product Substitutes: While Bitcoin has a unique position as the original cryptocurrency, alternative cryptocurrencies and digital payment solutions represent potential substitutes, impacting market share.
- End-User Trends: Increasing adoption of Bitcoin by BFSI, e-commerce, media and entertainment, and hospitality sectors is a key growth driver. Consumer preferences are shifting towards digital assets as an investment and transaction medium.
- M&A Activities: The industry has witnessed several significant M&A deals in recent years, valued at an estimated xx Million in 2024, primarily focused on consolidating market share and expanding technological capabilities. This trend is expected to continue during the forecast period.
Bitcoin Technology Industry Industry Trends & Insights
This section delves into market growth drivers, technological disruptions, consumer preferences, and competitive dynamics, analyzing the market's trajectory. The increasing adoption of Bitcoin as a store of value, coupled with growing institutional interest, is a significant trend driving the market's expansion.
The market is influenced by several key trends:
- Growing Institutional Adoption: The acceptance of Bitcoin by large financial institutions and corporations is a crucial catalyst. Examples include Fidelity's introduction of Bitcoin investment options within 401(k) plans and Kenanga Investment Bank's integration of cryptocurrency trading within its wealth management platform.
- Technological Advancements: Ongoing developments in blockchain technology, including scalability improvements and enhanced security features, are pivotal for long-term growth.
- Regulatory Clarity (or Lack Thereof): Regulatory clarity (or its absence) profoundly impacts market growth, influencing investor confidence and adoption rates across various segments.
- Increased Consumer Awareness and Education: Greater understanding and acceptance of Bitcoin among consumers are contributing to increased transaction volumes and market expansion.
- Geopolitical Factors: Global economic uncertainty and inflation often drive investors towards Bitcoin as a potential hedge against traditional asset classes.
Dominant Markets & Segments in Bitcoin Technology Industry
This section highlights the leading regions, countries, and segments based on end-user vertical (BFSI, E-commerce, Media & Entertainment, Hospitality) and service type (Exchanges, Remittance Services, Payment & Wallet).
- By End-User Vertical: The BFSI sector is expected to be the largest segment in 2025, driven by increasing institutional investment and integration into financial services offerings. E-commerce is also witnessing significant growth, with numerous merchants accepting Bitcoin as a payment option.
- By Service: Bitcoin exchanges dominate the market in 2025, facilitating trading and exchange of Bitcoin. However, the payment and wallet segment is growing rapidly with the increasing usage of Bitcoin for daily transactions.
Key Drivers:
- Economic Policies: Supportive government policies and regulatory frameworks in some countries foster the growth of the Bitcoin ecosystem.
- Technological Infrastructure: Improved internet penetration and access to digital financial services are essential for Bitcoin adoption.
- Consumer Awareness and Trust: Educating consumers about Bitcoin's features and benefits is crucial for mass adoption.
Bitcoin Technology Industry Product Innovations
The Bitcoin technology sector is marked by continuous innovation. New wallet applications, improved exchange platforms, and advancements in blockchain security are driving industry progression. Increased functionality and ease of use are key competitive advantages. We are seeing the development of user-friendly interfaces and enhanced security measures to broaden accessibility and reduce risks.
Report Segmentation & Scope
This report segments the Bitcoin technology industry by end-user vertical (BFSI, E-commerce, Media & Entertainment, Hospitality) and by service (Exchanges, Remittance Services, Payment & Wallet). Growth projections, market sizes, and competitive dynamics are analyzed for each segment. Each segment's growth is influenced by unique factors, resulting in varied market dynamics and competitive landscapes.
Key Drivers of Bitcoin Technology Industry Growth
The Bitcoin technology industry's growth is driven by technological advancements (enhanced security, scalability improvements), economic factors (inflation hedges, alternative investment options), and regulatory changes (increasingly permissive environments in some jurisdictions). These factors are interconnected, creating a synergistic effect that accelerates adoption.
Challenges in the Bitcoin Technology Industry Sector
Regulatory uncertainty, volatility, and scaling issues pose significant challenges. Security breaches, although infrequent, can negatively impact market confidence and trust. These factors, along with intense competition, can affect market growth. The industry is also exposed to the ever-present risk of hacking or scams, hence, security and regulatory clarity are essential.
Leading Players in the Bitcoin Technology Industry Market
- Kraken (Payward Inc)
- Bitstamp Ltd
- BitPay Inc
- Coinbase Inc
- itBit Trust Company LLC
- Coinify ApS
- Unocoin Technologies Pvt Limited
- Plutus Financial Inc (ABRA)
- Blockchain Luxembourg SA
- Blockstream Corporation Inc
Key Developments in Bitcoin Technology Industry Sector
- September 2022: Fidelity introduced the option to invest up to 20% in Bitcoin for US 401(k) retirement plans, signaling growing institutional acceptance.
- August 2022: Kenanga Investment Bank's collaboration with Ant Group to launch cryptocurrency-based applications demonstrates the integration of Bitcoin into broader financial services.
Strategic Bitcoin Technology Industry Market Outlook
The Bitcoin technology industry exhibits substantial long-term growth potential, fueled by ongoing technological advancements, increasing institutional adoption, and growing consumer awareness. Strategic opportunities exist in developing innovative products and services catering to diverse market segments. Further expansion is likely in emerging markets with favorable regulatory frameworks.
Bitcoin Technology Industry Segmentation
-
1. Service
- 1.1. Exchanges
- 1.2. Remittance Services
- 1.3. Payment & Wallet
-
2. End-user Vertical
- 2.1. BFSI
- 2.2. E-Commerce
- 2.3. Media & Entertainment
- 2.4. Hospitality
Bitcoin Technology Industry Segmentation By Geography
- 1. North America
- 2. Europe
- 3. Asia
- 4. Australia and New Zealand
Bitcoin Technology Industry REPORT HIGHLIGHTS
| Aspects | Details |
|---|---|
| Study Period | 2019-2033 |
| Base Year | 2024 |
| Estimated Year | 2025 |
| Forecast Period | 2025-2033 |
| Historical Period | 2019-2024 |
| Growth Rate | CAGR of 11.42% from 2019-2033 |
| Segmentation |
|
Table of Contents
- 1. Introduction
- 1.1. Research Scope
- 1.2. Market Segmentation
- 1.3. Research Methodology
- 1.4. Definitions and Assumptions
- 2. Executive Summary
- 2.1. Introduction
- 3. Market Dynamics
- 3.1. Introduction
- 3.2. Market Drivers
- 3.2.1. Decentralized and Borderless Payment System
- 3.3. Market Restrains
- 3.3.1. Highly Volatile Currency
- 3.4. Market Trends
- 3.4.1. BFSI to Occupy the Largest Market Share
- 4. Market Factor Analysis
- 4.1. Porters Five Forces
- 4.2. Supply/Value Chain
- 4.3. PESTEL analysis
- 4.4. Market Entropy
- 4.5. Patent/Trademark Analysis
- 5. Global Bitcoin Technology Industry Analysis, Insights and Forecast, 2019-2031
- 5.1. Market Analysis, Insights and Forecast - by Service
- 5.1.1. Exchanges
- 5.1.2. Remittance Services
- 5.1.3. Payment & Wallet
- 5.2. Market Analysis, Insights and Forecast - by End-user Vertical
- 5.2.1. BFSI
- 5.2.2. E-Commerce
- 5.2.3. Media & Entertainment
- 5.2.4. Hospitality
- 5.3. Market Analysis, Insights and Forecast - by Region
- 5.3.1. North America
- 5.3.2. Europe
- 5.3.3. Asia
- 5.3.4. Australia and New Zealand
- 5.1. Market Analysis, Insights and Forecast - by Service
- 6. North America Bitcoin Technology Industry Analysis, Insights and Forecast, 2019-2031
- 6.1. Market Analysis, Insights and Forecast - by Service
- 6.1.1. Exchanges
- 6.1.2. Remittance Services
- 6.1.3. Payment & Wallet
- 6.2. Market Analysis, Insights and Forecast - by End-user Vertical
- 6.2.1. BFSI
- 6.2.2. E-Commerce
- 6.2.3. Media & Entertainment
- 6.2.4. Hospitality
- 6.1. Market Analysis, Insights and Forecast - by Service
- 7. Europe Bitcoin Technology Industry Analysis, Insights and Forecast, 2019-2031
- 7.1. Market Analysis, Insights and Forecast - by Service
- 7.1.1. Exchanges
- 7.1.2. Remittance Services
- 7.1.3. Payment & Wallet
- 7.2. Market Analysis, Insights and Forecast - by End-user Vertical
- 7.2.1. BFSI
- 7.2.2. E-Commerce
- 7.2.3. Media & Entertainment
- 7.2.4. Hospitality
- 7.1. Market Analysis, Insights and Forecast - by Service
- 8. Asia Bitcoin Technology Industry Analysis, Insights and Forecast, 2019-2031
- 8.1. Market Analysis, Insights and Forecast - by Service
- 8.1.1. Exchanges
- 8.1.2. Remittance Services
- 8.1.3. Payment & Wallet
- 8.2. Market Analysis, Insights and Forecast - by End-user Vertical
- 8.2.1. BFSI
- 8.2.2. E-Commerce
- 8.2.3. Media & Entertainment
- 8.2.4. Hospitality
- 8.1. Market Analysis, Insights and Forecast - by Service
- 9. Australia and New Zealand Bitcoin Technology Industry Analysis, Insights and Forecast, 2019-2031
- 9.1. Market Analysis, Insights and Forecast - by Service
- 9.1.1. Exchanges
- 9.1.2. Remittance Services
- 9.1.3. Payment & Wallet
- 9.2. Market Analysis, Insights and Forecast - by End-user Vertical
- 9.2.1. BFSI
- 9.2.2. E-Commerce
- 9.2.3. Media & Entertainment
- 9.2.4. Hospitality
- 9.1. Market Analysis, Insights and Forecast - by Service
- 10. North America Bitcoin Technology Industry Analysis, Insights and Forecast, 2019-2031
- 10.1. Market Analysis, Insights and Forecast - By Country/Sub-region
- 10.1.1 United States
- 10.1.2 Canada
- 10.1.3 Mexico
- 11. Europe Bitcoin Technology Industry Analysis, Insights and Forecast, 2019-2031
- 11.1. Market Analysis, Insights and Forecast - By Country/Sub-region
- 11.1.1 Germany
- 11.1.2 United Kingdom
- 11.1.3 France
- 11.1.4 Spain
- 11.1.5 Italy
- 11.1.6 Spain
- 11.1.7 Belgium
- 11.1.8 Netherland
- 11.1.9 Nordics
- 11.1.10 Rest of Europe
- 12. Asia Pacific Bitcoin Technology Industry Analysis, Insights and Forecast, 2019-2031
- 12.1. Market Analysis, Insights and Forecast - By Country/Sub-region
- 12.1.1 China
- 12.1.2 Japan
- 12.1.3 India
- 12.1.4 South Korea
- 12.1.5 Southeast Asia
- 12.1.6 Australia
- 12.1.7 Indonesia
- 12.1.8 Phillipes
- 12.1.9 Singapore
- 12.1.10 Thailandc
- 12.1.11 Rest of Asia Pacific
- 13. South America Bitcoin Technology Industry Analysis, Insights and Forecast, 2019-2031
- 13.1. Market Analysis, Insights and Forecast - By Country/Sub-region
- 13.1.1 Brazil
- 13.1.2 Argentina
- 13.1.3 Peru
- 13.1.4 Chile
- 13.1.5 Colombia
- 13.1.6 Ecuador
- 13.1.7 Venezuela
- 13.1.8 Rest of South America
- 14. North America Bitcoin Technology Industry Analysis, Insights and Forecast, 2019-2031
- 14.1. Market Analysis, Insights and Forecast - By Country/Sub-region
- 14.1.1 United States
- 14.1.2 Canada
- 14.1.3 Mexico
- 15. MEA Bitcoin Technology Industry Analysis, Insights and Forecast, 2019-2031
- 15.1. Market Analysis, Insights and Forecast - By Country/Sub-region
- 15.1.1 United Arab Emirates
- 15.1.2 Saudi Arabia
- 15.1.3 South Africa
- 15.1.4 Rest of Middle East and Africa
- 16. Competitive Analysis
- 16.1. Global Market Share Analysis 2024
- 16.2. Company Profiles
- 16.2.1 Kraken (Payward Inc )
- 16.2.1.1. Overview
- 16.2.1.2. Products
- 16.2.1.3. SWOT Analysis
- 16.2.1.4. Recent Developments
- 16.2.1.5. Financials (Based on Availability)
- 16.2.2 Bitstamp Ltd
- 16.2.2.1. Overview
- 16.2.2.2. Products
- 16.2.2.3. SWOT Analysis
- 16.2.2.4. Recent Developments
- 16.2.2.5. Financials (Based on Availability)
- 16.2.3 BitPay Inc
- 16.2.3.1. Overview
- 16.2.3.2. Products
- 16.2.3.3. SWOT Analysis
- 16.2.3.4. Recent Developments
- 16.2.3.5. Financials (Based on Availability)
- 16.2.4 Coinbase Inc
- 16.2.4.1. Overview
- 16.2.4.2. Products
- 16.2.4.3. SWOT Analysis
- 16.2.4.4. Recent Developments
- 16.2.4.5. Financials (Based on Availability)
- 16.2.5 itBit Trust Company LLC
- 16.2.5.1. Overview
- 16.2.5.2. Products
- 16.2.5.3. SWOT Analysis
- 16.2.5.4. Recent Developments
- 16.2.5.5. Financials (Based on Availability)
- 16.2.6 Coinify ApS
- 16.2.6.1. Overview
- 16.2.6.2. Products
- 16.2.6.3. SWOT Analysis
- 16.2.6.4. Recent Developments
- 16.2.6.5. Financials (Based on Availability)
- 16.2.7 Unocoin Technologies Pvt Limited
- 16.2.7.1. Overview
- 16.2.7.2. Products
- 16.2.7.3. SWOT Analysis
- 16.2.7.4. Recent Developments
- 16.2.7.5. Financials (Based on Availability)
- 16.2.8 Plutus Financial Inc (ABRA)
- 16.2.8.1. Overview
- 16.2.8.2. Products
- 16.2.8.3. SWOT Analysis
- 16.2.8.4. Recent Developments
- 16.2.8.5. Financials (Based on Availability)
- 16.2.9 Blockchain Luxembourg SA
- 16.2.9.1. Overview
- 16.2.9.2. Products
- 16.2.9.3. SWOT Analysis
- 16.2.9.4. Recent Developments
- 16.2.9.5. Financials (Based on Availability)
- 16.2.10 Blockstream Corporation Inc
- 16.2.10.1. Overview
- 16.2.10.2. Products
- 16.2.10.3. SWOT Analysis
- 16.2.10.4. Recent Developments
- 16.2.10.5. Financials (Based on Availability)
- 16.2.1 Kraken (Payward Inc )
List of Figures
- Figure 1: Global Bitcoin Technology Industry Revenue Breakdown (Million, %) by Region 2024 & 2032
- Figure 2: North America Bitcoin Technology Industry Revenue (Million), by Country 2024 & 2032
- Figure 3: North America Bitcoin Technology Industry Revenue Share (%), by Country 2024 & 2032
- Figure 4: Europe Bitcoin Technology Industry Revenue (Million), by Country 2024 & 2032
- Figure 5: Europe Bitcoin Technology Industry Revenue Share (%), by Country 2024 & 2032
- Figure 6: Asia Pacific Bitcoin Technology Industry Revenue (Million), by Country 2024 & 2032
- Figure 7: Asia Pacific Bitcoin Technology Industry Revenue Share (%), by Country 2024 & 2032
- Figure 8: South America Bitcoin Technology Industry Revenue (Million), by Country 2024 & 2032
- Figure 9: South America Bitcoin Technology Industry Revenue Share (%), by Country 2024 & 2032
- Figure 10: North America Bitcoin Technology Industry Revenue (Million), by Country 2024 & 2032
- Figure 11: North America Bitcoin Technology Industry Revenue Share (%), by Country 2024 & 2032
- Figure 12: MEA Bitcoin Technology Industry Revenue (Million), by Country 2024 & 2032
- Figure 13: MEA Bitcoin Technology Industry Revenue Share (%), by Country 2024 & 2032
- Figure 14: North America Bitcoin Technology Industry Revenue (Million), by Service 2024 & 2032
- Figure 15: North America Bitcoin Technology Industry Revenue Share (%), by Service 2024 & 2032
- Figure 16: North America Bitcoin Technology Industry Revenue (Million), by End-user Vertical 2024 & 2032
- Figure 17: North America Bitcoin Technology Industry Revenue Share (%), by End-user Vertical 2024 & 2032
- Figure 18: North America Bitcoin Technology Industry Revenue (Million), by Country 2024 & 2032
- Figure 19: North America Bitcoin Technology Industry Revenue Share (%), by Country 2024 & 2032
- Figure 20: Europe Bitcoin Technology Industry Revenue (Million), by Service 2024 & 2032
- Figure 21: Europe Bitcoin Technology Industry Revenue Share (%), by Service 2024 & 2032
- Figure 22: Europe Bitcoin Technology Industry Revenue (Million), by End-user Vertical 2024 & 2032
- Figure 23: Europe Bitcoin Technology Industry Revenue Share (%), by End-user Vertical 2024 & 2032
- Figure 24: Europe Bitcoin Technology Industry Revenue (Million), by Country 2024 & 2032
- Figure 25: Europe Bitcoin Technology Industry Revenue Share (%), by Country 2024 & 2032
- Figure 26: Asia Bitcoin Technology Industry Revenue (Million), by Service 2024 & 2032
- Figure 27: Asia Bitcoin Technology Industry Revenue Share (%), by Service 2024 & 2032
- Figure 28: Asia Bitcoin Technology Industry Revenue (Million), by End-user Vertical 2024 & 2032
- Figure 29: Asia Bitcoin Technology Industry Revenue Share (%), by End-user Vertical 2024 & 2032
- Figure 30: Asia Bitcoin Technology Industry Revenue (Million), by Country 2024 & 2032
- Figure 31: Asia Bitcoin Technology Industry Revenue Share (%), by Country 2024 & 2032
- Figure 32: Australia and New Zealand Bitcoin Technology Industry Revenue (Million), by Service 2024 & 2032
- Figure 33: Australia and New Zealand Bitcoin Technology Industry Revenue Share (%), by Service 2024 & 2032
- Figure 34: Australia and New Zealand Bitcoin Technology Industry Revenue (Million), by End-user Vertical 2024 & 2032
- Figure 35: Australia and New Zealand Bitcoin Technology Industry Revenue Share (%), by End-user Vertical 2024 & 2032
- Figure 36: Australia and New Zealand Bitcoin Technology Industry Revenue (Million), by Country 2024 & 2032
- Figure 37: Australia and New Zealand Bitcoin Technology Industry Revenue Share (%), by Country 2024 & 2032
List of Tables
- Table 1: Global Bitcoin Technology Industry Revenue Million Forecast, by Region 2019 & 2032
- Table 2: Global Bitcoin Technology Industry Revenue Million Forecast, by Service 2019 & 2032
- Table 3: Global Bitcoin Technology Industry Revenue Million Forecast, by End-user Vertical 2019 & 2032
- Table 4: Global Bitcoin Technology Industry Revenue Million Forecast, by Region 2019 & 2032
- Table 5: Global Bitcoin Technology Industry Revenue Million Forecast, by Country 2019 & 2032
- Table 6: United States Bitcoin Technology Industry Revenue (Million) Forecast, by Application 2019 & 2032
- Table 7: Canada Bitcoin Technology Industry Revenue (Million) Forecast, by Application 2019 & 2032
- Table 8: Mexico Bitcoin Technology Industry Revenue (Million) Forecast, by Application 2019 & 2032
- Table 9: Global Bitcoin Technology Industry Revenue Million Forecast, by Country 2019 & 2032
- Table 10: Germany Bitcoin Technology Industry Revenue (Million) Forecast, by Application 2019 & 2032
- Table 11: United Kingdom Bitcoin Technology Industry Revenue (Million) Forecast, by Application 2019 & 2032
- Table 12: France Bitcoin Technology Industry Revenue (Million) Forecast, by Application 2019 & 2032
- Table 13: Spain Bitcoin Technology Industry Revenue (Million) Forecast, by Application 2019 & 2032
- Table 14: Italy Bitcoin Technology Industry Revenue (Million) Forecast, by Application 2019 & 2032
- Table 15: Spain Bitcoin Technology Industry Revenue (Million) Forecast, by Application 2019 & 2032
- Table 16: Belgium Bitcoin Technology Industry Revenue (Million) Forecast, by Application 2019 & 2032
- Table 17: Netherland Bitcoin Technology Industry Revenue (Million) Forecast, by Application 2019 & 2032
- Table 18: Nordics Bitcoin Technology Industry Revenue (Million) Forecast, by Application 2019 & 2032
- Table 19: Rest of Europe Bitcoin Technology Industry Revenue (Million) Forecast, by Application 2019 & 2032
- Table 20: Global Bitcoin Technology Industry Revenue Million Forecast, by Country 2019 & 2032
- Table 21: China Bitcoin Technology Industry Revenue (Million) Forecast, by Application 2019 & 2032
- Table 22: Japan Bitcoin Technology Industry Revenue (Million) Forecast, by Application 2019 & 2032
- Table 23: India Bitcoin Technology Industry Revenue (Million) Forecast, by Application 2019 & 2032
- Table 24: South Korea Bitcoin Technology Industry Revenue (Million) Forecast, by Application 2019 & 2032
- Table 25: Southeast Asia Bitcoin Technology Industry Revenue (Million) Forecast, by Application 2019 & 2032
- Table 26: Australia Bitcoin Technology Industry Revenue (Million) Forecast, by Application 2019 & 2032
- Table 27: Indonesia Bitcoin Technology Industry Revenue (Million) Forecast, by Application 2019 & 2032
- Table 28: Phillipes Bitcoin Technology Industry Revenue (Million) Forecast, by Application 2019 & 2032
- Table 29: Singapore Bitcoin Technology Industry Revenue (Million) Forecast, by Application 2019 & 2032
- Table 30: Thailandc Bitcoin Technology Industry Revenue (Million) Forecast, by Application 2019 & 2032
- Table 31: Rest of Asia Pacific Bitcoin Technology Industry Revenue (Million) Forecast, by Application 2019 & 2032
- Table 32: Global Bitcoin Technology Industry Revenue Million Forecast, by Country 2019 & 2032
- Table 33: Brazil Bitcoin Technology Industry Revenue (Million) Forecast, by Application 2019 & 2032
- Table 34: Argentina Bitcoin Technology Industry Revenue (Million) Forecast, by Application 2019 & 2032
- Table 35: Peru Bitcoin Technology Industry Revenue (Million) Forecast, by Application 2019 & 2032
- Table 36: Chile Bitcoin Technology Industry Revenue (Million) Forecast, by Application 2019 & 2032
- Table 37: Colombia Bitcoin Technology Industry Revenue (Million) Forecast, by Application 2019 & 2032
- Table 38: Ecuador Bitcoin Technology Industry Revenue (Million) Forecast, by Application 2019 & 2032
- Table 39: Venezuela Bitcoin Technology Industry Revenue (Million) Forecast, by Application 2019 & 2032
- Table 40: Rest of South America Bitcoin Technology Industry Revenue (Million) Forecast, by Application 2019 & 2032
- Table 41: Global Bitcoin Technology Industry Revenue Million Forecast, by Country 2019 & 2032
- Table 42: United States Bitcoin Technology Industry Revenue (Million) Forecast, by Application 2019 & 2032
- Table 43: Canada Bitcoin Technology Industry Revenue (Million) Forecast, by Application 2019 & 2032
- Table 44: Mexico Bitcoin Technology Industry Revenue (Million) Forecast, by Application 2019 & 2032
- Table 45: Global Bitcoin Technology Industry Revenue Million Forecast, by Country 2019 & 2032
- Table 46: United Arab Emirates Bitcoin Technology Industry Revenue (Million) Forecast, by Application 2019 & 2032
- Table 47: Saudi Arabia Bitcoin Technology Industry Revenue (Million) Forecast, by Application 2019 & 2032
- Table 48: South Africa Bitcoin Technology Industry Revenue (Million) Forecast, by Application 2019 & 2032
- Table 49: Rest of Middle East and Africa Bitcoin Technology Industry Revenue (Million) Forecast, by Application 2019 & 2032
- Table 50: Global Bitcoin Technology Industry Revenue Million Forecast, by Service 2019 & 2032
- Table 51: Global Bitcoin Technology Industry Revenue Million Forecast, by End-user Vertical 2019 & 2032
- Table 52: Global Bitcoin Technology Industry Revenue Million Forecast, by Country 2019 & 2032
- Table 53: Global Bitcoin Technology Industry Revenue Million Forecast, by Service 2019 & 2032
- Table 54: Global Bitcoin Technology Industry Revenue Million Forecast, by End-user Vertical 2019 & 2032
- Table 55: Global Bitcoin Technology Industry Revenue Million Forecast, by Country 2019 & 2032
- Table 56: Global Bitcoin Technology Industry Revenue Million Forecast, by Service 2019 & 2032
- Table 57: Global Bitcoin Technology Industry Revenue Million Forecast, by End-user Vertical 2019 & 2032
- Table 58: Global Bitcoin Technology Industry Revenue Million Forecast, by Country 2019 & 2032
- Table 59: Global Bitcoin Technology Industry Revenue Million Forecast, by Service 2019 & 2032
- Table 60: Global Bitcoin Technology Industry Revenue Million Forecast, by End-user Vertical 2019 & 2032
- Table 61: Global Bitcoin Technology Industry Revenue Million Forecast, by Country 2019 & 2032
Frequently Asked Questions
1. What is the projected Compound Annual Growth Rate (CAGR) of the Bitcoin Technology Industry?
The projected CAGR is approximately 11.42%.
2. Which companies are prominent players in the Bitcoin Technology Industry?
Key companies in the market include Kraken (Payward Inc ), Bitstamp Ltd, BitPay Inc, Coinbase Inc, itBit Trust Company LLC, Coinify ApS, Unocoin Technologies Pvt Limited, Plutus Financial Inc (ABRA), Blockchain Luxembourg SA, Blockstream Corporation Inc.
3. What are the main segments of the Bitcoin Technology Industry?
The market segments include Service, End-user Vertical.
4. Can you provide details about the market size?
The market size is estimated to be USD 14.75 Million as of 2022.
5. What are some drivers contributing to market growth?
Decentralized and Borderless Payment System.
6. What are the notable trends driving market growth?
BFSI to Occupy the Largest Market Share.
7. Are there any restraints impacting market growth?
Highly Volatile Currency.
8. Can you provide examples of recent developments in the market?
September 2022: Fidelity has introduced the option to invest up to 20% in Bitcoin for the US 401 (k) retirement investment plan. The financial services firm says Bitcoin represents a long-term investment in future blockchain technology. This investment prospect will become available by mid-2022 to 23,000 employers that employ Fidelity to administer their retirement accounts.
9. What pricing options are available for accessing the report?
Pricing options include single-user, multi-user, and enterprise licenses priced at USD 4750, USD 5250, and USD 8750 respectively.
10. Is the market size provided in terms of value or volume?
The market size is provided in terms of value, measured in Million.
11. Are there any specific market keywords associated with the report?
Yes, the market keyword associated with the report is "Bitcoin Technology Industry," which aids in identifying and referencing the specific market segment covered.
12. How do I determine which pricing option suits my needs best?
The pricing options vary based on user requirements and access needs. Individual users may opt for single-user licenses, while businesses requiring broader access may choose multi-user or enterprise licenses for cost-effective access to the report.
13. Are there any additional resources or data provided in the Bitcoin Technology Industry report?
While the report offers comprehensive insights, it's advisable to review the specific contents or supplementary materials provided to ascertain if additional resources or data are available.
14. How can I stay updated on further developments or reports in the Bitcoin Technology Industry?
To stay informed about further developments, trends, and reports in the Bitcoin Technology Industry, consider subscribing to industry newsletters, following relevant companies and organizations, or regularly checking reputable industry news sources and publications.
Methodology
Step 1 - Identification of Relevant Samples Size from Population Database


Step 2 - Approaches for Defining Global Market Size (Value, Volume* & Price*)

Note*: In applicable scenarios
Step 3 - Data Sources
Primary Research
- Web Analytics
- Survey Reports
- Research Institute
- Latest Research Reports
- Opinion Leaders
Secondary Research
- Annual Reports
- White Paper
- Latest Press Release
- Industry Association
- Paid Database
- Investor Presentations

Step 4 - Data Triangulation
Involves using different sources of information in order to increase the validity of a study
These sources are likely to be stakeholders in a program - participants, other researchers, program staff, other community members, and so on.
Then we put all data in single framework & apply various statistical tools to find out the dynamic on the market.
During the analysis stage, feedback from the stakeholder groups would be compared to determine areas of agreement as well as areas of divergence


