
Key Insights
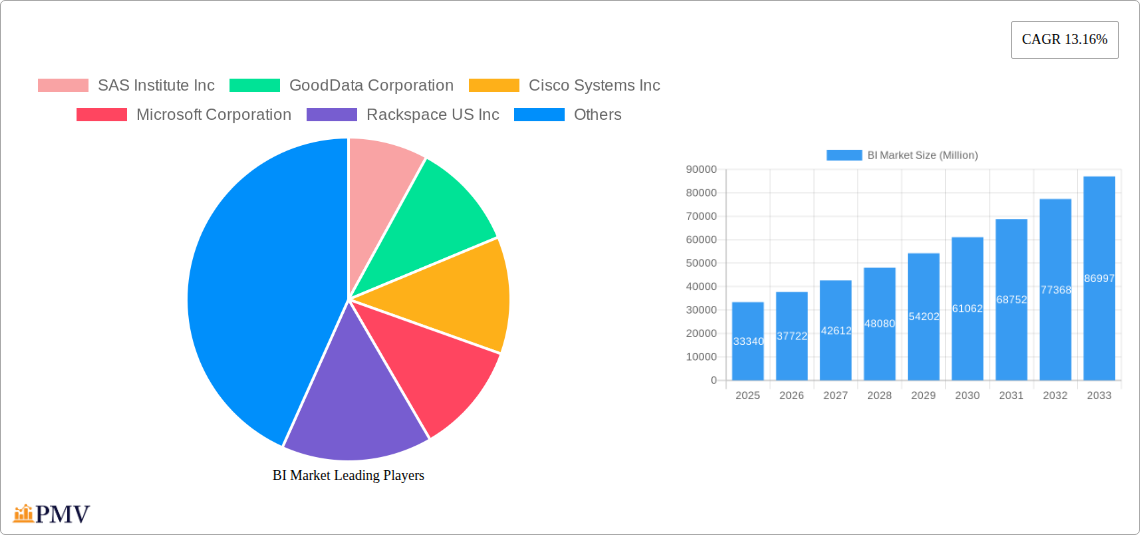
The Business Intelligence (BI) market is experiencing robust growth, projected to reach \$33.34 billion in 2025 and maintain a Compound Annual Growth Rate (CAGR) of 13.16% from 2025 to 2033. This expansion is driven by several key factors. The increasing volume and complexity of data generated by businesses across various sectors necessitates sophisticated analytical tools for informed decision-making. The rise of cloud computing offers scalable and cost-effective BI solutions, further fueling market growth. Furthermore, the adoption of advanced analytics techniques, such as predictive analytics and machine learning, is enhancing the value proposition of BI, attracting a wider range of users beyond traditional IT departments. The BFSI (Banking, Financial Services, and Insurance), IT and Telecommunication, and Retail sectors are leading adopters, leveraging BI for improved customer relationship management, risk mitigation, and operational efficiency. However, challenges remain, including data integration complexities, the need for skilled professionals to interpret and utilize BI insights effectively, and concerns around data security and privacy. Despite these hurdles, the ongoing digital transformation across industries promises sustained growth for the BI market in the coming years.
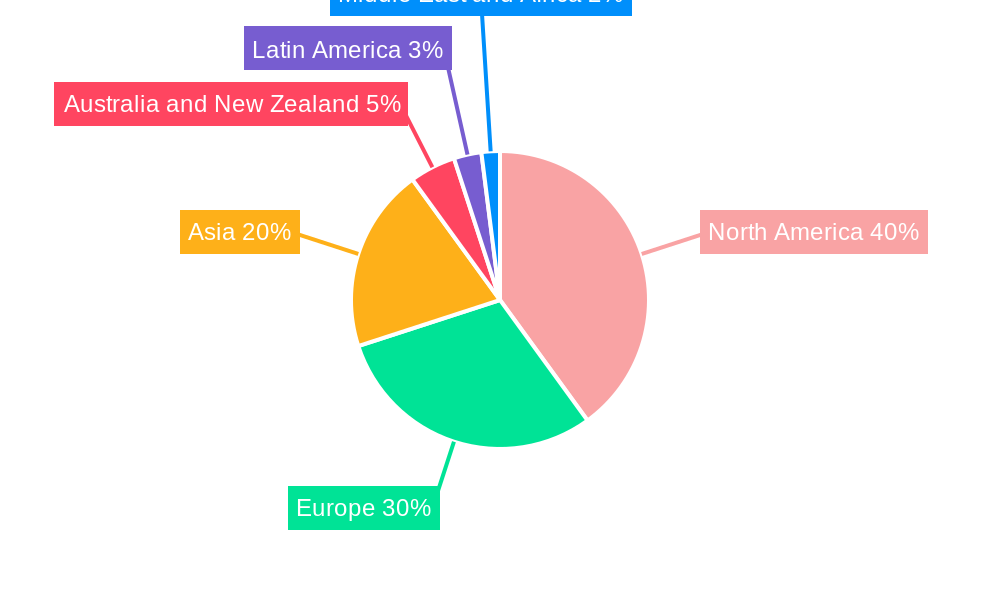
The competitive landscape is characterized by a mix of established players like SAS Institute, IBM, and Microsoft, alongside emerging technology companies specializing in cloud-based BI solutions. Continuous innovation in areas such as data visualization, self-service analytics, and embedded analytics is driving competition. The market is segmented by component (Software & Platform, Services), deployment (On-Premise, Cloud), and end-user industry, reflecting the diverse applications of BI solutions. Geographic distribution shows a concentration in North America and Europe, but significant growth potential exists in Asia and other emerging markets as digital adoption accelerates. The market's future hinges on ongoing technological advancements, the expanding adoption of big data analytics, and the increasing demand for actionable insights across various business functions. Successful players will need to adapt quickly to the evolving technological landscape and meet the ever-growing demand for user-friendly and accessible BI solutions.
BI Market Report: Comprehensive Analysis & Forecast (2019-2033)
This in-depth report provides a comprehensive analysis of the Business Intelligence (BI) market, offering valuable insights for stakeholders across the industry. The report covers the period from 2019 to 2033, with 2025 as the base and estimated year. We project significant growth, driven by technological advancements and increasing adoption across various sectors. The report uses Million for all values.
BI Market Market Structure & Competitive Dynamics
The BI market exhibits a moderately concentrated structure, with key players like SAS Institute Inc, GoodData Corporation, Cisco Systems Inc, Microsoft Corporation, Rackspace US Inc, International Business Machines Corporation, Tableau Software Inc (Salesforce), Oracle Corporation, Targit AS, VMware Inc, and SAP SE holding significant market share. However, a vibrant ecosystem of smaller players and startups fosters continuous innovation.
Market share data suggests that the top 5 players control approximately xx% of the market in 2025, with a projected xx% increase by 2033. The regulatory landscape varies by region, impacting data privacy and security compliance. Product substitution mainly comes from alternative analytics platforms and specialized solutions catering to niche needs. End-user trends point towards a preference for cloud-based solutions and increasing demand for self-service BI tools. M&A activity has been consistent, with deal values totaling approximately xx Million in the last five years. Notable deals involved [Insert specific M&A examples if available, otherwise remove this sentence].
BI Market Industry Trends & Insights
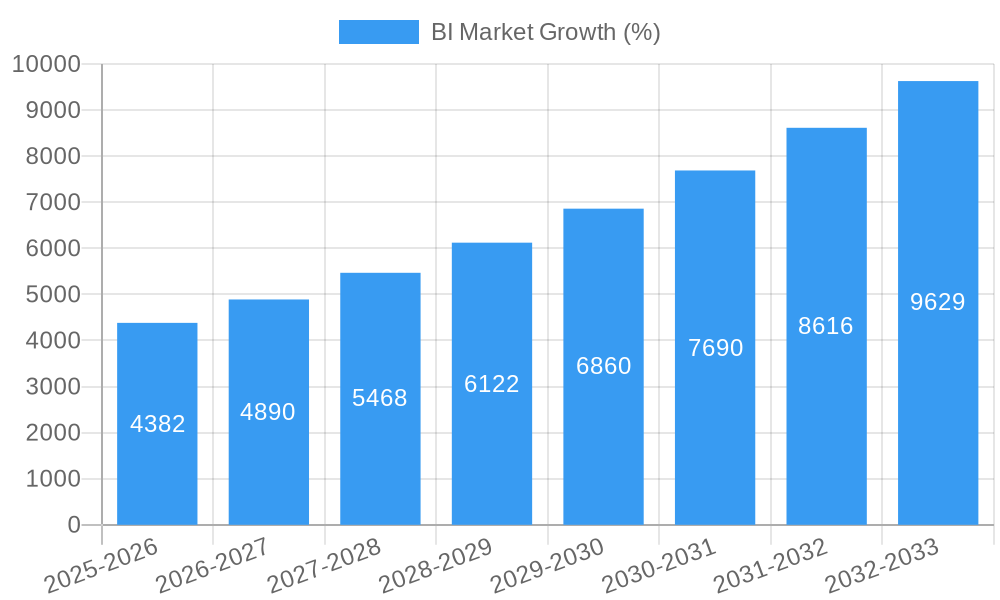
The BI market is experiencing robust growth, driven by several factors. The Compound Annual Growth Rate (CAGR) is projected to be xx% during the forecast period (2025-2033). Increasing data volumes, the need for real-time insights, and the growing adoption of cloud computing are key growth drivers. Technological disruptions, such as the rise of artificial intelligence (AI) and machine learning (ML) in BI, are transforming the landscape. Consumer preferences are shifting towards user-friendly interfaces, mobile accessibility, and advanced analytics capabilities. Intense competition among established players and new entrants is fueling innovation and driving down prices, increasing market penetration. Market penetration in key sectors such as BFSI and healthcare is expected to reach xx% by 2033.
Dominant Markets & Segments in BI Market
Leading Region/Country: North America currently dominates the BI market, owing to strong technological infrastructure, high adoption rates, and the presence of major BI vendors. However, Asia-Pacific is witnessing rapid growth and is expected to become a significant market in the future.
By Component: The software and platform segment holds the largest market share, driven by the increasing demand for comprehensive BI solutions. The services segment is also experiencing significant growth, driven by the need for consulting, implementation, and maintenance services.
By Deployment: Cloud-based BI solutions are gaining popularity due to their scalability, cost-effectiveness, and accessibility. The cloud segment is expected to witness the highest CAGR during the forecast period. However, on-premise deployments still hold a significant market share in certain industries.
By End-User Industry: The BFSI sector is a major adopter of BI solutions, driven by the need for risk management, fraud detection, and customer relationship management. The IT and telecommunication sectors also exhibit high adoption rates. The healthcare sector is witnessing increasing adoption due to the need for improved patient care and operational efficiency.
Key drivers for dominance in various segments include robust economic policies, well-developed IT infrastructure, and supportive regulatory frameworks.
BI Market Product Innovations
Recent innovations focus on embedding AI and ML for advanced analytics, self-service capabilities, and enhanced data visualization. Products now incorporate natural language processing (NLP) for intuitive interaction and support diverse data sources. These advancements cater to the increasing demand for real-time insights and actionable intelligence across various industries, providing significant competitive advantages through improved efficiency and decision-making.
Report Segmentation & Scope
The BI market is segmented by component (software and platform, services), deployment (on-premise, cloud), and end-user industry (BFSI, IT and Telecommunication, Retail, Healthcare, Other End-User Industries). Each segment's growth is projected based on various factors such as technological advancements, adoption rates, and industry-specific needs. Competitive dynamics vary across segments, with varying levels of concentration and innovation. Market sizes and growth projections are provided for each segment, along with detailed competitive analysis.
Key Drivers of BI Market Growth
The BI market's growth is propelled by several key factors. The exponential increase in data volume necessitates efficient analytics solutions. The need for real-time decision-making across industries fuels demand. Cloud-based solutions offer scalability and cost-effectiveness. Advances in AI/ML are augmenting analytical capabilities. Strong government support for digital transformation in many regions is also playing a significant role.
Challenges in the BI Market Sector
Despite strong growth, the BI market faces challenges. Data security and privacy concerns are paramount. Integrating disparate data sources can be complex. High implementation costs and the need for skilled professionals present hurdles. Competition from new entrants and evolving technologies pose ongoing pressure on market players. These factors collectively impact market growth, potentially slowing adoption rates in certain sectors.
Leading Players in the BI Market Market
- SAS Institute Inc
- GoodData Corporation
- Cisco Systems Inc
- Microsoft Corporation
- Rackspace US Inc
- International Business Machines Corporation
- Tableau Software Inc (Salesforce)
- Oracle Corporation
- Targit AS
- VMware Inc
- SAP SE
Key Developments in BI Market Sector
May 2023: Rackspace US Inc announced Object Storage, a cost-effective solution for storing and utilizing unstructured data, potentially saving organizations over 80% on cloud storage costs. This innovation impacts the cloud storage segment significantly.
May 2023: GoodData Corporation launched its Last Mile ETL feature, streamlining data management processes for improved efficiency. This enhances the value proposition of their platform.
Strategic BI Market Market Outlook
The BI market is poised for continued expansion driven by technological advancements, increased data generation, and the growing need for data-driven decision-making. Strategic opportunities lie in developing AI/ML-powered solutions, enhancing data visualization capabilities, and focusing on niche industry applications. Companies that successfully integrate these advancements and adapt to changing market dynamics will gain a competitive edge and benefit from the market’s robust growth potential.
BI Market Segmentation
-
1. Component
- 1.1. Software and Platform
- 1.2. Services
-
2. Deployment
- 2.1. On-Premise
- 2.2. Cloud
-
3. End-User Industry
- 3.1. BFSI
- 3.2. IT and Telecommunication
- 3.3. Retail
- 3.4. Healthcare
- 3.5. Other End-User Industries
BI Market Segmentation By Geography
- 1. North America
- 2. Europe
- 3. Asia
- 4. Australia and New Zealand
- 5. Latin America
- 6. Middle East and Africa
BI Market REPORT HIGHLIGHTS
| Aspects | Details |
|---|---|
| Study Period | 2019-2033 |
| Base Year | 2024 |
| Estimated Year | 2025 |
| Forecast Period | 2025-2033 |
| Historical Period | 2019-2024 |
| Growth Rate | CAGR of 13.16% from 2019-2033 |
| Segmentation |
|
Table of Contents
- 1. Introduction
- 1.1. Research Scope
- 1.2. Market Segmentation
- 1.3. Research Methodology
- 1.4. Definitions and Assumptions
- 2. Executive Summary
- 2.1. Introduction
- 3. Market Dynamics
- 3.1. Introduction
- 3.2. Market Drivers
- 3.2.1. Increasing Adoption of Data Analytics by Enterprises; Emergence of IoT-Enabled Technologies
- 3.3. Market Restrains
- 3.3.1. High Investment Costs for On-Premise Solutions; Lack of Skilled Professionals
- 3.4. Market Trends
- 3.4.1. BFSI Industry is Expected to Drive the Market Growth
- 4. Market Factor Analysis
- 4.1. Porters Five Forces
- 4.2. Supply/Value Chain
- 4.3. PESTEL analysis
- 4.4. Market Entropy
- 4.5. Patent/Trademark Analysis
- 5. Global BI Market Analysis, Insights and Forecast, 2019-2031
- 5.1. Market Analysis, Insights and Forecast - by Component
- 5.1.1. Software and Platform
- 5.1.2. Services
- 5.2. Market Analysis, Insights and Forecast - by Deployment
- 5.2.1. On-Premise
- 5.2.2. Cloud
- 5.3. Market Analysis, Insights and Forecast - by End-User Industry
- 5.3.1. BFSI
- 5.3.2. IT and Telecommunication
- 5.3.3. Retail
- 5.3.4. Healthcare
- 5.3.5. Other End-User Industries
- 5.4. Market Analysis, Insights and Forecast - by Region
- 5.4.1. North America
- 5.4.2. Europe
- 5.4.3. Asia
- 5.4.4. Australia and New Zealand
- 5.4.5. Latin America
- 5.4.6. Middle East and Africa
- 5.1. Market Analysis, Insights and Forecast - by Component
- 6. North America BI Market Analysis, Insights and Forecast, 2019-2031
- 6.1. Market Analysis, Insights and Forecast - by Component
- 6.1.1. Software and Platform
- 6.1.2. Services
- 6.2. Market Analysis, Insights and Forecast - by Deployment
- 6.2.1. On-Premise
- 6.2.2. Cloud
- 6.3. Market Analysis, Insights and Forecast - by End-User Industry
- 6.3.1. BFSI
- 6.3.2. IT and Telecommunication
- 6.3.3. Retail
- 6.3.4. Healthcare
- 6.3.5. Other End-User Industries
- 6.1. Market Analysis, Insights and Forecast - by Component
- 7. Europe BI Market Analysis, Insights and Forecast, 2019-2031
- 7.1. Market Analysis, Insights and Forecast - by Component
- 7.1.1. Software and Platform
- 7.1.2. Services
- 7.2. Market Analysis, Insights and Forecast - by Deployment
- 7.2.1. On-Premise
- 7.2.2. Cloud
- 7.3. Market Analysis, Insights and Forecast - by End-User Industry
- 7.3.1. BFSI
- 7.3.2. IT and Telecommunication
- 7.3.3. Retail
- 7.3.4. Healthcare
- 7.3.5. Other End-User Industries
- 7.1. Market Analysis, Insights and Forecast - by Component
- 8. Asia BI Market Analysis, Insights and Forecast, 2019-2031
- 8.1. Market Analysis, Insights and Forecast - by Component
- 8.1.1. Software and Platform
- 8.1.2. Services
- 8.2. Market Analysis, Insights and Forecast - by Deployment
- 8.2.1. On-Premise
- 8.2.2. Cloud
- 8.3. Market Analysis, Insights and Forecast - by End-User Industry
- 8.3.1. BFSI
- 8.3.2. IT and Telecommunication
- 8.3.3. Retail
- 8.3.4. Healthcare
- 8.3.5. Other End-User Industries
- 8.1. Market Analysis, Insights and Forecast - by Component
- 9. Australia and New Zealand BI Market Analysis, Insights and Forecast, 2019-2031
- 9.1. Market Analysis, Insights and Forecast - by Component
- 9.1.1. Software and Platform
- 9.1.2. Services
- 9.2. Market Analysis, Insights and Forecast - by Deployment
- 9.2.1. On-Premise
- 9.2.2. Cloud
- 9.3. Market Analysis, Insights and Forecast - by End-User Industry
- 9.3.1. BFSI
- 9.3.2. IT and Telecommunication
- 9.3.3. Retail
- 9.3.4. Healthcare
- 9.3.5. Other End-User Industries
- 9.1. Market Analysis, Insights and Forecast - by Component
- 10. Latin America BI Market Analysis, Insights and Forecast, 2019-2031
- 10.1. Market Analysis, Insights and Forecast - by Component
- 10.1.1. Software and Platform
- 10.1.2. Services
- 10.2. Market Analysis, Insights and Forecast - by Deployment
- 10.2.1. On-Premise
- 10.2.2. Cloud
- 10.3. Market Analysis, Insights and Forecast - by End-User Industry
- 10.3.1. BFSI
- 10.3.2. IT and Telecommunication
- 10.3.3. Retail
- 10.3.4. Healthcare
- 10.3.5. Other End-User Industries
- 10.1. Market Analysis, Insights and Forecast - by Component
- 11. Middle East and Africa BI Market Analysis, Insights and Forecast, 2019-2031
- 11.1. Market Analysis, Insights and Forecast - by Component
- 11.1.1. Software and Platform
- 11.1.2. Services
- 11.2. Market Analysis, Insights and Forecast - by Deployment
- 11.2.1. On-Premise
- 11.2.2. Cloud
- 11.3. Market Analysis, Insights and Forecast - by End-User Industry
- 11.3.1. BFSI
- 11.3.2. IT and Telecommunication
- 11.3.3. Retail
- 11.3.4. Healthcare
- 11.3.5. Other End-User Industries
- 11.1. Market Analysis, Insights and Forecast - by Component
- 12. North America BI Market Analysis, Insights and Forecast, 2019-2031
- 12.1. Market Analysis, Insights and Forecast - By Country/Sub-region
- 12.1.1.
- 13. Europe BI Market Analysis, Insights and Forecast, 2019-2031
- 13.1. Market Analysis, Insights and Forecast - By Country/Sub-region
- 13.1.1.
- 14. Asia BI Market Analysis, Insights and Forecast, 2019-2031
- 14.1. Market Analysis, Insights and Forecast - By Country/Sub-region
- 14.1.1.
- 15. Australia and New Zealand BI Market Analysis, Insights and Forecast, 2019-2031
- 15.1. Market Analysis, Insights and Forecast - By Country/Sub-region
- 15.1.1.
- 16. Latin America BI Market Analysis, Insights and Forecast, 2019-2031
- 16.1. Market Analysis, Insights and Forecast - By Country/Sub-region
- 16.1.1.
- 17. Middle East and Africa BI Market Analysis, Insights and Forecast, 2019-2031
- 17.1. Market Analysis, Insights and Forecast - By Country/Sub-region
- 17.1.1.
- 18. Competitive Analysis
- 18.1. Global Market Share Analysis 2024
- 18.2. Company Profiles
- 18.2.1 SAS Institute Inc
- 18.2.1.1. Overview
- 18.2.1.2. Products
- 18.2.1.3. SWOT Analysis
- 18.2.1.4. Recent Developments
- 18.2.1.5. Financials (Based on Availability)
- 18.2.2 GoodData Corporation
- 18.2.2.1. Overview
- 18.2.2.2. Products
- 18.2.2.3. SWOT Analysis
- 18.2.2.4. Recent Developments
- 18.2.2.5. Financials (Based on Availability)
- 18.2.3 Cisco Systems Inc
- 18.2.3.1. Overview
- 18.2.3.2. Products
- 18.2.3.3. SWOT Analysis
- 18.2.3.4. Recent Developments
- 18.2.3.5. Financials (Based on Availability)
- 18.2.4 Microsoft Corporation
- 18.2.4.1. Overview
- 18.2.4.2. Products
- 18.2.4.3. SWOT Analysis
- 18.2.4.4. Recent Developments
- 18.2.4.5. Financials (Based on Availability)
- 18.2.5 Rackspace US Inc
- 18.2.5.1. Overview
- 18.2.5.2. Products
- 18.2.5.3. SWOT Analysis
- 18.2.5.4. Recent Developments
- 18.2.5.5. Financials (Based on Availability)
- 18.2.6 International Business Machines Corporation
- 18.2.6.1. Overview
- 18.2.6.2. Products
- 18.2.6.3. SWOT Analysis
- 18.2.6.4. Recent Developments
- 18.2.6.5. Financials (Based on Availability)
- 18.2.7 Tableau Software Inc (Salesforce)*List Not Exhaustive
- 18.2.7.1. Overview
- 18.2.7.2. Products
- 18.2.7.3. SWOT Analysis
- 18.2.7.4. Recent Developments
- 18.2.7.5. Financials (Based on Availability)
- 18.2.8 Oracle Corporation
- 18.2.8.1. Overview
- 18.2.8.2. Products
- 18.2.8.3. SWOT Analysis
- 18.2.8.4. Recent Developments
- 18.2.8.5. Financials (Based on Availability)
- 18.2.9 Targit AS
- 18.2.9.1. Overview
- 18.2.9.2. Products
- 18.2.9.3. SWOT Analysis
- 18.2.9.4. Recent Developments
- 18.2.9.5. Financials (Based on Availability)
- 18.2.10 VMware Inc
- 18.2.10.1. Overview
- 18.2.10.2. Products
- 18.2.10.3. SWOT Analysis
- 18.2.10.4. Recent Developments
- 18.2.10.5. Financials (Based on Availability)
- 18.2.11 SAP SE
- 18.2.11.1. Overview
- 18.2.11.2. Products
- 18.2.11.3. SWOT Analysis
- 18.2.11.4. Recent Developments
- 18.2.11.5. Financials (Based on Availability)
- 18.2.1 SAS Institute Inc
List of Figures
- Figure 1: Global BI Market Revenue Breakdown (Million, %) by Region 2024 & 2032
- Figure 2: North America BI Market Revenue (Million), by Country 2024 & 2032
- Figure 3: North America BI Market Revenue Share (%), by Country 2024 & 2032
- Figure 4: Europe BI Market Revenue (Million), by Country 2024 & 2032
- Figure 5: Europe BI Market Revenue Share (%), by Country 2024 & 2032
- Figure 6: Asia BI Market Revenue (Million), by Country 2024 & 2032
- Figure 7: Asia BI Market Revenue Share (%), by Country 2024 & 2032
- Figure 8: Australia and New Zealand BI Market Revenue (Million), by Country 2024 & 2032
- Figure 9: Australia and New Zealand BI Market Revenue Share (%), by Country 2024 & 2032
- Figure 10: Latin America BI Market Revenue (Million), by Country 2024 & 2032
- Figure 11: Latin America BI Market Revenue Share (%), by Country 2024 & 2032
- Figure 12: Middle East and Africa BI Market Revenue (Million), by Country 2024 & 2032
- Figure 13: Middle East and Africa BI Market Revenue Share (%), by Country 2024 & 2032
- Figure 14: North America BI Market Revenue (Million), by Component 2024 & 2032
- Figure 15: North America BI Market Revenue Share (%), by Component 2024 & 2032
- Figure 16: North America BI Market Revenue (Million), by Deployment 2024 & 2032
- Figure 17: North America BI Market Revenue Share (%), by Deployment 2024 & 2032
- Figure 18: North America BI Market Revenue (Million), by End-User Industry 2024 & 2032
- Figure 19: North America BI Market Revenue Share (%), by End-User Industry 2024 & 2032
- Figure 20: North America BI Market Revenue (Million), by Country 2024 & 2032
- Figure 21: North America BI Market Revenue Share (%), by Country 2024 & 2032
- Figure 22: Europe BI Market Revenue (Million), by Component 2024 & 2032
- Figure 23: Europe BI Market Revenue Share (%), by Component 2024 & 2032
- Figure 24: Europe BI Market Revenue (Million), by Deployment 2024 & 2032
- Figure 25: Europe BI Market Revenue Share (%), by Deployment 2024 & 2032
- Figure 26: Europe BI Market Revenue (Million), by End-User Industry 2024 & 2032
- Figure 27: Europe BI Market Revenue Share (%), by End-User Industry 2024 & 2032
- Figure 28: Europe BI Market Revenue (Million), by Country 2024 & 2032
- Figure 29: Europe BI Market Revenue Share (%), by Country 2024 & 2032
- Figure 30: Asia BI Market Revenue (Million), by Component 2024 & 2032
- Figure 31: Asia BI Market Revenue Share (%), by Component 2024 & 2032
- Figure 32: Asia BI Market Revenue (Million), by Deployment 2024 & 2032
- Figure 33: Asia BI Market Revenue Share (%), by Deployment 2024 & 2032
- Figure 34: Asia BI Market Revenue (Million), by End-User Industry 2024 & 2032
- Figure 35: Asia BI Market Revenue Share (%), by End-User Industry 2024 & 2032
- Figure 36: Asia BI Market Revenue (Million), by Country 2024 & 2032
- Figure 37: Asia BI Market Revenue Share (%), by Country 2024 & 2032
- Figure 38: Australia and New Zealand BI Market Revenue (Million), by Component 2024 & 2032
- Figure 39: Australia and New Zealand BI Market Revenue Share (%), by Component 2024 & 2032
- Figure 40: Australia and New Zealand BI Market Revenue (Million), by Deployment 2024 & 2032
- Figure 41: Australia and New Zealand BI Market Revenue Share (%), by Deployment 2024 & 2032
- Figure 42: Australia and New Zealand BI Market Revenue (Million), by End-User Industry 2024 & 2032
- Figure 43: Australia and New Zealand BI Market Revenue Share (%), by End-User Industry 2024 & 2032
- Figure 44: Australia and New Zealand BI Market Revenue (Million), by Country 2024 & 2032
- Figure 45: Australia and New Zealand BI Market Revenue Share (%), by Country 2024 & 2032
- Figure 46: Latin America BI Market Revenue (Million), by Component 2024 & 2032
- Figure 47: Latin America BI Market Revenue Share (%), by Component 2024 & 2032
- Figure 48: Latin America BI Market Revenue (Million), by Deployment 2024 & 2032
- Figure 49: Latin America BI Market Revenue Share (%), by Deployment 2024 & 2032
- Figure 50: Latin America BI Market Revenue (Million), by End-User Industry 2024 & 2032
- Figure 51: Latin America BI Market Revenue Share (%), by End-User Industry 2024 & 2032
- Figure 52: Latin America BI Market Revenue (Million), by Country 2024 & 2032
- Figure 53: Latin America BI Market Revenue Share (%), by Country 2024 & 2032
- Figure 54: Middle East and Africa BI Market Revenue (Million), by Component 2024 & 2032
- Figure 55: Middle East and Africa BI Market Revenue Share (%), by Component 2024 & 2032
- Figure 56: Middle East and Africa BI Market Revenue (Million), by Deployment 2024 & 2032
- Figure 57: Middle East and Africa BI Market Revenue Share (%), by Deployment 2024 & 2032
- Figure 58: Middle East and Africa BI Market Revenue (Million), by End-User Industry 2024 & 2032
- Figure 59: Middle East and Africa BI Market Revenue Share (%), by End-User Industry 2024 & 2032
- Figure 60: Middle East and Africa BI Market Revenue (Million), by Country 2024 & 2032
- Figure 61: Middle East and Africa BI Market Revenue Share (%), by Country 2024 & 2032
List of Tables
- Table 1: Global BI Market Revenue Million Forecast, by Region 2019 & 2032
- Table 2: Global BI Market Revenue Million Forecast, by Component 2019 & 2032
- Table 3: Global BI Market Revenue Million Forecast, by Deployment 2019 & 2032
- Table 4: Global BI Market Revenue Million Forecast, by End-User Industry 2019 & 2032
- Table 5: Global BI Market Revenue Million Forecast, by Region 2019 & 2032
- Table 6: Global BI Market Revenue Million Forecast, by Country 2019 & 2032
- Table 7: BI Market Revenue (Million) Forecast, by Application 2019 & 2032
- Table 8: Global BI Market Revenue Million Forecast, by Country 2019 & 2032
- Table 9: BI Market Revenue (Million) Forecast, by Application 2019 & 2032
- Table 10: Global BI Market Revenue Million Forecast, by Country 2019 & 2032
- Table 11: BI Market Revenue (Million) Forecast, by Application 2019 & 2032
- Table 12: Global BI Market Revenue Million Forecast, by Country 2019 & 2032
- Table 13: BI Market Revenue (Million) Forecast, by Application 2019 & 2032
- Table 14: Global BI Market Revenue Million Forecast, by Country 2019 & 2032
- Table 15: BI Market Revenue (Million) Forecast, by Application 2019 & 2032
- Table 16: Global BI Market Revenue Million Forecast, by Country 2019 & 2032
- Table 17: BI Market Revenue (Million) Forecast, by Application 2019 & 2032
- Table 18: Global BI Market Revenue Million Forecast, by Component 2019 & 2032
- Table 19: Global BI Market Revenue Million Forecast, by Deployment 2019 & 2032
- Table 20: Global BI Market Revenue Million Forecast, by End-User Industry 2019 & 2032
- Table 21: Global BI Market Revenue Million Forecast, by Country 2019 & 2032
- Table 22: Global BI Market Revenue Million Forecast, by Component 2019 & 2032
- Table 23: Global BI Market Revenue Million Forecast, by Deployment 2019 & 2032
- Table 24: Global BI Market Revenue Million Forecast, by End-User Industry 2019 & 2032
- Table 25: Global BI Market Revenue Million Forecast, by Country 2019 & 2032
- Table 26: Global BI Market Revenue Million Forecast, by Component 2019 & 2032
- Table 27: Global BI Market Revenue Million Forecast, by Deployment 2019 & 2032
- Table 28: Global BI Market Revenue Million Forecast, by End-User Industry 2019 & 2032
- Table 29: Global BI Market Revenue Million Forecast, by Country 2019 & 2032
- Table 30: Global BI Market Revenue Million Forecast, by Component 2019 & 2032
- Table 31: Global BI Market Revenue Million Forecast, by Deployment 2019 & 2032
- Table 32: Global BI Market Revenue Million Forecast, by End-User Industry 2019 & 2032
- Table 33: Global BI Market Revenue Million Forecast, by Country 2019 & 2032
- Table 34: Global BI Market Revenue Million Forecast, by Component 2019 & 2032
- Table 35: Global BI Market Revenue Million Forecast, by Deployment 2019 & 2032
- Table 36: Global BI Market Revenue Million Forecast, by End-User Industry 2019 & 2032
- Table 37: Global BI Market Revenue Million Forecast, by Country 2019 & 2032
- Table 38: Global BI Market Revenue Million Forecast, by Component 2019 & 2032
- Table 39: Global BI Market Revenue Million Forecast, by Deployment 2019 & 2032
- Table 40: Global BI Market Revenue Million Forecast, by End-User Industry 2019 & 2032
- Table 41: Global BI Market Revenue Million Forecast, by Country 2019 & 2032
Frequently Asked Questions
1. What is the projected Compound Annual Growth Rate (CAGR) of the BI Market?
The projected CAGR is approximately 13.16%.
2. Which companies are prominent players in the BI Market?
Key companies in the market include SAS Institute Inc, GoodData Corporation, Cisco Systems Inc, Microsoft Corporation, Rackspace US Inc, International Business Machines Corporation, Tableau Software Inc (Salesforce)*List Not Exhaustive, Oracle Corporation, Targit AS, VMware Inc, SAP SE.
3. What are the main segments of the BI Market?
The market segments include Component, Deployment, End-User Industry.
4. Can you provide details about the market size?
The market size is estimated to be USD 33.34 Million as of 2022.
5. What are some drivers contributing to market growth?
Increasing Adoption of Data Analytics by Enterprises; Emergence of IoT-Enabled Technologies.
6. What are the notable trends driving market growth?
BFSI Industry is Expected to Drive the Market Growth.
7. Are there any restraints impacting market growth?
High Investment Costs for On-Premise Solutions; Lack of Skilled Professionals.
8. Can you provide examples of recent developments in the market?
May 2023: Rackspace US Inc announced Object Storage which enables organizations securely store and utilize large pools of unstructured data, where Rackspace Object Storage saves substantial costs by eliminating data egress, retrieval, and transaction charges. In many cases, the Rackspace Object Storage solution can save more than 80% over hyper-scale cloud storage options. For multi-cloud customers operating modern S3-enabled applications, this is a new paradigm that facilitates better performance and lower costs, even as data-intensive applications continue to drive up the need for storage,
9. What pricing options are available for accessing the report?
Pricing options include single-user, multi-user, and enterprise licenses priced at USD 4750, USD 5250, and USD 8750 respectively.
10. Is the market size provided in terms of value or volume?
The market size is provided in terms of value, measured in Million.
11. Are there any specific market keywords associated with the report?
Yes, the market keyword associated with the report is "BI Market," which aids in identifying and referencing the specific market segment covered.
12. How do I determine which pricing option suits my needs best?
The pricing options vary based on user requirements and access needs. Individual users may opt for single-user licenses, while businesses requiring broader access may choose multi-user or enterprise licenses for cost-effective access to the report.
13. Are there any additional resources or data provided in the BI Market report?
While the report offers comprehensive insights, it's advisable to review the specific contents or supplementary materials provided to ascertain if additional resources or data are available.
14. How can I stay updated on further developments or reports in the BI Market?
To stay informed about further developments, trends, and reports in the BI Market, consider subscribing to industry newsletters, following relevant companies and organizations, or regularly checking reputable industry news sources and publications.
Methodology
Step 1 - Identification of Relevant Samples Size from Population Database


Step 2 - Approaches for Defining Global Market Size (Value, Volume* & Price*)

Note*: In applicable scenarios
Step 3 - Data Sources
Primary Research
- Web Analytics
- Survey Reports
- Research Institute
- Latest Research Reports
- Opinion Leaders
Secondary Research
- Annual Reports
- White Paper
- Latest Press Release
- Industry Association
- Paid Database
- Investor Presentations

Step 4 - Data Triangulation
Involves using different sources of information in order to increase the validity of a study
These sources are likely to be stakeholders in a program - participants, other researchers, program staff, other community members, and so on.
Then we put all data in single framework & apply various statistical tools to find out the dynamic on the market.
During the analysis stage, feedback from the stakeholder groups would be compared to determine areas of agreement as well as areas of divergence


