
Key Insights
The global beer can market, currently experiencing a 3.5% CAGR, presents a compelling investment opportunity. Driven by increasing beer consumption, particularly in developing economies, and the inherent advantages of aluminum and steel/tin cans in terms of recyclability, lightweight portability, and preservation of beer quality, the market is poised for significant growth. The preference for convenient, single-serving packaging formats fuels demand, especially amongst younger demographics. While material cost fluctuations and environmental concerns regarding aluminum production represent potential restraints, ongoing innovation in sustainable manufacturing practices and the rise of eco-conscious consumers are mitigating these factors. The market is segmented by product type, with aluminum cans currently dominating due to their lightweight nature and recyclability. Key players like Ball Corporation, Crown Holdings Inc., and Toyo Seikan Kaisha Ltd. are leading innovation and expansion, focusing on improved designs, enhanced sustainability initiatives, and strategic partnerships to capitalize on market growth. The Asia-Pacific region, fueled by robust economic growth and rising disposable incomes in countries like China and India, is expected to witness the highest growth rate. North America and Europe, while mature markets, will continue to contribute significantly due to established consumption patterns and ongoing product diversification.
Looking ahead to 2033, the market will likely see continued consolidation amongst major players as companies invest in advanced manufacturing capabilities and seek strategic acquisitions to expand their market share. Furthermore, the growing demand for premium and craft beers will drive the need for innovative can designs and sizes, leading to further market segmentation and specialization. Companies are also focusing on enhancing the consumer experience through innovative can designs and collaborations with breweries to create unique and appealing packaging. The ongoing emphasis on sustainability, with initiatives focused on increased recycling rates and the use of recycled materials, will play a crucial role in shaping the future trajectory of the beer can market.
Beer Cans Industry: A Comprehensive Market Report (2019-2033)
This detailed report provides a comprehensive analysis of the global Beer Cans industry, covering market size, competitive landscape, growth drivers, and future outlook. With a study period spanning 2019-2033, a base year of 2025, and a forecast period of 2025-2033, this report offers invaluable insights for industry stakeholders, investors, and strategic decision-makers. The report covers a market valued at over XX Million in 2024, with projections showing significant growth over the forecast period.
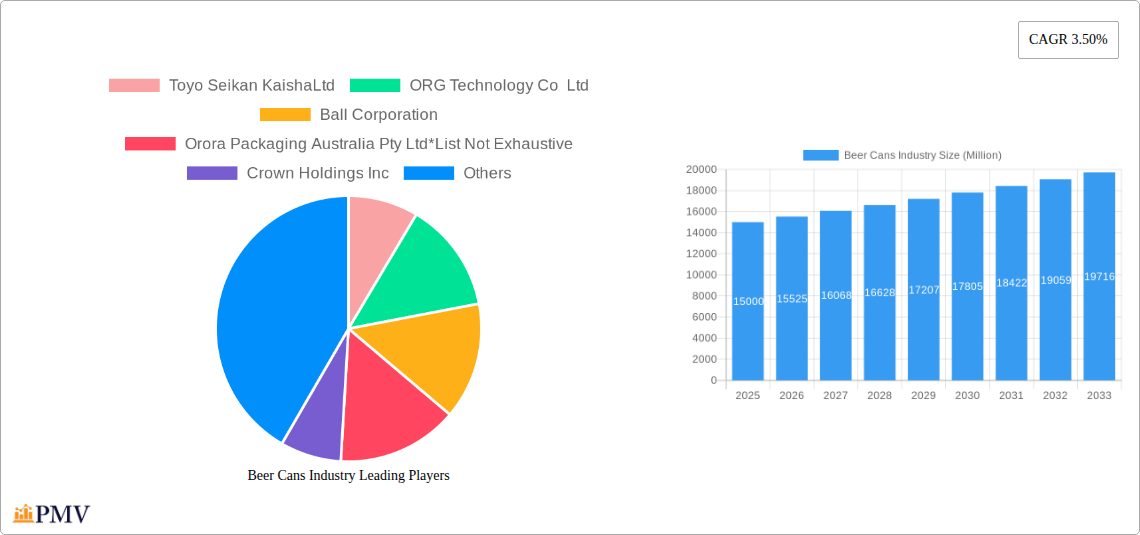
Beer Cans Industry Market Structure & Competitive Dynamics
The global beer cans market is characterized by a moderately concentrated structure, with several major players holding significant market share. Key competitors include Toyo Seikan Kaisha Ltd, ORG Technology Co Ltd, Ball Corporation, Orora Packaging Australia Pty Ltd, Crown Holdings Inc, Shenzhen Xin Yuheng Can Co Ltd, Kaufman Container, Daiwa Can Co, and Can-Pack S.A. However, the market also includes numerous smaller regional players, particularly in emerging economies.
Market share is dynamic, with ongoing competition driven by innovation, pricing strategies, and geographic expansion. Recent mergers and acquisitions (M&A) activity has been moderate, with deal values ranging from XX Million to XX Million in recent years, primarily focused on consolidating market share and expanding production capacity. The regulatory framework varies across geographies, impacting material sourcing, production processes, and waste management. The industry faces increasing pressure from environmental concerns, driving demand for sustainable and recyclable packaging solutions. Product substitutes, such as glass bottles and plastic containers, present competitive challenges, though aluminum and steel cans retain advantages in terms of recyclability and barrier properties. End-user trends favor convenient, lightweight packaging, and this further supports the growth of the beer can market.
Beer Cans Industry Industry Trends & Insights
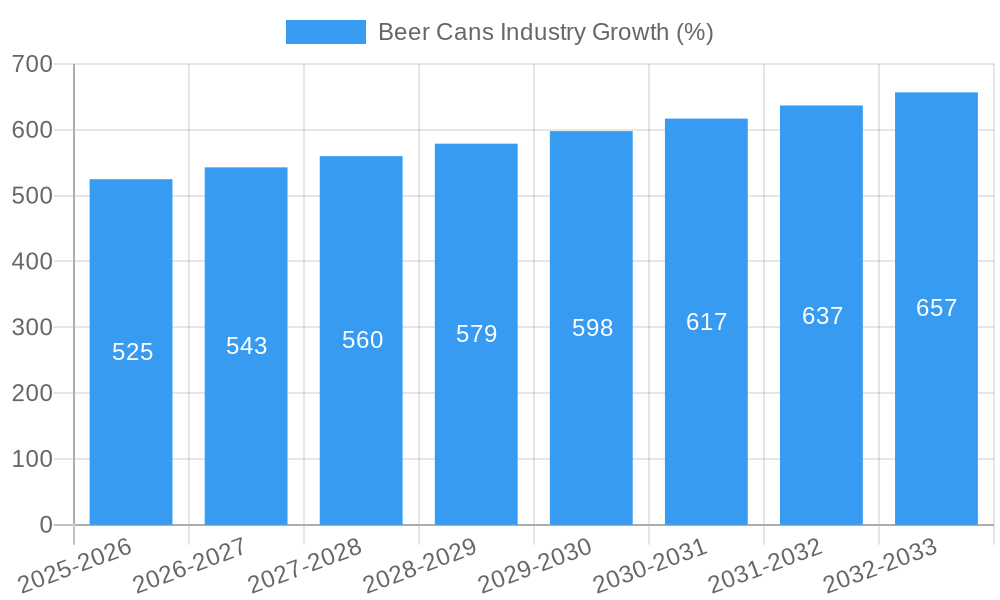
The beer cans market is experiencing robust growth, driven primarily by increasing beer consumption globally, particularly in developing economies. The market’s Compound Annual Growth Rate (CAGR) is projected to be XX% during the forecast period (2025-2033). Technological advancements in can manufacturing, including lightweighting and improved printing technologies, are boosting efficiency and enhancing product appeal. Consumer preferences are shifting towards eco-friendly packaging, fueling demand for recyclable aluminum and steel cans. The industry's competitive landscape remains dynamic, with ongoing innovation and expansion efforts from major players. Market penetration of aluminum cans is higher than steel cans in many regions, but steel cans maintain relevance for specific market niches due to their cost-effectiveness.
Dominant Markets & Segments in Beer Cans Industry
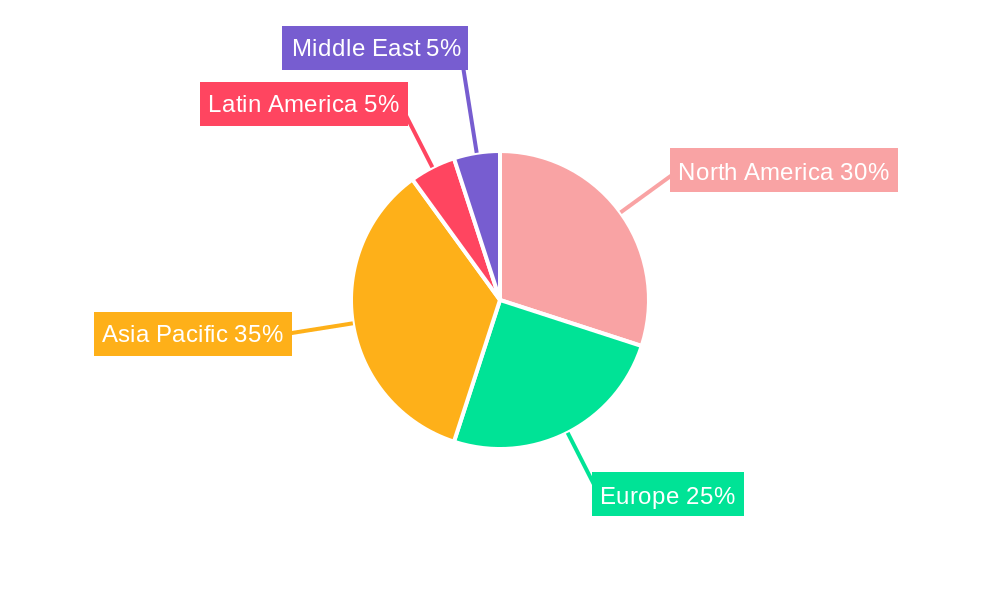
The North American and European markets currently dominate the global beer cans industry, driven by high beer consumption, established infrastructure, and a strong presence of major players. However, significant growth potential exists in Asia-Pacific and Latin America regions.
Key Drivers of Market Dominance:
- High Beer Consumption: Established beer-drinking cultures fuel demand for cans.
- Established Infrastructure: Well-developed manufacturing, distribution, and recycling networks.
- Strong Player Presence: Concentration of major players with substantial production capacity.
- Favorable Economic Conditions: Strong economies in developed markets support consumer spending.
By Product Type:
Aluminum Cans: The aluminum can segment holds a larger market share due to its superior recyclability, lightweight nature, and aesthetic appeal. It is projected to maintain a leading position throughout the forecast period. The recent introduction of 90% recycled content aluminum cups by Ball Corporation underscores industry commitment to sustainability.
Steel/Tin Cans: The steel/tin can segment holds a smaller yet still significant market share, primarily due to cost advantages in certain regions. It maintains relevance due to its robust nature and suitability for specific applications.
Beer Cans Industry Product Innovations
Recent innovations in the beer cans industry include lightweighting technologies, resulting in reduced material usage and improved sustainability. Advances in printing and decoration techniques have enhanced the aesthetic appeal of cans. The development of infinitely recyclable aluminum cups and the reduction in standard can weight by Crown Holdings showcase the industry's focus on sustainable practices and efficient production.
Report Segmentation & Scope
This report segments the beer cans market primarily by product type:
Aluminum Cans: This segment is projected to witness significant growth owing to increased preference for sustainable packaging. The competitive landscape is characterized by intense competition among major players.
Steel/Tin Cans: This segment is expected to exhibit steady growth, primarily driven by cost-effectiveness and suitability for certain applications. However, this segment faces increased pressure from the growth of aluminum cans.
Key Drivers of Beer Cans Industry Growth
Key growth drivers include:
- Rising Beer Consumption: Increasing global beer consumption is the primary driver, especially in emerging markets.
- Sustainable Packaging Trends: The growing preference for eco-friendly packaging solutions is boosting demand for recyclable aluminum and steel cans.
- Technological Advancements: Innovations in manufacturing processes and printing technologies are enhancing efficiency and product appeal.
Challenges in the Beer Cans Industry Sector
Challenges faced by the industry include:
- Fluctuating Raw Material Prices: Price volatility of aluminum and steel impacts production costs.
- Environmental Regulations: Stringent environmental regulations concerning waste management and recycling create compliance costs.
- Intense Competition: Competition among major players requires constant innovation and efficient operations.
Leading Players in the Beer Cans Industry Market
- Toyo Seikan Kaisha Ltd
- ORG Technology Co Ltd
- Ball Corporation
- Orora Packaging Australia Pty Ltd
- Crown Holdings Inc
- Shenzhen Xin Yuheng Can Co Ltd
- Kaufman Container
- Daiwa Can Co
- Can-Pack S.A
Key Developments in Beer Cans Industry Sector
October 2022: Ball Corporation announced the portfolio expansion of its infinitely recyclable ball aluminum cup with the launch of two new, smaller sizes (9-ounce and 12-ounce cup sizes). The cup now comprises 90% recycled content. This development reinforces the company's commitment to sustainability and could significantly impact the market share of aluminum beverage packaging.
September 2022: Crown Holdings, Inc. announced a 4% global average reduction in the weight of its standard 12 oz (330 ml) can. This lightweighting initiative contributes to sustainability efforts by reducing GHG emissions and increasing the number of cans produced from the same amount of aluminum. This development highlights the industry's focus on resource efficiency.
Strategic Beer Cans Industry Market Outlook
The beer cans industry is poised for continued growth, driven by sustained demand for convenient and sustainable packaging. Strategic opportunities exist in expanding into emerging markets, focusing on sustainable product development, and leveraging technological advancements to enhance efficiency and reduce environmental impact. Companies that successfully adapt to evolving consumer preferences and regulatory frameworks will be best positioned to capture significant market share in the years to come.
Beer Cans Industry Segmentation
-
1. Product Type
- 1.1. Aluminum Can
- 1.2. Steel/Tin Can
Beer Cans Industry Segmentation By Geography
-
1. North America
- 1.1. United States
- 1.2. Canada
-
2. Europe
- 2.1. Germany
- 2.2. France
- 2.3. United Kingdom
- 2.4. Spain
- 2.5. Rest of Europe
-
3. Asia Pacific
- 3.1. China
- 3.2. Japan
- 3.3. India
- 3.4. Australia
- 3.5. Rest of Asia Pacific
-
4. Latin America
- 4.1. Brazil
- 4.2. Rest of Latin America
- 5. Middle East
Beer Cans Industry REPORT HIGHLIGHTS
| Aspects | Details |
|---|---|
| Study Period | 2019-2033 |
| Base Year | 2024 |
| Estimated Year | 2025 |
| Forecast Period | 2025-2033 |
| Historical Period | 2019-2024 |
| Growth Rate | CAGR of 3.50% from 2019-2033 |
| Segmentation |
|
Table of Contents
- 1. Introduction
- 1.1. Research Scope
- 1.2. Market Segmentation
- 1.3. Research Methodology
- 1.4. Definitions and Assumptions
- 2. Executive Summary
- 2.1. Introduction
- 3. Market Dynamics
- 3.1. Introduction
- 3.2. Market Drivers
- 3.2.1. Growing Consumption of Craft Beer Across Various Regions; Recreational and Environmental Benefits
- 3.3. Market Restrains
- 3.3.1. Changing Consumer Preferences
- 3.4. Market Trends
- 3.4.1. Aluminium is Expected to Hold the Largest Market Share
- 4. Market Factor Analysis
- 4.1. Porters Five Forces
- 4.2. Supply/Value Chain
- 4.3. PESTEL analysis
- 4.4. Market Entropy
- 4.5. Patent/Trademark Analysis
- 5. Global Beer Cans Industry Analysis, Insights and Forecast, 2019-2031
- 5.1. Market Analysis, Insights and Forecast - by Product Type
- 5.1.1. Aluminum Can
- 5.1.2. Steel/Tin Can
- 5.2. Market Analysis, Insights and Forecast - by Region
- 5.2.1. North America
- 5.2.2. Europe
- 5.2.3. Asia Pacific
- 5.2.4. Latin America
- 5.2.5. Middle East
- 5.1. Market Analysis, Insights and Forecast - by Product Type
- 6. North America Beer Cans Industry Analysis, Insights and Forecast, 2019-2031
- 6.1. Market Analysis, Insights and Forecast - by Product Type
- 6.1.1. Aluminum Can
- 6.1.2. Steel/Tin Can
- 6.1. Market Analysis, Insights and Forecast - by Product Type
- 7. Europe Beer Cans Industry Analysis, Insights and Forecast, 2019-2031
- 7.1. Market Analysis, Insights and Forecast - by Product Type
- 7.1.1. Aluminum Can
- 7.1.2. Steel/Tin Can
- 7.1. Market Analysis, Insights and Forecast - by Product Type
- 8. Asia Pacific Beer Cans Industry Analysis, Insights and Forecast, 2019-2031
- 8.1. Market Analysis, Insights and Forecast - by Product Type
- 8.1.1. Aluminum Can
- 8.1.2. Steel/Tin Can
- 8.1. Market Analysis, Insights and Forecast - by Product Type
- 9. Latin America Beer Cans Industry Analysis, Insights and Forecast, 2019-2031
- 9.1. Market Analysis, Insights and Forecast - by Product Type
- 9.1.1. Aluminum Can
- 9.1.2. Steel/Tin Can
- 9.1. Market Analysis, Insights and Forecast - by Product Type
- 10. Middle East Beer Cans Industry Analysis, Insights and Forecast, 2019-2031
- 10.1. Market Analysis, Insights and Forecast - by Product Type
- 10.1.1. Aluminum Can
- 10.1.2. Steel/Tin Can
- 10.1. Market Analysis, Insights and Forecast - by Product Type
- 11. North America Beer Cans Industry Analysis, Insights and Forecast, 2019-2031
- 11.1. Market Analysis, Insights and Forecast - By Country/Sub-region
- 11.1.1 United States
- 11.1.2 Canada
- 12. Europe Beer Cans Industry Analysis, Insights and Forecast, 2019-2031
- 12.1. Market Analysis, Insights and Forecast - By Country/Sub-region
- 12.1.1 Germany
- 12.1.2 France
- 12.1.3 United Kingdom
- 12.1.4 Spain
- 12.1.5 Rest of Europe
- 13. Asia Pacific Beer Cans Industry Analysis, Insights and Forecast, 2019-2031
- 13.1. Market Analysis, Insights and Forecast - By Country/Sub-region
- 13.1.1 China
- 13.1.2 Japan
- 13.1.3 India
- 13.1.4 Australia
- 13.1.5 Rest of Asia Pacific
- 14. Latin America Beer Cans Industry Analysis, Insights and Forecast, 2019-2031
- 14.1. Market Analysis, Insights and Forecast - By Country/Sub-region
- 14.1.1 Brazil
- 14.1.2 Rest of Latin America
- 15. Middle East Beer Cans Industry Analysis, Insights and Forecast, 2019-2031
- 15.1. Market Analysis, Insights and Forecast - By Country/Sub-region
- 15.1.1.
- 16. Competitive Analysis
- 16.1. Global Market Share Analysis 2024
- 16.2. Company Profiles
- 16.2.1 Toyo Seikan KaishaLtd
- 16.2.1.1. Overview
- 16.2.1.2. Products
- 16.2.1.3. SWOT Analysis
- 16.2.1.4. Recent Developments
- 16.2.1.5. Financials (Based on Availability)
- 16.2.2 ORG Technology Co Ltd
- 16.2.2.1. Overview
- 16.2.2.2. Products
- 16.2.2.3. SWOT Analysis
- 16.2.2.4. Recent Developments
- 16.2.2.5. Financials (Based on Availability)
- 16.2.3 Ball Corporation
- 16.2.3.1. Overview
- 16.2.3.2. Products
- 16.2.3.3. SWOT Analysis
- 16.2.3.4. Recent Developments
- 16.2.3.5. Financials (Based on Availability)
- 16.2.4 Orora Packaging Australia Pty Ltd*List Not Exhaustive
- 16.2.4.1. Overview
- 16.2.4.2. Products
- 16.2.4.3. SWOT Analysis
- 16.2.4.4. Recent Developments
- 16.2.4.5. Financials (Based on Availability)
- 16.2.5 Crown Holdings Inc
- 16.2.5.1. Overview
- 16.2.5.2. Products
- 16.2.5.3. SWOT Analysis
- 16.2.5.4. Recent Developments
- 16.2.5.5. Financials (Based on Availability)
- 16.2.6 Shenzhen Xin Yuheng Can Co Ltd
- 16.2.6.1. Overview
- 16.2.6.2. Products
- 16.2.6.3. SWOT Analysis
- 16.2.6.4. Recent Developments
- 16.2.6.5. Financials (Based on Availability)
- 16.2.7 Kaufman Container
- 16.2.7.1. Overview
- 16.2.7.2. Products
- 16.2.7.3. SWOT Analysis
- 16.2.7.4. Recent Developments
- 16.2.7.5. Financials (Based on Availability)
- 16.2.8 Daiwa Can Co
- 16.2.8.1. Overview
- 16.2.8.2. Products
- 16.2.8.3. SWOT Analysis
- 16.2.8.4. Recent Developments
- 16.2.8.5. Financials (Based on Availability)
- 16.2.9 Can-Pack S A
- 16.2.9.1. Overview
- 16.2.9.2. Products
- 16.2.9.3. SWOT Analysis
- 16.2.9.4. Recent Developments
- 16.2.9.5. Financials (Based on Availability)
- 16.2.1 Toyo Seikan KaishaLtd
List of Figures
- Figure 1: Global Beer Cans Industry Revenue Breakdown (Million, %) by Region 2024 & 2032
- Figure 2: North America Beer Cans Industry Revenue (Million), by Country 2024 & 2032
- Figure 3: North America Beer Cans Industry Revenue Share (%), by Country 2024 & 2032
- Figure 4: Europe Beer Cans Industry Revenue (Million), by Country 2024 & 2032
- Figure 5: Europe Beer Cans Industry Revenue Share (%), by Country 2024 & 2032
- Figure 6: Asia Pacific Beer Cans Industry Revenue (Million), by Country 2024 & 2032
- Figure 7: Asia Pacific Beer Cans Industry Revenue Share (%), by Country 2024 & 2032
- Figure 8: Latin America Beer Cans Industry Revenue (Million), by Country 2024 & 2032
- Figure 9: Latin America Beer Cans Industry Revenue Share (%), by Country 2024 & 2032
- Figure 10: Middle East Beer Cans Industry Revenue (Million), by Country 2024 & 2032
- Figure 11: Middle East Beer Cans Industry Revenue Share (%), by Country 2024 & 2032
- Figure 12: North America Beer Cans Industry Revenue (Million), by Product Type 2024 & 2032
- Figure 13: North America Beer Cans Industry Revenue Share (%), by Product Type 2024 & 2032
- Figure 14: North America Beer Cans Industry Revenue (Million), by Country 2024 & 2032
- Figure 15: North America Beer Cans Industry Revenue Share (%), by Country 2024 & 2032
- Figure 16: Europe Beer Cans Industry Revenue (Million), by Product Type 2024 & 2032
- Figure 17: Europe Beer Cans Industry Revenue Share (%), by Product Type 2024 & 2032
- Figure 18: Europe Beer Cans Industry Revenue (Million), by Country 2024 & 2032
- Figure 19: Europe Beer Cans Industry Revenue Share (%), by Country 2024 & 2032
- Figure 20: Asia Pacific Beer Cans Industry Revenue (Million), by Product Type 2024 & 2032
- Figure 21: Asia Pacific Beer Cans Industry Revenue Share (%), by Product Type 2024 & 2032
- Figure 22: Asia Pacific Beer Cans Industry Revenue (Million), by Country 2024 & 2032
- Figure 23: Asia Pacific Beer Cans Industry Revenue Share (%), by Country 2024 & 2032
- Figure 24: Latin America Beer Cans Industry Revenue (Million), by Product Type 2024 & 2032
- Figure 25: Latin America Beer Cans Industry Revenue Share (%), by Product Type 2024 & 2032
- Figure 26: Latin America Beer Cans Industry Revenue (Million), by Country 2024 & 2032
- Figure 27: Latin America Beer Cans Industry Revenue Share (%), by Country 2024 & 2032
- Figure 28: Middle East Beer Cans Industry Revenue (Million), by Product Type 2024 & 2032
- Figure 29: Middle East Beer Cans Industry Revenue Share (%), by Product Type 2024 & 2032
- Figure 30: Middle East Beer Cans Industry Revenue (Million), by Country 2024 & 2032
- Figure 31: Middle East Beer Cans Industry Revenue Share (%), by Country 2024 & 2032
List of Tables
- Table 1: Global Beer Cans Industry Revenue Million Forecast, by Region 2019 & 2032
- Table 2: Global Beer Cans Industry Revenue Million Forecast, by Product Type 2019 & 2032
- Table 3: Global Beer Cans Industry Revenue Million Forecast, by Region 2019 & 2032
- Table 4: Global Beer Cans Industry Revenue Million Forecast, by Country 2019 & 2032
- Table 5: United States Beer Cans Industry Revenue (Million) Forecast, by Application 2019 & 2032
- Table 6: Canada Beer Cans Industry Revenue (Million) Forecast, by Application 2019 & 2032
- Table 7: Global Beer Cans Industry Revenue Million Forecast, by Country 2019 & 2032
- Table 8: Germany Beer Cans Industry Revenue (Million) Forecast, by Application 2019 & 2032
- Table 9: France Beer Cans Industry Revenue (Million) Forecast, by Application 2019 & 2032
- Table 10: United Kingdom Beer Cans Industry Revenue (Million) Forecast, by Application 2019 & 2032
- Table 11: Spain Beer Cans Industry Revenue (Million) Forecast, by Application 2019 & 2032
- Table 12: Rest of Europe Beer Cans Industry Revenue (Million) Forecast, by Application 2019 & 2032
- Table 13: Global Beer Cans Industry Revenue Million Forecast, by Country 2019 & 2032
- Table 14: China Beer Cans Industry Revenue (Million) Forecast, by Application 2019 & 2032
- Table 15: Japan Beer Cans Industry Revenue (Million) Forecast, by Application 2019 & 2032
- Table 16: India Beer Cans Industry Revenue (Million) Forecast, by Application 2019 & 2032
- Table 17: Australia Beer Cans Industry Revenue (Million) Forecast, by Application 2019 & 2032
- Table 18: Rest of Asia Pacific Beer Cans Industry Revenue (Million) Forecast, by Application 2019 & 2032
- Table 19: Global Beer Cans Industry Revenue Million Forecast, by Country 2019 & 2032
- Table 20: Brazil Beer Cans Industry Revenue (Million) Forecast, by Application 2019 & 2032
- Table 21: Rest of Latin America Beer Cans Industry Revenue (Million) Forecast, by Application 2019 & 2032
- Table 22: Global Beer Cans Industry Revenue Million Forecast, by Country 2019 & 2032
- Table 23: Beer Cans Industry Revenue (Million) Forecast, by Application 2019 & 2032
- Table 24: Global Beer Cans Industry Revenue Million Forecast, by Product Type 2019 & 2032
- Table 25: Global Beer Cans Industry Revenue Million Forecast, by Country 2019 & 2032
- Table 26: United States Beer Cans Industry Revenue (Million) Forecast, by Application 2019 & 2032
- Table 27: Canada Beer Cans Industry Revenue (Million) Forecast, by Application 2019 & 2032
- Table 28: Global Beer Cans Industry Revenue Million Forecast, by Product Type 2019 & 2032
- Table 29: Global Beer Cans Industry Revenue Million Forecast, by Country 2019 & 2032
- Table 30: Germany Beer Cans Industry Revenue (Million) Forecast, by Application 2019 & 2032
- Table 31: France Beer Cans Industry Revenue (Million) Forecast, by Application 2019 & 2032
- Table 32: United Kingdom Beer Cans Industry Revenue (Million) Forecast, by Application 2019 & 2032
- Table 33: Spain Beer Cans Industry Revenue (Million) Forecast, by Application 2019 & 2032
- Table 34: Rest of Europe Beer Cans Industry Revenue (Million) Forecast, by Application 2019 & 2032
- Table 35: Global Beer Cans Industry Revenue Million Forecast, by Product Type 2019 & 2032
- Table 36: Global Beer Cans Industry Revenue Million Forecast, by Country 2019 & 2032
- Table 37: China Beer Cans Industry Revenue (Million) Forecast, by Application 2019 & 2032
- Table 38: Japan Beer Cans Industry Revenue (Million) Forecast, by Application 2019 & 2032
- Table 39: India Beer Cans Industry Revenue (Million) Forecast, by Application 2019 & 2032
- Table 40: Australia Beer Cans Industry Revenue (Million) Forecast, by Application 2019 & 2032
- Table 41: Rest of Asia Pacific Beer Cans Industry Revenue (Million) Forecast, by Application 2019 & 2032
- Table 42: Global Beer Cans Industry Revenue Million Forecast, by Product Type 2019 & 2032
- Table 43: Global Beer Cans Industry Revenue Million Forecast, by Country 2019 & 2032
- Table 44: Brazil Beer Cans Industry Revenue (Million) Forecast, by Application 2019 & 2032
- Table 45: Rest of Latin America Beer Cans Industry Revenue (Million) Forecast, by Application 2019 & 2032
- Table 46: Global Beer Cans Industry Revenue Million Forecast, by Product Type 2019 & 2032
- Table 47: Global Beer Cans Industry Revenue Million Forecast, by Country 2019 & 2032
Frequently Asked Questions
1. What is the projected Compound Annual Growth Rate (CAGR) of the Beer Cans Industry?
The projected CAGR is approximately 3.50%.
2. Which companies are prominent players in the Beer Cans Industry?
Key companies in the market include Toyo Seikan KaishaLtd, ORG Technology Co Ltd, Ball Corporation, Orora Packaging Australia Pty Ltd*List Not Exhaustive, Crown Holdings Inc, Shenzhen Xin Yuheng Can Co Ltd, Kaufman Container, Daiwa Can Co, Can-Pack S A.
3. What are the main segments of the Beer Cans Industry?
The market segments include Product Type.
4. Can you provide details about the market size?
The market size is estimated to be USD XX Million as of 2022.
5. What are some drivers contributing to market growth?
Growing Consumption of Craft Beer Across Various Regions; Recreational and Environmental Benefits.
6. What are the notable trends driving market growth?
Aluminium is Expected to Hold the Largest Market Share.
7. Are there any restraints impacting market growth?
Changing Consumer Preferences.
8. Can you provide examples of recent developments in the market?
October 2022 - Ball Corporation announced the portfolio expansion of its infinitely recyclable ball aluminum cup with the launch of two new, smaller sizes (9-ounce and 12-ounce cup sizes). The Ball Aluminum Cup available for food service customers is now composed of 90% recycled content, making it the cup with the highest recycled content rate of any beverage packaging in its category.
9. What pricing options are available for accessing the report?
Pricing options include single-user, multi-user, and enterprise licenses priced at USD 4750, USD 5250, and USD 8750 respectively.
10. Is the market size provided in terms of value or volume?
The market size is provided in terms of value, measured in Million.
11. Are there any specific market keywords associated with the report?
Yes, the market keyword associated with the report is "Beer Cans Industry," which aids in identifying and referencing the specific market segment covered.
12. How do I determine which pricing option suits my needs best?
The pricing options vary based on user requirements and access needs. Individual users may opt for single-user licenses, while businesses requiring broader access may choose multi-user or enterprise licenses for cost-effective access to the report.
13. Are there any additional resources or data provided in the Beer Cans Industry report?
While the report offers comprehensive insights, it's advisable to review the specific contents or supplementary materials provided to ascertain if additional resources or data are available.
14. How can I stay updated on further developments or reports in the Beer Cans Industry?
To stay informed about further developments, trends, and reports in the Beer Cans Industry, consider subscribing to industry newsletters, following relevant companies and organizations, or regularly checking reputable industry news sources and publications.
Methodology
Step 1 - Identification of Relevant Samples Size from Population Database


Step 2 - Approaches for Defining Global Market Size (Value, Volume* & Price*)

Note*: In applicable scenarios
Step 3 - Data Sources
Primary Research
- Web Analytics
- Survey Reports
- Research Institute
- Latest Research Reports
- Opinion Leaders
Secondary Research
- Annual Reports
- White Paper
- Latest Press Release
- Industry Association
- Paid Database
- Investor Presentations

Step 4 - Data Triangulation
Involves using different sources of information in order to increase the validity of a study
These sources are likely to be stakeholders in a program - participants, other researchers, program staff, other community members, and so on.
Then we put all data in single framework & apply various statistical tools to find out the dynamic on the market.
During the analysis stage, feedback from the stakeholder groups would be compared to determine areas of agreement as well as areas of divergence


