

Key Insights
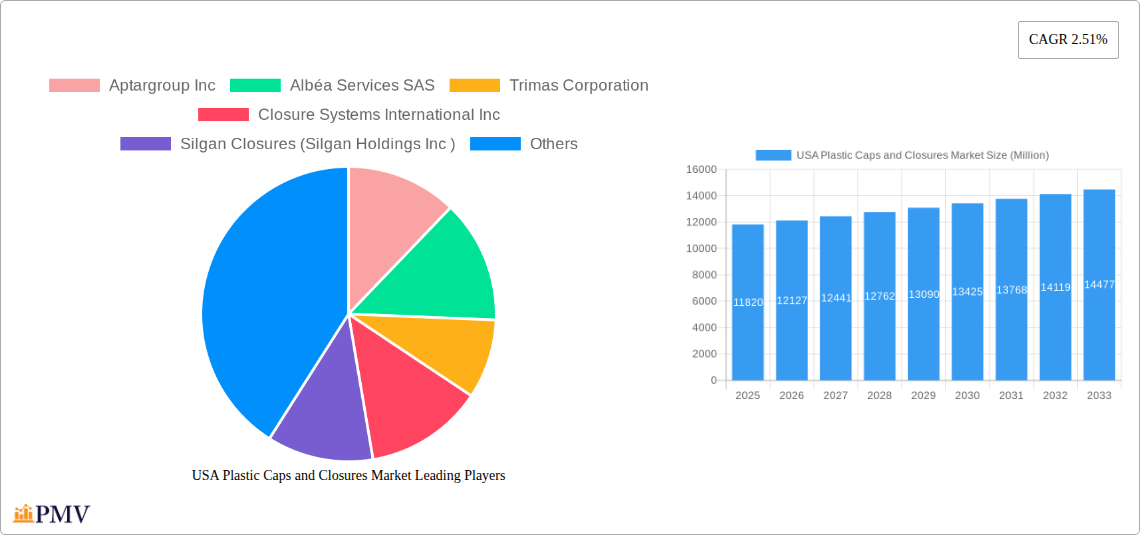
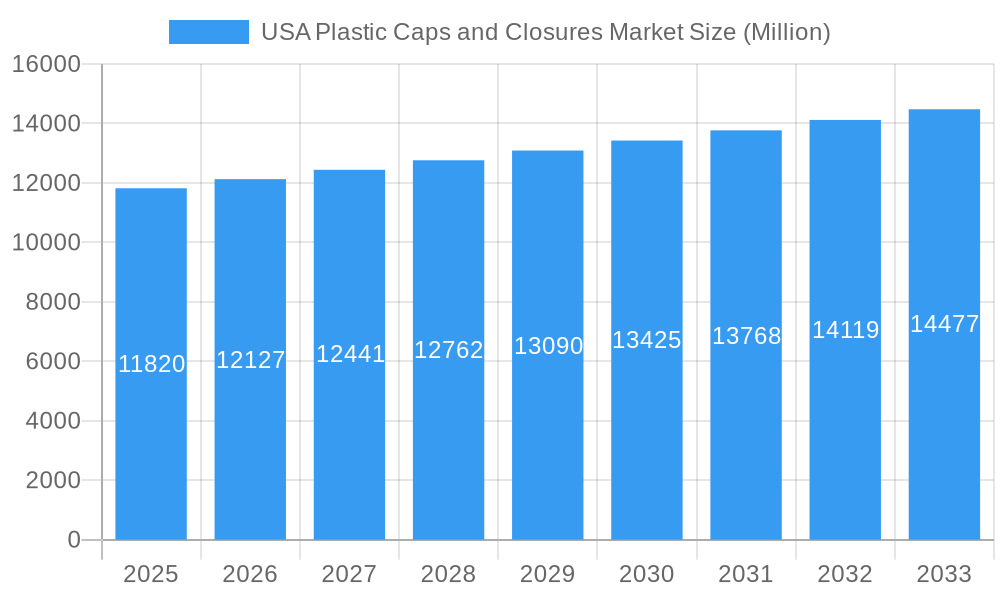
The US plastic caps and closures market, valued at $11.82 billion in 2025, is projected to experience steady growth, driven by the robust packaging needs of the food, beverage, pharmaceutical, and cosmetic industries. A Compound Annual Growth Rate (CAGR) of 2.51% from 2025 to 2033 suggests a continued, albeit moderate, expansion. This growth is fueled by several factors, including increasing consumer demand for convenience packaging, the rising popularity of single-serve products, and advancements in plastic material technology leading to lighter, more sustainable closures. The market is segmented by raw material (polyethylene (PE), PET, polypropylene (PP), and others), type (threaded, dispensing, unthreaded, child-resistant), and application. While polyethylene remains dominant due to its cost-effectiveness and versatility, the demand for sustainable and recyclable alternatives, like PET and PP, is steadily growing, contributing to a shift in market dynamics. Regional variations within the US market, with potentially higher growth in regions experiencing population growth and increased industrial activity, are also expected. Key players like Aptargroup Inc., Albéa Services SAS, and Silgan Closures are vying for market share through innovation and strategic partnerships.
USA Plastic Caps and Closures Market Market Size (In Billion)
Competitive pressures and evolving consumer preferences pose challenges to market growth. Concerns surrounding plastic waste and environmental sustainability are driving increased demand for eco-friendly alternatives, potentially impacting the overall market trajectory. Regulatory changes related to plastic packaging are also influencing manufacturers to adopt more sustainable practices. The market's growth will depend on the successful navigation of these environmental concerns and the adoption of innovative, sustainable closure solutions. Further, fluctuations in raw material prices can significantly impact profitability, requiring manufacturers to implement effective cost management strategies. Despite these challenges, the long-term outlook remains positive, driven by the fundamental need for effective and reliable closures across various industries.
USA Plastic Caps and Closures Market Company Market Share
USA Plastic Caps and Closures Market: A Comprehensive Report (2019-2033)
This in-depth report provides a comprehensive analysis of the USA Plastic Caps and Closures Market, offering invaluable insights for industry stakeholders, investors, and strategic decision-makers. Covering the period from 2019 to 2033, with a focus on 2025, this report meticulously examines market segmentation, competitive dynamics, growth drivers, and future outlook. The report's detailed analysis includes market sizing, growth projections, and key trends impacting this dynamic sector.
USA Plastic Caps and Closures Market Market Structure & Competitive Dynamics
The USA plastic caps and closures market is characterized by a moderately concentrated structure, with several major players holding significant market share. While precise market share figures for individual companies are proprietary data, key players like Aptargroup Inc, Albéa Services SAS, Trimas Corporation, Closure Systems International Inc, Silgan Closures (Silgan Holdings Inc), O Berk Company LLC, Bericap Holding, Guala Closures Group (Guala Pack SPA), Tetra Pak International SA, Berry Global Inc, MJS Packaging, and Amcor Ltd contribute significantly to the overall market volume. The market exhibits a dynamic innovation ecosystem, with companies continuously investing in research and development to enhance product performance, sustainability, and manufacturing efficiency. Regulatory frameworks, such as those related to food safety and environmental regulations, significantly influence market dynamics. Product substitutes, such as alternative closure materials and packaging solutions, present competitive challenges. End-user trends, particularly toward sustainability and convenience, are shaping product development and market demand. The market has witnessed several mergers and acquisitions (M&A) in recent years, with deal values ranging from xx Million to xx Million, primarily driven by strategic expansion and consolidation efforts. These activities have reshaped the competitive landscape, impacting market share and pricing strategies. The increasing focus on sustainable packaging solutions is driving innovation and M&A activities, with a noticeable shift toward recyclable and eco-friendly materials.
USA Plastic Caps and Closures Market Industry Trends & Insights
The USA plastic caps and closures market exhibits robust growth, projected to achieve a Compound Annual Growth Rate (CAGR) of xx% during the forecast period (2025-2033). Several factors contribute to this growth. The burgeoning food and beverage industry, coupled with rising consumer demand for convenient packaging, fuels significant demand for plastic closures. The pharmaceutical and healthcare sectors also contribute substantially, with stringent regulations driving demand for tamper-evident and child-resistant closures. Technological advancements, such as the development of lightweight and eco-friendly materials, are reshaping the industry. Consumer preferences are shifting towards sustainable packaging options, compelling manufacturers to prioritize recyclable and biodegradable materials. The competitive landscape is dynamic, with established players and new entrants constantly vying for market share through product innovation and strategic partnerships. Market penetration of sustainable materials like PE and PP is increasing, driven by growing environmental concerns and supportive government policies. The rising adoption of e-commerce and online retail further boosts demand for secure and tamper-evident packaging. The market is experiencing significant growth, particularly in the segments of threaded and dispensing closures due to their widespread usage across various applications. The overall market size is estimated at xx Million in 2025, expected to reach xx Million by 2033.
Dominant Markets & Segments in USA Plastic Caps and Closures Market
The USA plastic caps and closures market is dominated by the Polyethylene (PE) segment within the raw material category, driven by its cost-effectiveness, versatility, and recyclability. The threaded closure type holds a significant market share owing to its widespread applications across various end-use industries. In terms of application, the food and beverage sector is the most dominant, followed by the pharmaceutical and healthcare sector.
Key Drivers for Dominant Segments:
- Polyethylene (PE): Cost-effectiveness, recyclability, versatility, and ease of processing.
- Threaded Closures: Ease of use, secure sealing, and wide compatibility with various bottle designs.
- Food & Beverage Application: High consumption of packaged food and beverages.
- Pharmaceutical & Healthcare Application: Stringent safety and regulatory requirements.
The regional dominance within the US market is largely spread across regions with high manufacturing and consumption, with no single region exhibiting overwhelming dominance. However, states with substantial manufacturing and distribution networks likely demonstrate higher market concentration. Economic factors such as consumer spending and industrial activity significantly influence regional market variations. The well-established infrastructure supporting logistics and distribution plays a pivotal role in market dynamics.
USA Plastic Caps and Closures Market Product Innovations
Recent innovations in the USA plastic caps and closures market focus heavily on sustainability and lightweighting. Berry Global's launch of lightweight PE tube closures exemplifies this trend, integrating design improvements, material versatility, and reduced greenhouse gas emissions. This reflects a broader industry shift towards eco-friendly solutions, utilizing recycled content and minimizing environmental impact. These innovations not only improve product performance but also enhance the market competitiveness of companies that embrace these changes.
Report Segmentation & Scope
The report segments the USA plastic caps and closures market across multiple dimensions:
By Raw Material: Polyethylene (PE), Polyethylene Terephthalate (PET), Polypropylene (PP), Other Materials (Polystyrene, PVC, etc.). Growth projections vary across these segments, with PE expected to maintain its leading position due to its cost-effectiveness and recyclability. PET demonstrates steady growth driven by its clarity and barrier properties, particularly in the beverage sector. PP is expected to exhibit moderate growth, driven by its versatile properties and recyclability. The "Other Materials" segment encompasses a range of materials, some with niche applications and limited growth compared to the major resin types.
By Type: Threaded, Dispensing, Unthreaded, Child-resistant. Threaded closures maintain market dominance. Dispensing closures cater to specific market segments and demonstrate moderate growth. Unthreaded closures have niche uses. Child-resistant closures are driven by strict regulations in specific sectors.
By Application: Food, Pharmaceutical and Healthcare, Beverage, Cosmetics and Toiletries, Household Chemicals, Other Applications. Food, beverage, and pharmaceutical/healthcare sectors dominate the market, driven by high consumption and regulatory requirements.
Key Drivers of USA Plastic Caps and Closures Market Growth
Several factors drive growth in the USA plastic caps and closures market:
- Rising consumer demand: Increased consumption of packaged goods across various sectors.
- Technological advancements: Innovation in materials, designs, and manufacturing processes.
- Stringent regulations: Focus on safety, child resistance, and environmental sustainability.
- Growth in end-use industries: Expansion of food and beverage, pharmaceutical, and personal care sectors.
Challenges in the USA Plastic Caps and Closures Market Sector
The USA plastic caps and closures market faces certain challenges:
- Fluctuating raw material prices: Volatility in resin prices impacts profitability.
- Environmental concerns: Growing pressure to reduce plastic waste and adopt sustainable alternatives.
- Intense competition: Established players and new entrants compete fiercely.
- Stringent regulations: Compliance with safety and environmental standards necessitates investment.
Leading Players in the USA Plastic Caps and Closures Market Market
- Aptargroup Inc
- Albéa Services SAS
- Trimas Corporation
- Closure Systems International Inc
- Silgan Closures (Silgan Holdings Inc)
- O Berk Company LLC
- Bericap Holding
- Guala Closures Group (Guala Pack SPA)
- Tetra Pak International SA
- Berry Global Inc
- MJS Packaging
- Amcor Ltd
Key Developments in USA Plastic Caps and Closures Market Sector
- October 2023: Berry Global launched lightweight PE tube closures, focusing on sustainability and design innovation. This launch is expected to boost demand for PE resins.
- May 2023: Closed Loop Partners secured a USD 10 Million investment to promote PE and PP plastic recycling in the US and Canada, fostering a circular economy.
Strategic USA Plastic Caps and Closures Market Market Outlook
The USA plastic caps and closures market presents significant growth opportunities. Continued innovation in sustainable materials, coupled with rising demand from various end-use sectors, promises a positive outlook. Companies focusing on eco-friendly solutions, advanced technologies, and efficient manufacturing processes are well-positioned to capture a larger market share. Strategic partnerships, mergers and acquisitions, and expansion into new markets will play crucial roles in shaping the future of this dynamic sector.
USA Plastic Caps and Closures Market Segmentation
-
1. Raw Material
- 1.1. Polyethylene (PE)
- 1.2. Polyethylene Terephthalate (PET)
- 1.3. Polypropylene (PP)
- 1.4. Other Materials (Polystyrene and PVC)
-
2. Type
- 2.1. Threaded
- 2.2. Dispensing
- 2.3. Unthreaded
- 2.4. Child-resistant
-
3. Application
- 3.1. Food
- 3.2. Pharmaceutical and Healthcare
- 3.3. Beverage
- 3.4. Cosmetics and Toiletries
- 3.5. Household Chemicals
- 3.6. Other Applications
USA Plastic Caps and Closures Market Segmentation By Geography
-
1. North America
- 1.1. United States
- 1.2. Canada
- 1.3. Mexico
-
2. South America
- 2.1. Brazil
- 2.2. Argentina
- 2.3. Rest of South America
-
3. Europe
- 3.1. United Kingdom
- 3.2. Germany
- 3.3. France
- 3.4. Italy
- 3.5. Spain
- 3.6. Russia
- 3.7. Benelux
- 3.8. Nordics
- 3.9. Rest of Europe
-
4. Middle East & Africa
- 4.1. Turkey
- 4.2. Israel
- 4.3. GCC
- 4.4. North Africa
- 4.5. South Africa
- 4.6. Rest of Middle East & Africa
-
5. Asia Pacific
- 5.1. China
- 5.2. India
- 5.3. Japan
- 5.4. South Korea
- 5.5. ASEAN
- 5.6. Oceania
- 5.7. Rest of Asia Pacific
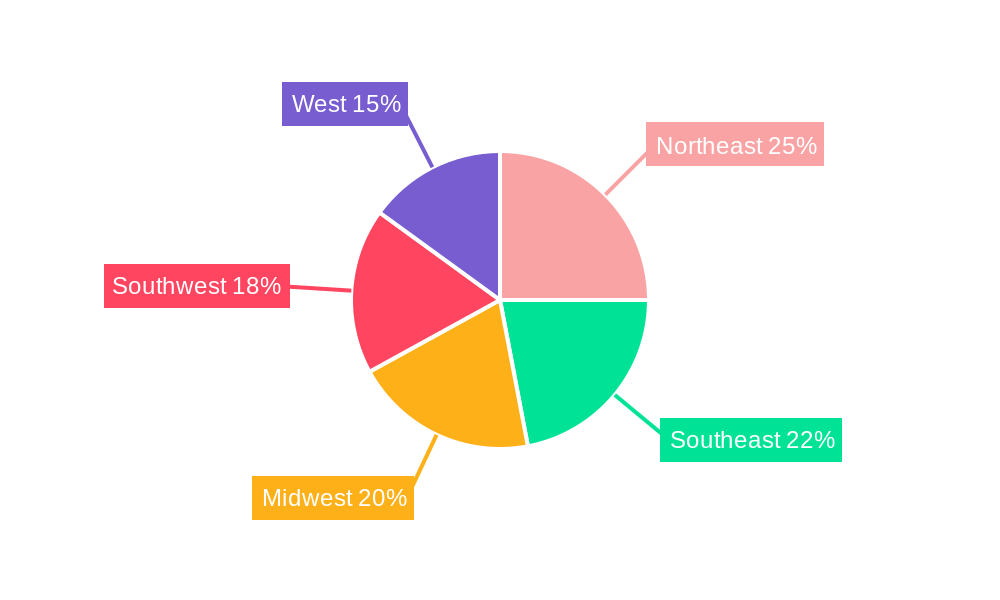
USA Plastic Caps and Closures Market Regional Market Share
Geographic Coverage of USA Plastic Caps and Closures Market
USA Plastic Caps and Closures Market REPORT HIGHLIGHTS
| Aspects | Details |
|---|---|
| Study Period | 2020-2034 |
| Base Year | 2025 |
| Estimated Year | 2026 |
| Forecast Period | 2026-2034 |
| Historical Period | 2020-2025 |
| Growth Rate | CAGR of 2.51% from 2020-2034 |
| Segmentation |
|
Table of Contents
- 1. Introduction
- 1.1. Research Scope
- 1.2. Market Segmentation
- 1.3. Research Objective
- 1.4. Definitions and Assumptions
- 2. Executive Summary
- 2.1. Market Snapshot
- 3. Market Dynamics
- 3.1. Market Drivers
- 3.2. Market Restrains
- 3.3. Market Trends
- 3.4. Market Opportunities
- 4. Market Factor Analysis
- 4.1. Porters Five Forces
- 4.1.1. Bargaining Power of Suppliers
- 4.1.2. Bargaining Power of Buyers
- 4.1.3. Threat of New Entrants
- 4.1.4. Threat of Substitutes
- 4.1.5. Competitive Rivalry
- 4.2. PESTEL analysis
- 4.3. BCG Analysis
- 4.3.1. Stars (High Growth, High Market Share)
- 4.3.2. Cash Cows (Low Growth, High Market Share)
- 4.3.3. Question Mark (High Growth, Low Market Share)
- 4.3.4. Dogs (Low Growth, Low Market Share)
- 4.4. Ansoff Matrix Analysis
- 4.5. Supply Chain Analysis
- 4.6. Regulatory Landscape
- 4.7. Current Market Potential and Opportunity Assessment (TAM–SAM–SOM Framework)
- 4.8. PMV Analyst Note
- 4.1. Porters Five Forces
- 5. Market Analysis, Insights and Forecast 2021-2033
- 5.1. Market Analysis, Insights and Forecast - by Raw Material
- 5.1.1. Polyethylene (PE)
- 5.1.2. Polyethylene Terephthalate (PET)
- 5.1.3. Polypropylene (PP)
- 5.1.4. Other Materials (Polystyrene and PVC)
- 5.2. Market Analysis, Insights and Forecast - by Type
- 5.2.1. Threaded
- 5.2.2. Dispensing
- 5.2.3. Unthreaded
- 5.2.4. Child-resistant
- 5.3. Market Analysis, Insights and Forecast - by Application
- 5.3.1. Food
- 5.3.2. Pharmaceutical and Healthcare
- 5.3.3. Beverage
- 5.3.4. Cosmetics and Toiletries
- 5.3.5. Household Chemicals
- 5.3.6. Other Applications
- 5.4. Market Analysis, Insights and Forecast - by Region
- 5.4.1. North America
- 5.4.2. South America
- 5.4.3. Europe
- 5.4.4. Middle East & Africa
- 5.4.5. Asia Pacific
- 5.1. Market Analysis, Insights and Forecast - by Raw Material
- 6. Global USA Plastic Caps and Closures Market Analysis, Insights and Forecast, 2021-2033
- 6.1. Market Analysis, Insights and Forecast - by Raw Material
- 6.1.1. Polyethylene (PE)
- 6.1.2. Polyethylene Terephthalate (PET)
- 6.1.3. Polypropylene (PP)
- 6.1.4. Other Materials (Polystyrene and PVC)
- 6.2. Market Analysis, Insights and Forecast - by Type
- 6.2.1. Threaded
- 6.2.2. Dispensing
- 6.2.3. Unthreaded
- 6.2.4. Child-resistant
- 6.3. Market Analysis, Insights and Forecast - by Application
- 6.3.1. Food
- 6.3.2. Pharmaceutical and Healthcare
- 6.3.3. Beverage
- 6.3.4. Cosmetics and Toiletries
- 6.3.5. Household Chemicals
- 6.3.6. Other Applications
- 6.1. Market Analysis, Insights and Forecast - by Raw Material
- 7. North America USA Plastic Caps and Closures Market Analysis, Insights and Forecast, 2020-2032
- 7.1. Market Analysis, Insights and Forecast - by Raw Material
- 7.1.1. Polyethylene (PE)
- 7.1.2. Polyethylene Terephthalate (PET)
- 7.1.3. Polypropylene (PP)
- 7.1.4. Other Materials (Polystyrene and PVC)
- 7.2. Market Analysis, Insights and Forecast - by Type
- 7.2.1. Threaded
- 7.2.2. Dispensing
- 7.2.3. Unthreaded
- 7.2.4. Child-resistant
- 7.3. Market Analysis, Insights and Forecast - by Application
- 7.3.1. Food
- 7.3.2. Pharmaceutical and Healthcare
- 7.3.3. Beverage
- 7.3.4. Cosmetics and Toiletries
- 7.3.5. Household Chemicals
- 7.3.6. Other Applications
- 7.1. Market Analysis, Insights and Forecast - by Raw Material
- 8. South America USA Plastic Caps and Closures Market Analysis, Insights and Forecast, 2020-2032
- 8.1. Market Analysis, Insights and Forecast - by Raw Material
- 8.1.1. Polyethylene (PE)
- 8.1.2. Polyethylene Terephthalate (PET)
- 8.1.3. Polypropylene (PP)
- 8.1.4. Other Materials (Polystyrene and PVC)
- 8.2. Market Analysis, Insights and Forecast - by Type
- 8.2.1. Threaded
- 8.2.2. Dispensing
- 8.2.3. Unthreaded
- 8.2.4. Child-resistant
- 8.3. Market Analysis, Insights and Forecast - by Application
- 8.3.1. Food
- 8.3.2. Pharmaceutical and Healthcare
- 8.3.3. Beverage
- 8.3.4. Cosmetics and Toiletries
- 8.3.5. Household Chemicals
- 8.3.6. Other Applications
- 8.1. Market Analysis, Insights and Forecast - by Raw Material
- 9. Europe USA Plastic Caps and Closures Market Analysis, Insights and Forecast, 2020-2032
- 9.1. Market Analysis, Insights and Forecast - by Raw Material
- 9.1.1. Polyethylene (PE)
- 9.1.2. Polyethylene Terephthalate (PET)
- 9.1.3. Polypropylene (PP)
- 9.1.4. Other Materials (Polystyrene and PVC)
- 9.2. Market Analysis, Insights and Forecast - by Type
- 9.2.1. Threaded
- 9.2.2. Dispensing
- 9.2.3. Unthreaded
- 9.2.4. Child-resistant
- 9.3. Market Analysis, Insights and Forecast - by Application
- 9.3.1. Food
- 9.3.2. Pharmaceutical and Healthcare
- 9.3.3. Beverage
- 9.3.4. Cosmetics and Toiletries
- 9.3.5. Household Chemicals
- 9.3.6. Other Applications
- 9.1. Market Analysis, Insights and Forecast - by Raw Material
- 10. Middle East & Africa USA Plastic Caps and Closures Market Analysis, Insights and Forecast, 2020-2032
- 10.1. Market Analysis, Insights and Forecast - by Raw Material
- 10.1.1. Polyethylene (PE)
- 10.1.2. Polyethylene Terephthalate (PET)
- 10.1.3. Polypropylene (PP)
- 10.1.4. Other Materials (Polystyrene and PVC)
- 10.2. Market Analysis, Insights and Forecast - by Type
- 10.2.1. Threaded
- 10.2.2. Dispensing
- 10.2.3. Unthreaded
- 10.2.4. Child-resistant
- 10.3. Market Analysis, Insights and Forecast - by Application
- 10.3.1. Food
- 10.3.2. Pharmaceutical and Healthcare
- 10.3.3. Beverage
- 10.3.4. Cosmetics and Toiletries
- 10.3.5. Household Chemicals
- 10.3.6. Other Applications
- 10.1. Market Analysis, Insights and Forecast - by Raw Material
- 11. Asia Pacific USA Plastic Caps and Closures Market Analysis, Insights and Forecast, 2020-2032
- 11.1. Market Analysis, Insights and Forecast - by Raw Material
- 11.1.1. Polyethylene (PE)
- 11.1.2. Polyethylene Terephthalate (PET)
- 11.1.3. Polypropylene (PP)
- 11.1.4. Other Materials (Polystyrene and PVC)
- 11.2. Market Analysis, Insights and Forecast - by Type
- 11.2.1. Threaded
- 11.2.2. Dispensing
- 11.2.3. Unthreaded
- 11.2.4. Child-resistant
- 11.3. Market Analysis, Insights and Forecast - by Application
- 11.3.1. Food
- 11.3.2. Pharmaceutical and Healthcare
- 11.3.3. Beverage
- 11.3.4. Cosmetics and Toiletries
- 11.3.5. Household Chemicals
- 11.3.6. Other Applications
- 11.1. Market Analysis, Insights and Forecast - by Raw Material
- 12. Competitive Analysis
- 12.1. Company Profiles
- 12.1.1 Aptargroup Inc
- 12.1.1.1. Company Overview
- 12.1.1.2. Products
- 12.1.1.3. Company Financials
- 12.1.1.4. SWOT Analysis
- 12.1.2 Albéa Services SAS
- 12.1.2.1. Company Overview
- 12.1.2.2. Products
- 12.1.2.3. Company Financials
- 12.1.2.4. SWOT Analysis
- 12.1.3 Trimas Corporation
- 12.1.3.1. Company Overview
- 12.1.3.2. Products
- 12.1.3.3. Company Financials
- 12.1.3.4. SWOT Analysis
- 12.1.4 Closure Systems International Inc
- 12.1.4.1. Company Overview
- 12.1.4.2. Products
- 12.1.4.3. Company Financials
- 12.1.4.4. SWOT Analysis
- 12.1.5 Silgan Closures (Silgan Holdings Inc )
- 12.1.5.1. Company Overview
- 12.1.5.2. Products
- 12.1.5.3. Company Financials
- 12.1.5.4. SWOT Analysis
- 12.1.6 O Berk Company LLC
- 12.1.6.1. Company Overview
- 12.1.6.2. Products
- 12.1.6.3. Company Financials
- 12.1.6.4. SWOT Analysis
- 12.1.7 Bericap Holding*List Not Exhaustive
- 12.1.7.1. Company Overview
- 12.1.7.2. Products
- 12.1.7.3. Company Financials
- 12.1.7.4. SWOT Analysis
- 12.1.8 Guala Closures Group (Guala Pack SPA)
- 12.1.8.1. Company Overview
- 12.1.8.2. Products
- 12.1.8.3. Company Financials
- 12.1.8.4. SWOT Analysis
- 12.1.9 Tetra Pak International SA
- 12.1.9.1. Company Overview
- 12.1.9.2. Products
- 12.1.9.3. Company Financials
- 12.1.9.4. SWOT Analysis
- 12.1.10 Berry Global Inc
- 12.1.10.1. Company Overview
- 12.1.10.2. Products
- 12.1.10.3. Company Financials
- 12.1.10.4. SWOT Analysis
- 12.1.11 MJS Packaging
- 12.1.11.1. Company Overview
- 12.1.11.2. Products
- 12.1.11.3. Company Financials
- 12.1.11.4. SWOT Analysis
- 12.1.12 Amcor Ltd
- 12.1.12.1. Company Overview
- 12.1.12.2. Products
- 12.1.12.3. Company Financials
- 12.1.12.4. SWOT Analysis
- 12.1.1 Aptargroup Inc
- 12.2. Market Entropy
- 12.2.1 Company's Key Areas Served
- 12.2.2 Recent Developments
- 12.3. Company Market Share Analysis 2025
- 12.3.1 Top 5 Companies Market Share Analysis
- 12.3.2 Top 3 Companies Market Share Analysis
- 12.4. List of Potential Customers
- 13. Research Methodology
List of Figures
- Figure 1: Global USA Plastic Caps and Closures Market Revenue Breakdown (Million, %) by Region 2025 & 2033
- Figure 2: North America USA Plastic Caps and Closures Market Revenue (Million), by Raw Material 2025 & 2033
- Figure 3: North America USA Plastic Caps and Closures Market Revenue Share (%), by Raw Material 2025 & 2033
- Figure 4: North America USA Plastic Caps and Closures Market Revenue (Million), by Type 2025 & 2033
- Figure 5: North America USA Plastic Caps and Closures Market Revenue Share (%), by Type 2025 & 2033
- Figure 6: North America USA Plastic Caps and Closures Market Revenue (Million), by Application 2025 & 2033
- Figure 7: North America USA Plastic Caps and Closures Market Revenue Share (%), by Application 2025 & 2033
- Figure 8: North America USA Plastic Caps and Closures Market Revenue (Million), by Country 2025 & 2033
- Figure 9: North America USA Plastic Caps and Closures Market Revenue Share (%), by Country 2025 & 2033
- Figure 10: South America USA Plastic Caps and Closures Market Revenue (Million), by Raw Material 2025 & 2033
- Figure 11: South America USA Plastic Caps and Closures Market Revenue Share (%), by Raw Material 2025 & 2033
- Figure 12: South America USA Plastic Caps and Closures Market Revenue (Million), by Type 2025 & 2033
- Figure 13: South America USA Plastic Caps and Closures Market Revenue Share (%), by Type 2025 & 2033
- Figure 14: South America USA Plastic Caps and Closures Market Revenue (Million), by Application 2025 & 2033
- Figure 15: South America USA Plastic Caps and Closures Market Revenue Share (%), by Application 2025 & 2033
- Figure 16: South America USA Plastic Caps and Closures Market Revenue (Million), by Country 2025 & 2033
- Figure 17: South America USA Plastic Caps and Closures Market Revenue Share (%), by Country 2025 & 2033
- Figure 18: Europe USA Plastic Caps and Closures Market Revenue (Million), by Raw Material 2025 & 2033
- Figure 19: Europe USA Plastic Caps and Closures Market Revenue Share (%), by Raw Material 2025 & 2033
- Figure 20: Europe USA Plastic Caps and Closures Market Revenue (Million), by Type 2025 & 2033
- Figure 21: Europe USA Plastic Caps and Closures Market Revenue Share (%), by Type 2025 & 2033
- Figure 22: Europe USA Plastic Caps and Closures Market Revenue (Million), by Application 2025 & 2033
- Figure 23: Europe USA Plastic Caps and Closures Market Revenue Share (%), by Application 2025 & 2033
- Figure 24: Europe USA Plastic Caps and Closures Market Revenue (Million), by Country 2025 & 2033
- Figure 25: Europe USA Plastic Caps and Closures Market Revenue Share (%), by Country 2025 & 2033
- Figure 26: Middle East & Africa USA Plastic Caps and Closures Market Revenue (Million), by Raw Material 2025 & 2033
- Figure 27: Middle East & Africa USA Plastic Caps and Closures Market Revenue Share (%), by Raw Material 2025 & 2033
- Figure 28: Middle East & Africa USA Plastic Caps and Closures Market Revenue (Million), by Type 2025 & 2033
- Figure 29: Middle East & Africa USA Plastic Caps and Closures Market Revenue Share (%), by Type 2025 & 2033
- Figure 30: Middle East & Africa USA Plastic Caps and Closures Market Revenue (Million), by Application 2025 & 2033
- Figure 31: Middle East & Africa USA Plastic Caps and Closures Market Revenue Share (%), by Application 2025 & 2033
- Figure 32: Middle East & Africa USA Plastic Caps and Closures Market Revenue (Million), by Country 2025 & 2033
- Figure 33: Middle East & Africa USA Plastic Caps and Closures Market Revenue Share (%), by Country 2025 & 2033
- Figure 34: Asia Pacific USA Plastic Caps and Closures Market Revenue (Million), by Raw Material 2025 & 2033
- Figure 35: Asia Pacific USA Plastic Caps and Closures Market Revenue Share (%), by Raw Material 2025 & 2033
- Figure 36: Asia Pacific USA Plastic Caps and Closures Market Revenue (Million), by Type 2025 & 2033
- Figure 37: Asia Pacific USA Plastic Caps and Closures Market Revenue Share (%), by Type 2025 & 2033
- Figure 38: Asia Pacific USA Plastic Caps and Closures Market Revenue (Million), by Application 2025 & 2033
- Figure 39: Asia Pacific USA Plastic Caps and Closures Market Revenue Share (%), by Application 2025 & 2033
- Figure 40: Asia Pacific USA Plastic Caps and Closures Market Revenue (Million), by Country 2025 & 2033
- Figure 41: Asia Pacific USA Plastic Caps and Closures Market Revenue Share (%), by Country 2025 & 2033
List of Tables
- Table 1: Global USA Plastic Caps and Closures Market Revenue Million Forecast, by Raw Material 2020 & 2033
- Table 2: Global USA Plastic Caps and Closures Market Revenue Million Forecast, by Type 2020 & 2033
- Table 3: Global USA Plastic Caps and Closures Market Revenue Million Forecast, by Application 2020 & 2033
- Table 4: Global USA Plastic Caps and Closures Market Revenue Million Forecast, by Region 2020 & 2033
- Table 5: Global USA Plastic Caps and Closures Market Revenue Million Forecast, by Raw Material 2020 & 2033
- Table 6: Global USA Plastic Caps and Closures Market Revenue Million Forecast, by Type 2020 & 2033
- Table 7: Global USA Plastic Caps and Closures Market Revenue Million Forecast, by Application 2020 & 2033
- Table 8: Global USA Plastic Caps and Closures Market Revenue Million Forecast, by Country 2020 & 2033
- Table 9: United States USA Plastic Caps and Closures Market Revenue (Million) Forecast, by Application 2020 & 2033
- Table 10: Canada USA Plastic Caps and Closures Market Revenue (Million) Forecast, by Application 2020 & 2033
- Table 11: Mexico USA Plastic Caps and Closures Market Revenue (Million) Forecast, by Application 2020 & 2033
- Table 12: Global USA Plastic Caps and Closures Market Revenue Million Forecast, by Raw Material 2020 & 2033
- Table 13: Global USA Plastic Caps and Closures Market Revenue Million Forecast, by Type 2020 & 2033
- Table 14: Global USA Plastic Caps and Closures Market Revenue Million Forecast, by Application 2020 & 2033
- Table 15: Global USA Plastic Caps and Closures Market Revenue Million Forecast, by Country 2020 & 2033
- Table 16: Brazil USA Plastic Caps and Closures Market Revenue (Million) Forecast, by Application 2020 & 2033
- Table 17: Argentina USA Plastic Caps and Closures Market Revenue (Million) Forecast, by Application 2020 & 2033
- Table 18: Rest of South America USA Plastic Caps and Closures Market Revenue (Million) Forecast, by Application 2020 & 2033
- Table 19: Global USA Plastic Caps and Closures Market Revenue Million Forecast, by Raw Material 2020 & 2033
- Table 20: Global USA Plastic Caps and Closures Market Revenue Million Forecast, by Type 2020 & 2033
- Table 21: Global USA Plastic Caps and Closures Market Revenue Million Forecast, by Application 2020 & 2033
- Table 22: Global USA Plastic Caps and Closures Market Revenue Million Forecast, by Country 2020 & 2033
- Table 23: United Kingdom USA Plastic Caps and Closures Market Revenue (Million) Forecast, by Application 2020 & 2033
- Table 24: Germany USA Plastic Caps and Closures Market Revenue (Million) Forecast, by Application 2020 & 2033
- Table 25: France USA Plastic Caps and Closures Market Revenue (Million) Forecast, by Application 2020 & 2033
- Table 26: Italy USA Plastic Caps and Closures Market Revenue (Million) Forecast, by Application 2020 & 2033
- Table 27: Spain USA Plastic Caps and Closures Market Revenue (Million) Forecast, by Application 2020 & 2033
- Table 28: Russia USA Plastic Caps and Closures Market Revenue (Million) Forecast, by Application 2020 & 2033
- Table 29: Benelux USA Plastic Caps and Closures Market Revenue (Million) Forecast, by Application 2020 & 2033
- Table 30: Nordics USA Plastic Caps and Closures Market Revenue (Million) Forecast, by Application 2020 & 2033
- Table 31: Rest of Europe USA Plastic Caps and Closures Market Revenue (Million) Forecast, by Application 2020 & 2033
- Table 32: Global USA Plastic Caps and Closures Market Revenue Million Forecast, by Raw Material 2020 & 2033
- Table 33: Global USA Plastic Caps and Closures Market Revenue Million Forecast, by Type 2020 & 2033
- Table 34: Global USA Plastic Caps and Closures Market Revenue Million Forecast, by Application 2020 & 2033
- Table 35: Global USA Plastic Caps and Closures Market Revenue Million Forecast, by Country 2020 & 2033
- Table 36: Turkey USA Plastic Caps and Closures Market Revenue (Million) Forecast, by Application 2020 & 2033
- Table 37: Israel USA Plastic Caps and Closures Market Revenue (Million) Forecast, by Application 2020 & 2033
- Table 38: GCC USA Plastic Caps and Closures Market Revenue (Million) Forecast, by Application 2020 & 2033
- Table 39: North Africa USA Plastic Caps and Closures Market Revenue (Million) Forecast, by Application 2020 & 2033
- Table 40: South Africa USA Plastic Caps and Closures Market Revenue (Million) Forecast, by Application 2020 & 2033
- Table 41: Rest of Middle East & Africa USA Plastic Caps and Closures Market Revenue (Million) Forecast, by Application 2020 & 2033
- Table 42: Global USA Plastic Caps and Closures Market Revenue Million Forecast, by Raw Material 2020 & 2033
- Table 43: Global USA Plastic Caps and Closures Market Revenue Million Forecast, by Type 2020 & 2033
- Table 44: Global USA Plastic Caps and Closures Market Revenue Million Forecast, by Application 2020 & 2033
- Table 45: Global USA Plastic Caps and Closures Market Revenue Million Forecast, by Country 2020 & 2033
- Table 46: China USA Plastic Caps and Closures Market Revenue (Million) Forecast, by Application 2020 & 2033
- Table 47: India USA Plastic Caps and Closures Market Revenue (Million) Forecast, by Application 2020 & 2033
- Table 48: Japan USA Plastic Caps and Closures Market Revenue (Million) Forecast, by Application 2020 & 2033
- Table 49: South Korea USA Plastic Caps and Closures Market Revenue (Million) Forecast, by Application 2020 & 2033
- Table 50: ASEAN USA Plastic Caps and Closures Market Revenue (Million) Forecast, by Application 2020 & 2033
- Table 51: Oceania USA Plastic Caps and Closures Market Revenue (Million) Forecast, by Application 2020 & 2033
- Table 52: Rest of Asia Pacific USA Plastic Caps and Closures Market Revenue (Million) Forecast, by Application 2020 & 2033
Frequently Asked Questions
1. What is the projected Compound Annual Growth Rate (CAGR) of the USA Plastic Caps and Closures Market?
The projected CAGR is approximately 2.51%.
2. Which companies are prominent players in the USA Plastic Caps and Closures Market?
Key companies in the market include Aptargroup Inc, Albéa Services SAS, Trimas Corporation, Closure Systems International Inc, Silgan Closures (Silgan Holdings Inc ), O Berk Company LLC, Bericap Holding*List Not Exhaustive, Guala Closures Group (Guala Pack SPA), Tetra Pak International SA, Berry Global Inc, MJS Packaging, Amcor Ltd.
3. What are the main segments of the USA Plastic Caps and Closures Market?
The market segments include Raw Material, Type, Application.
4. Can you provide details about the market size?
The market size is estimated to be USD 11.82 Million as of 2022.
5. What are some drivers contributing to market growth?
Demand for Packaged Food and Pharmaceutical Drugs; Increasing Demand from Small and Medium-Scale End-user Industries.
6. What are the notable trends driving market growth?
Polyethylene (PE) to be the Fastest Growing Raw Material Segment.
7. Are there any restraints impacting market growth?
Increasing Price Volatility of Raw Materials.
8. Can you provide examples of recent developments in the market?
October 2023: Berry Global launched a solution for lightweight tube closures that integrates cutting-edge design, material versatility, and greenhouse gas reduction. Manufactured from PE, these closures are available in 35 mm and 50 mm diameters, with options for matte or glossy surface finishes and orifice sizes of 3mm or 5mm. Anticipated innovations like this across the market are expected to drive higher demand for Polyethylene (PE) resin across the country in the upcoming years.
9. What pricing options are available for accessing the report?
Pricing options include single-user, multi-user, and enterprise licenses priced at USD 3800, USD 4500, and USD 5800 respectively.
10. Is the market size provided in terms of value or volume?
The market size is provided in terms of value, measured in Million.
11. Are there any specific market keywords associated with the report?
Yes, the market keyword associated with the report is "USA Plastic Caps and Closures Market," which aids in identifying and referencing the specific market segment covered.
12. How do I determine which pricing option suits my needs best?
The pricing options vary based on user requirements and access needs. Individual users may opt for single-user licenses, while businesses requiring broader access may choose multi-user or enterprise licenses for cost-effective access to the report.
13. Are there any additional resources or data provided in the USA Plastic Caps and Closures Market report?
While the report offers comprehensive insights, it's advisable to review the specific contents or supplementary materials provided to ascertain if additional resources or data are available.
14. How can I stay updated on further developments or reports in the USA Plastic Caps and Closures Market?
To stay informed about further developments, trends, and reports in the USA Plastic Caps and Closures Market, consider subscribing to industry newsletters, following relevant companies and organizations, or regularly checking reputable industry news sources and publications.
Methodology
Step 1 - Identification of Relevant Samples Size from Population Database


Step 2 - Approaches for Defining Global Market Size (Value, Volume* & Price*)

Note*: In applicable scenarios
Step 3 - Data Sources
Primary Research
- Web Analytics
- Survey Reports
- Research Institute
- Latest Research Reports
- Opinion Leaders
Secondary Research
- Annual Reports
- White Paper
- Latest Press Release
- Industry Association
- Paid Database
- Investor Presentations

Step 4 - Data Triangulation
Involves using different sources of information in order to increase the validity of a study
These sources are likely to be stakeholders in a program - participants, other researchers, program staff, other community members, and so on.
Then we put all data in single framework & apply various statistical tools to find out the dynamic on the market.
During the analysis stage, feedback from the stakeholder groups would be compared to determine areas of agreement as well as areas of divergence