Autonomous Underwater Vehicles Market Report 2025: Growth Driven by Government Incentives and Partnerships

Autonomous Underwater Vehicles Market by Production Analysis, by Consumption Analysis, by Import Market Analysis (Value & Volume), by Export Market Analysis (Value & Volume), by Price Trend Analysis, by North America (United States, Canada, Mexico), by South America (Brazil, Argentina, Rest of South America), by Europe (United Kingdom, Germany, France, Italy, Spain, Russia, Benelux, Nordics, Rest of Europe), by Middle East & Africa (Turkey, Israel, GCC, North Africa, South Africa, Rest of Middle East & Africa), by Asia Pacific (China, India, Japan, South Korea, ASEAN, Oceania, Rest of Asia Pacific) Forecast 2025-2033

Jun 26 2025
Base Year: 2024

234 Pages
Main Logo

Autonomous Underwater Vehicles Market Report 2025: Growth Driven by Government Incentives and Partnerships


Home
Industries
Aerospace & Defense
sponsor image
sponsor image
sponsor image
sponsor image

Tailored for you

  • In-depth Analysis Tailored to Specified Regions or Segments
  • Company Profiles Customized to User Preferences
  • Comprehensive Insights Focused on Specific Segments or Regions
  • Customized Evaluation of Competitive Landscape to Meet Your Needs
  • Tailored Customization to Address Other Specific Requirements
Ask for customization


Key Insights

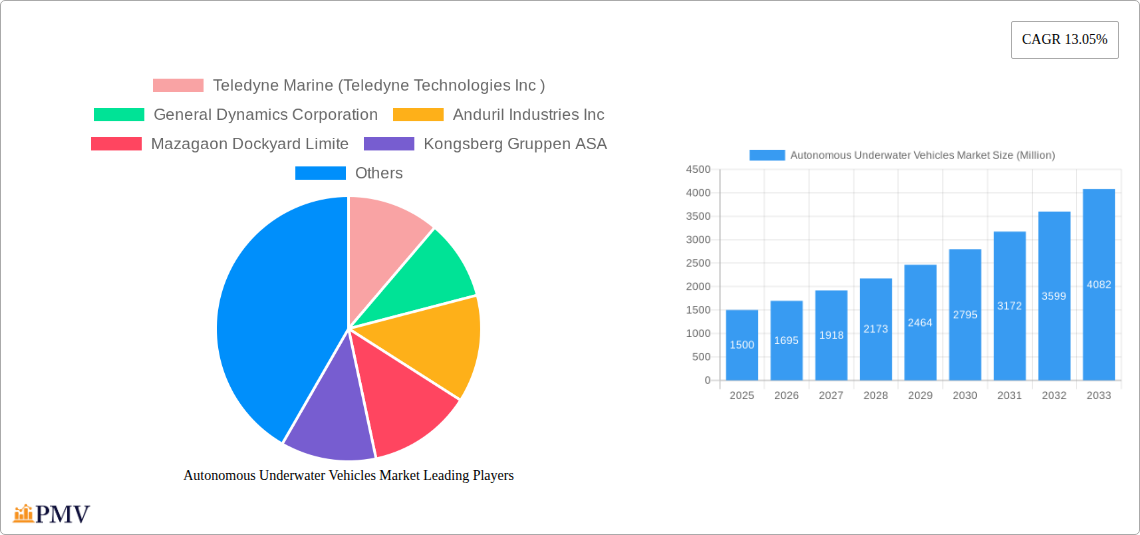
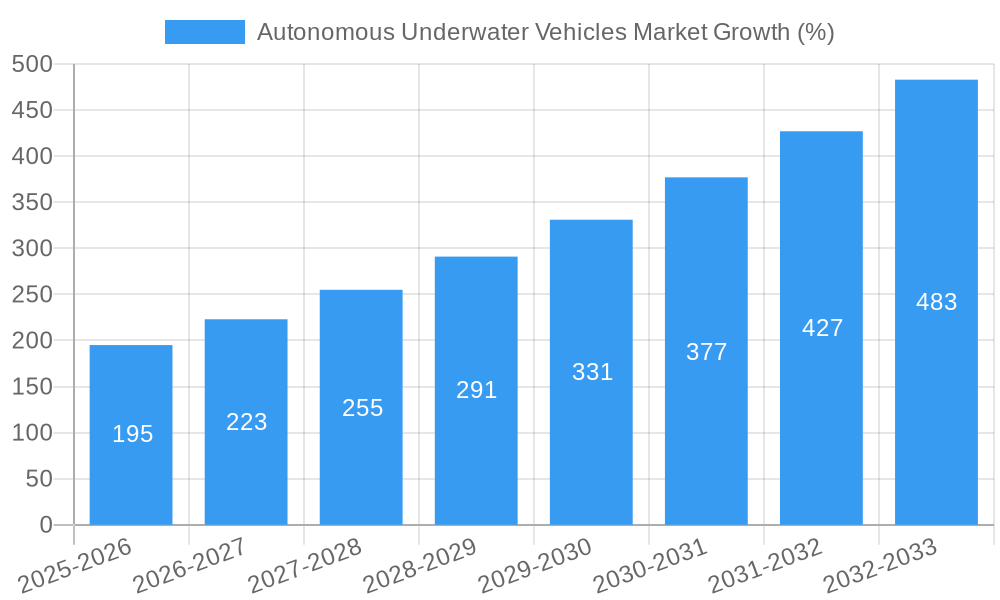
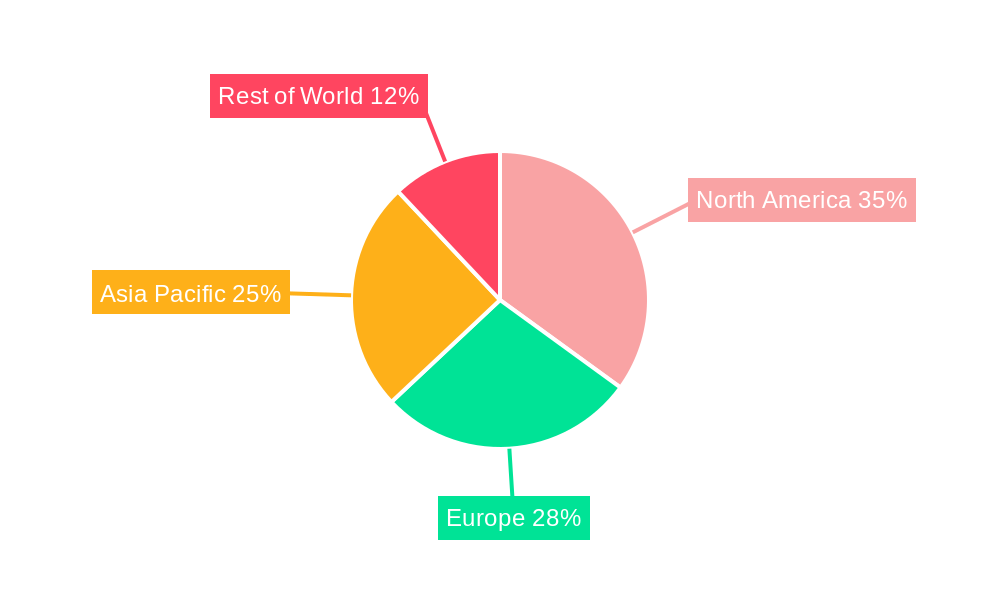
The Autonomous Underwater Vehicles (AUV) market is experiencing robust growth, driven by increasing demand across diverse applications. The market's Compound Annual Growth Rate (CAGR) of 13.05% from 2019 to 2024 indicates a significant expansion, projected to continue into the forecast period (2025-2033). Key drivers include advancements in sensor technology, miniaturization of components, and the rising need for underwater data acquisition in various sectors. Civil applications, such as oceanographic research and offshore infrastructure inspection, are major contributors to market growth. Military applications, encompassing surveillance, mine countermeasures, and anti-submarine warfare, also significantly fuel demand. The propulsion systems market is segmented into electrical, mechanical, and hybrid systems, with electrical systems gaining traction due to their efficiency and quieter operation. Major players like Teledyne Marine, General Dynamics, and Kongsberg Gruppen are driving innovation and market competition. Regional analysis suggests that North America and Asia-Pacific are key markets, fueled by substantial government investment in research and development, as well as strong private sector involvement in offshore energy and marine resource exploration. The market is expected to witness further expansion with the increasing adoption of AUVs in deep-sea exploration and resource mapping.

The restraining factors for the AUV market are primarily centered around high initial investment costs, complex operational requirements and maintenance, and the need for skilled personnel for operation and data analysis. Despite these challenges, ongoing technological advancements and the rising awareness of the economic and strategic benefits of AUV deployments are expected to offset these constraints. The diverse applications and continued technological improvements suggest a bright future for the AUV market, with further market segmentation likely to occur as specialized applications emerge. The increasing integration of Artificial Intelligence and Machine Learning in AUVs is poised to enhance their capabilities and further accelerate market adoption. The development of more robust and reliable AUVs capable of operating in harsher environments and at greater depths is another key focus area for future growth.

Autonomous Underwater Vehicles Market Research Report - Market Size, Growth & Forecast

Autonomous Underwater Vehicles (AUV) Market Report: 2019-2033

This comprehensive report provides a detailed analysis of the Autonomous Underwater Vehicles (AUV) market, offering invaluable insights for industry stakeholders. Covering the period from 2019 to 2033, with 2025 as the base year, this report forecasts market trends and identifies key opportunities within the rapidly evolving AUV landscape. The report includes detailed segmentation analysis, competitive landscape assessment, and key industry developments, providing a complete picture of this dynamic sector. The global AUV market is projected to reach xx Million by 2033, exhibiting a CAGR of xx% during the forecast period (2025-2033).

Autonomous Underwater Vehicles Market Market Structure & Competitive Dynamics

The Autonomous Underwater Vehicles (AUV) market is characterized by a moderately concentrated competitive landscape, with a few major players holding significant market share. However, the market is also witnessing increased participation from smaller, innovative companies, particularly in niche segments like micro-AUVs. The innovation ecosystem is robust, with continuous advancements in sensor technologies, propulsion systems, and AI-powered navigation driving market growth. Regulatory frameworks vary across regions, impacting market access and operations. Product substitutes, such as remotely operated vehicles (ROVs), exist, but AUVs offer superior autonomy and operational efficiency in specific applications. End-user trends show a growing preference for autonomous solutions, particularly in military and oceanographic research, due to cost savings and enhanced operational capabilities. Mergers and acquisitions (M&A) activities are relatively frequent, with larger companies seeking to expand their product portfolios and technological capabilities. Deal values vary significantly, ranging from a few Million USD to several tens of Millions USD. For instance, the UK Royal Navy's contract with Marlin Submarines in December 2022 demonstrates sizable M&A activity.

  • Market Concentration: Moderately concentrated, with significant players holding xx% market share.
  • Innovation Ecosystem: Robust, driven by advancements in sensor technology, AI, and propulsion systems.
  • Regulatory Frameworks: Vary across regions, influencing market access and operational requirements.
  • M&A Activity: Moderate, with deal values ranging from USD xx Million to USD xx Million.

Autonomous Underwater Vehicles Market Industry Trends & Insights

The AUV market is experiencing robust growth, propelled by several key factors. Increased demand for efficient and cost-effective solutions for underwater surveillance, oceanographic research, and offshore operations is a primary driver. Technological advancements, particularly in areas like AI-powered navigation, improved sensor capabilities, and longer endurance batteries are further fueling market expansion. Consumer preferences are shifting towards autonomous systems capable of performing complex tasks with minimal human intervention. The competitive landscape is dynamic, with both established players and new entrants vying for market share. This competition fosters innovation and drives down costs. The market penetration of AUVs is growing rapidly, particularly in military and commercial applications. The market’s CAGR is predicted to be xx% during the forecast period. Emerging applications, such as aquaculture monitoring and underwater infrastructure inspection, represent additional growth opportunities.

Autonomous Underwater Vehicles Market Growth

Dominant Markets & Segments in Autonomous Underwater Vehicles Market

The military segment dominates the AUV market, driven by substantial government funding for defense applications such as mine countermeasures, surveillance, and anti-submarine warfare. This segment is characterized by high-value contracts and stringent technological requirements. The North American and European regions are currently leading in terms of AUV adoption and market size.

  • Military Oceanography:
    • Key Drivers: High government spending on defense, need for improved underwater surveillance and reconnaissance.
    • Dominance Analysis: High demand from major navies globally, coupled with robust R&D investments in AUV technologies.
  • Civil Application:
    • Key Drivers: Growth in offshore oil & gas exploration, rising interest in oceanographic research, and increasing demand for underwater infrastructure inspections.
    • Dominance Analysis: While currently smaller than the military segment, civil applications demonstrate strong potential for future growth.
  • Propulsion System: Electrical propulsion systems are the fastest growing segment due to their high efficiency, low noise levels, and improved maneuverability. Hybrid systems offer a combination of electric and mechanical propulsion, balancing efficiency and power needs.

Autonomous Underwater Vehicles Market Product Innovations

Recent product innovations focus on enhancing AUV autonomy, endurance, and payload capacity. Miniaturization is another key trend, with the development of smaller, more agile AUVs suitable for diverse applications. Improved sensor technologies, incorporating advanced sonar, cameras, and other sensors, are enhancing AUV data acquisition capabilities. These innovations are enhancing market fit by allowing for broader application across military, scientific and commercial operations.

Report Segmentation & Scope

This report segments the AUV market by application (Civil, Military), oceanography (Oceanographic Research, Military Surveillance), and propulsion system (Electrical, Mechanical, Hybrid). Each segment's market size, growth projections, and competitive dynamics are analyzed in detail. Civil applications, for example, are projected to show substantial growth due to increased investment in underwater infrastructure monitoring. The Military segment is predicted to remain dominant, based on continuous demand from global defence budgets. Propulsion system segments show a strong trend towards the adoption of electrical and hybrid systems.

Key Drivers of Autonomous Underwater Vehicles Market Growth

Several factors are driving the growth of the AUV market. Technological advancements in AI, sensor technology, and battery technology are enhancing AUV capabilities and expanding their applications. Increased government funding for defense and scientific research is another significant driver. Furthermore, the growing need for cost-effective solutions for underwater operations in various industries is spurring AUV adoption. The growing need for underwater data acquisition for resource management and climate change studies represents a further impetus to market expansion.

Challenges in the Autonomous Underwater Vehicles Market Sector

The AUV market faces several challenges. High initial investment costs and the complexity of AUV technology can limit adoption, particularly for smaller companies. Supply chain disruptions can impact AUV production and availability. Stringent regulatory environments and safety concerns associated with underwater operations pose further hurdles to widespread AUV deployment. Intense competition also forces companies to continually innovate to remain competitive. These factors can combine to reduce the overall market penetration in certain segments.

Leading Players in the Autonomous Underwater Vehicles Market Market

  • Teledyne Marine (Teledyne Technologies Inc)
  • General Dynamics Corporation
  • Anduril Industries Inc
  • Mazagaon Dockyard Limited
  • Kongsberg Gruppen ASA
  • Lockheed Martin Corporation
  • Exail Technologies
  • Huntington Ingalls Industries Inc
  • The Boeing Company

Key Developments in Autonomous Underwater Vehicles Market Sector

  • July 2023: Launch of the Neerakshi AUV by GRSE Ltd and AEPL in India, showcasing advancements in indigenous AUV development.
  • December 2022: UK Royal Navy awards a USD 18.86 Million contract to Marlin Submarines for AUV manufacturing and supply.
  • November 2022: Exail Technologies secures a USD 3.72 Million contract from the French Defence Procurement Agency for an A18D AUV.
  • June 2022: Jaia Robotics secures funding exceeding USD 1 Million for micro-sized, high-speed AUV development.

Strategic Autonomous Underwater Vehicles Market Market Outlook

The AUV market holds significant future potential, driven by continuous technological advancements and increasing demand across diverse sectors. Strategic opportunities exist for companies focused on developing innovative AUV technologies, expanding into new applications, and establishing strong partnerships. The market is poised for continued growth, particularly in the civil and military sectors, with further development driven by a need for increased oceanographic research and advanced underwater surveillance capabilities. The increasing focus on environmental monitoring and sustainable resource management will further drive demand.

Autonomous Underwater Vehicles Market Segmentation

  • 1. Production Analysis
  • 2. Consumption Analysis
  • 3. Import Market Analysis (Value & Volume)
  • 4. Export Market Analysis (Value & Volume)
  • 5. Price Trend Analysis

Autonomous Underwater Vehicles Market Segmentation By Geography

  • 1. North America
    • 1.1. United States
    • 1.2. Canada
    • 1.3. Mexico
  • 2. South America
    • 2.1. Brazil
    • 2.2. Argentina
    • 2.3. Rest of South America
  • 3. Europe
    • 3.1. United Kingdom
    • 3.2. Germany
    • 3.3. France
    • 3.4. Italy
    • 3.5. Spain
    • 3.6. Russia
    • 3.7. Benelux
    • 3.8. Nordics
    • 3.9. Rest of Europe
  • 4. Middle East & Africa
    • 4.1. Turkey
    • 4.2. Israel
    • 4.3. GCC
    • 4.4. North Africa
    • 4.5. South Africa
    • 4.6. Rest of Middle East & Africa
  • 5. Asia Pacific
    • 5.1. China
    • 5.2. India
    • 5.3. Japan
    • 5.4. South Korea
    • 5.5. ASEAN
    • 5.6. Oceania
    • 5.7. Rest of Asia Pacific
Autonomous Underwater Vehicles Market Regional Share


Autonomous Underwater Vehicles Market REPORT HIGHLIGHTS

AspectsDetails
Study Period 2019-2033
Base Year 2024
Estimated Year 2025
Forecast Period2025-2033
Historical Period2019-2024
Growth RateCAGR of 13.05% from 2019-2033
Segmentation
    • By Production Analysis
    • By Consumption Analysis
    • By Import Market Analysis (Value & Volume)
    • By Export Market Analysis (Value & Volume)
    • By Price Trend Analysis
  • By Geography
    • North America
      • United States
      • Canada
      • Mexico
    • South America
      • Brazil
      • Argentina
      • Rest of South America
    • Europe
      • United Kingdom
      • Germany
      • France
      • Italy
      • Spain
      • Russia
      • Benelux
      • Nordics
      • Rest of Europe
    • Middle East & Africa
      • Turkey
      • Israel
      • GCC
      • North Africa
      • South Africa
      • Rest of Middle East & Africa
    • Asia Pacific
      • China
      • India
      • Japan
      • South Korea
      • ASEAN
      • Oceania
      • Rest of Asia Pacific


Table of Contents

  1. 1. Introduction
    • 1.1. Research Scope
    • 1.2. Market Segmentation
    • 1.3. Research Methodology
    • 1.4. Definitions and Assumptions
  2. 2. Executive Summary
    • 2.1. Introduction
  3. 3. Market Dynamics
    • 3.1. Introduction
      • 3.2. Market Drivers
        • 3.2.1. Increase in Internet of Things (IoT) and Autonomous Systems; Rise in Demand for Military and Defense Satellite Communication Solutions
      • 3.3. Market Restrains
        • 3.3.1. Cybersecurity Threats to Satellite Communication; Interference in Transmission of Data
      • 3.4. Market Trends
        • 3.4.1. Civil Segment is Expected to Experience Substantial Growth During the Forecast Period
  4. 4. Market Factor Analysis
    • 4.1. Porters Five Forces
    • 4.2. Supply/Value Chain
    • 4.3. PESTEL analysis
    • 4.4. Market Entropy
    • 4.5. Patent/Trademark Analysis
  5. 5. Global Autonomous Underwater Vehicles Market Analysis, Insights and Forecast, 2019-2031
    • 5.1. Market Analysis, Insights and Forecast - by Production Analysis
      • 5.2. Market Analysis, Insights and Forecast - by Consumption Analysis
        • 5.3. Market Analysis, Insights and Forecast - by Import Market Analysis (Value & Volume)
          • 5.4. Market Analysis, Insights and Forecast - by Export Market Analysis (Value & Volume)
            • 5.5. Market Analysis, Insights and Forecast - by Price Trend Analysis
              • 5.6. Market Analysis, Insights and Forecast - by Region
                • 5.6.1. North America
                • 5.6.2. South America
                • 5.6.3. Europe
                • 5.6.4. Middle East & Africa
                • 5.6.5. Asia Pacific
            • 6. North America Autonomous Underwater Vehicles Market Analysis, Insights and Forecast, 2019-2031
              • 6.1. Market Analysis, Insights and Forecast - by Production Analysis
                • 6.2. Market Analysis, Insights and Forecast - by Consumption Analysis
                  • 6.3. Market Analysis, Insights and Forecast - by Import Market Analysis (Value & Volume)
                    • 6.4. Market Analysis, Insights and Forecast - by Export Market Analysis (Value & Volume)
                      • 6.5. Market Analysis, Insights and Forecast - by Price Trend Analysis
                      • 7. South America Autonomous Underwater Vehicles Market Analysis, Insights and Forecast, 2019-2031
                        • 7.1. Market Analysis, Insights and Forecast - by Production Analysis
                          • 7.2. Market Analysis, Insights and Forecast - by Consumption Analysis
                            • 7.3. Market Analysis, Insights and Forecast - by Import Market Analysis (Value & Volume)
                              • 7.4. Market Analysis, Insights and Forecast - by Export Market Analysis (Value & Volume)
                                • 7.5. Market Analysis, Insights and Forecast - by Price Trend Analysis
                                • 8. Europe Autonomous Underwater Vehicles Market Analysis, Insights and Forecast, 2019-2031
                                  • 8.1. Market Analysis, Insights and Forecast - by Production Analysis
                                    • 8.2. Market Analysis, Insights and Forecast - by Consumption Analysis
                                      • 8.3. Market Analysis, Insights and Forecast - by Import Market Analysis (Value & Volume)
                                        • 8.4. Market Analysis, Insights and Forecast - by Export Market Analysis (Value & Volume)
                                          • 8.5. Market Analysis, Insights and Forecast - by Price Trend Analysis
                                          • 9. Middle East & Africa Autonomous Underwater Vehicles Market Analysis, Insights and Forecast, 2019-2031
                                            • 9.1. Market Analysis, Insights and Forecast - by Production Analysis
                                              • 9.2. Market Analysis, Insights and Forecast - by Consumption Analysis
                                                • 9.3. Market Analysis, Insights and Forecast - by Import Market Analysis (Value & Volume)
                                                  • 9.4. Market Analysis, Insights and Forecast - by Export Market Analysis (Value & Volume)
                                                    • 9.5. Market Analysis, Insights and Forecast - by Price Trend Analysis
                                                    • 10. Asia Pacific Autonomous Underwater Vehicles Market Analysis, Insights and Forecast, 2019-2031
                                                      • 10.1. Market Analysis, Insights and Forecast - by Production Analysis
                                                        • 10.2. Market Analysis, Insights and Forecast - by Consumption Analysis
                                                          • 10.3. Market Analysis, Insights and Forecast - by Import Market Analysis (Value & Volume)
                                                            • 10.4. Market Analysis, Insights and Forecast - by Export Market Analysis (Value & Volume)
                                                              • 10.5. Market Analysis, Insights and Forecast - by Price Trend Analysis
                                                              • 11. North America Autonomous Underwater Vehicles Market Analysis, Insights and Forecast, 2019-2031
                                                                  • 11.1. Market Analysis, Insights and Forecast - By Country/Sub-region
                                                                    • 11.1.1 United States
                                                                    • 11.1.2 Canada
                                                              • 12. Europe Autonomous Underwater Vehicles Market Analysis, Insights and Forecast, 2019-2031
                                                                  • 12.1. Market Analysis, Insights and Forecast - By Country/Sub-region
                                                                    • 12.1.1 United Kingdom
                                                                    • 12.1.2 Germany
                                                                    • 12.1.3 France
                                                                    • 12.1.4 Rest of Europe
                                                              • 13. Asia Pacific Autonomous Underwater Vehicles Market Analysis, Insights and Forecast, 2019-2031
                                                                  • 13.1. Market Analysis, Insights and Forecast - By Country/Sub-region
                                                                    • 13.1.1 China
                                                                    • 13.1.2 India
                                                                    • 13.1.3 Japan
                                                                    • 13.1.4 South Korea
                                                                    • 13.1.5 Rest of Asia Pacific
                                                              • 14. Rest of the World Autonomous Underwater Vehicles Market Analysis, Insights and Forecast, 2019-2031
                                                                  • 14.1. Market Analysis, Insights and Forecast - By Country/Sub-region
                                                                    • 14.1.1.
                                                              • 15. Competitive Analysis
                                                                • 15.1. Global Market Share Analysis 2024
                                                                  • 15.2. Company Profiles
                                                                    • 15.2.1 Teledyne Marine (Teledyne Technologies Inc )
                                                                      • 15.2.1.1. Overview
                                                                      • 15.2.1.2. Products
                                                                      • 15.2.1.3. SWOT Analysis
                                                                      • 15.2.1.4. Recent Developments
                                                                      • 15.2.1.5. Financials (Based on Availability)
                                                                    • 15.2.2 General Dynamics Corporation
                                                                      • 15.2.2.1. Overview
                                                                      • 15.2.2.2. Products
                                                                      • 15.2.2.3. SWOT Analysis
                                                                      • 15.2.2.4. Recent Developments
                                                                      • 15.2.2.5. Financials (Based on Availability)
                                                                    • 15.2.3 Anduril Industries Inc
                                                                      • 15.2.3.1. Overview
                                                                      • 15.2.3.2. Products
                                                                      • 15.2.3.3. SWOT Analysis
                                                                      • 15.2.3.4. Recent Developments
                                                                      • 15.2.3.5. Financials (Based on Availability)
                                                                    • 15.2.4 Mazagaon Dockyard Limite
                                                                      • 15.2.4.1. Overview
                                                                      • 15.2.4.2. Products
                                                                      • 15.2.4.3. SWOT Analysis
                                                                      • 15.2.4.4. Recent Developments
                                                                      • 15.2.4.5. Financials (Based on Availability)
                                                                    • 15.2.5 Kongsberg Gruppen ASA
                                                                      • 15.2.5.1. Overview
                                                                      • 15.2.5.2. Products
                                                                      • 15.2.5.3. SWOT Analysis
                                                                      • 15.2.5.4. Recent Developments
                                                                      • 15.2.5.5. Financials (Based on Availability)
                                                                    • 15.2.6 Lockheed Martin Corporation
                                                                      • 15.2.6.1. Overview
                                                                      • 15.2.6.2. Products
                                                                      • 15.2.6.3. SWOT Analysis
                                                                      • 15.2.6.4. Recent Developments
                                                                      • 15.2.6.5. Financials (Based on Availability)
                                                                    • 15.2.7 Exail Technologies
                                                                      • 15.2.7.1. Overview
                                                                      • 15.2.7.2. Products
                                                                      • 15.2.7.3. SWOT Analysis
                                                                      • 15.2.7.4. Recent Developments
                                                                      • 15.2.7.5. Financials (Based on Availability)
                                                                    • 15.2.8 Huntington Ingalls Industries Inc
                                                                      • 15.2.8.1. Overview
                                                                      • 15.2.8.2. Products
                                                                      • 15.2.8.3. SWOT Analysis
                                                                      • 15.2.8.4. Recent Developments
                                                                      • 15.2.8.5. Financials (Based on Availability)
                                                                    • 15.2.9 The Boeing Company
                                                                      • 15.2.9.1. Overview
                                                                      • 15.2.9.2. Products
                                                                      • 15.2.9.3. SWOT Analysis
                                                                      • 15.2.9.4. Recent Developments
                                                                      • 15.2.9.5. Financials (Based on Availability)

                                                              List of Figures

                                                              1. Figure 1: Global Autonomous Underwater Vehicles Market Revenue Breakdown (Million, %) by Region 2024 & 2032
                                                              2. Figure 2: North America Autonomous Underwater Vehicles Market Revenue (Million), by Country 2024 & 2032
                                                              3. Figure 3: North America Autonomous Underwater Vehicles Market Revenue Share (%), by Country 2024 & 2032
                                                              4. Figure 4: Europe Autonomous Underwater Vehicles Market Revenue (Million), by Country 2024 & 2032
                                                              5. Figure 5: Europe Autonomous Underwater Vehicles Market Revenue Share (%), by Country 2024 & 2032
                                                              6. Figure 6: Asia Pacific Autonomous Underwater Vehicles Market Revenue (Million), by Country 2024 & 2032
                                                              7. Figure 7: Asia Pacific Autonomous Underwater Vehicles Market Revenue Share (%), by Country 2024 & 2032
                                                              8. Figure 8: Rest of the World Autonomous Underwater Vehicles Market Revenue (Million), by Country 2024 & 2032
                                                              9. Figure 9: Rest of the World Autonomous Underwater Vehicles Market Revenue Share (%), by Country 2024 & 2032
                                                              10. Figure 10: North America Autonomous Underwater Vehicles Market Revenue (Million), by Production Analysis 2024 & 2032
                                                              11. Figure 11: North America Autonomous Underwater Vehicles Market Revenue Share (%), by Production Analysis 2024 & 2032
                                                              12. Figure 12: North America Autonomous Underwater Vehicles Market Revenue (Million), by Consumption Analysis 2024 & 2032
                                                              13. Figure 13: North America Autonomous Underwater Vehicles Market Revenue Share (%), by Consumption Analysis 2024 & 2032
                                                              14. Figure 14: North America Autonomous Underwater Vehicles Market Revenue (Million), by Import Market Analysis (Value & Volume) 2024 & 2032
                                                              15. Figure 15: North America Autonomous Underwater Vehicles Market Revenue Share (%), by Import Market Analysis (Value & Volume) 2024 & 2032
                                                              16. Figure 16: North America Autonomous Underwater Vehicles Market Revenue (Million), by Export Market Analysis (Value & Volume) 2024 & 2032
                                                              17. Figure 17: North America Autonomous Underwater Vehicles Market Revenue Share (%), by Export Market Analysis (Value & Volume) 2024 & 2032
                                                              18. Figure 18: North America Autonomous Underwater Vehicles Market Revenue (Million), by Price Trend Analysis 2024 & 2032
                                                              19. Figure 19: North America Autonomous Underwater Vehicles Market Revenue Share (%), by Price Trend Analysis 2024 & 2032
                                                              20. Figure 20: North America Autonomous Underwater Vehicles Market Revenue (Million), by Country 2024 & 2032
                                                              21. Figure 21: North America Autonomous Underwater Vehicles Market Revenue Share (%), by Country 2024 & 2032
                                                              22. Figure 22: South America Autonomous Underwater Vehicles Market Revenue (Million), by Production Analysis 2024 & 2032
                                                              23. Figure 23: South America Autonomous Underwater Vehicles Market Revenue Share (%), by Production Analysis 2024 & 2032
                                                              24. Figure 24: South America Autonomous Underwater Vehicles Market Revenue (Million), by Consumption Analysis 2024 & 2032
                                                              25. Figure 25: South America Autonomous Underwater Vehicles Market Revenue Share (%), by Consumption Analysis 2024 & 2032
                                                              26. Figure 26: South America Autonomous Underwater Vehicles Market Revenue (Million), by Import Market Analysis (Value & Volume) 2024 & 2032
                                                              27. Figure 27: South America Autonomous Underwater Vehicles Market Revenue Share (%), by Import Market Analysis (Value & Volume) 2024 & 2032
                                                              28. Figure 28: South America Autonomous Underwater Vehicles Market Revenue (Million), by Export Market Analysis (Value & Volume) 2024 & 2032
                                                              29. Figure 29: South America Autonomous Underwater Vehicles Market Revenue Share (%), by Export Market Analysis (Value & Volume) 2024 & 2032
                                                              30. Figure 30: South America Autonomous Underwater Vehicles Market Revenue (Million), by Price Trend Analysis 2024 & 2032
                                                              31. Figure 31: South America Autonomous Underwater Vehicles Market Revenue Share (%), by Price Trend Analysis 2024 & 2032
                                                              32. Figure 32: South America Autonomous Underwater Vehicles Market Revenue (Million), by Country 2024 & 2032
                                                              33. Figure 33: South America Autonomous Underwater Vehicles Market Revenue Share (%), by Country 2024 & 2032
                                                              34. Figure 34: Europe Autonomous Underwater Vehicles Market Revenue (Million), by Production Analysis 2024 & 2032
                                                              35. Figure 35: Europe Autonomous Underwater Vehicles Market Revenue Share (%), by Production Analysis 2024 & 2032
                                                              36. Figure 36: Europe Autonomous Underwater Vehicles Market Revenue (Million), by Consumption Analysis 2024 & 2032
                                                              37. Figure 37: Europe Autonomous Underwater Vehicles Market Revenue Share (%), by Consumption Analysis 2024 & 2032
                                                              38. Figure 38: Europe Autonomous Underwater Vehicles Market Revenue (Million), by Import Market Analysis (Value & Volume) 2024 & 2032
                                                              39. Figure 39: Europe Autonomous Underwater Vehicles Market Revenue Share (%), by Import Market Analysis (Value & Volume) 2024 & 2032
                                                              40. Figure 40: Europe Autonomous Underwater Vehicles Market Revenue (Million), by Export Market Analysis (Value & Volume) 2024 & 2032
                                                              41. Figure 41: Europe Autonomous Underwater Vehicles Market Revenue Share (%), by Export Market Analysis (Value & Volume) 2024 & 2032
                                                              42. Figure 42: Europe Autonomous Underwater Vehicles Market Revenue (Million), by Price Trend Analysis 2024 & 2032
                                                              43. Figure 43: Europe Autonomous Underwater Vehicles Market Revenue Share (%), by Price Trend Analysis 2024 & 2032
                                                              44. Figure 44: Europe Autonomous Underwater Vehicles Market Revenue (Million), by Country 2024 & 2032
                                                              45. Figure 45: Europe Autonomous Underwater Vehicles Market Revenue Share (%), by Country 2024 & 2032
                                                              46. Figure 46: Middle East & Africa Autonomous Underwater Vehicles Market Revenue (Million), by Production Analysis 2024 & 2032
                                                              47. Figure 47: Middle East & Africa Autonomous Underwater Vehicles Market Revenue Share (%), by Production Analysis 2024 & 2032
                                                              48. Figure 48: Middle East & Africa Autonomous Underwater Vehicles Market Revenue (Million), by Consumption Analysis 2024 & 2032
                                                              49. Figure 49: Middle East & Africa Autonomous Underwater Vehicles Market Revenue Share (%), by Consumption Analysis 2024 & 2032
                                                              50. Figure 50: Middle East & Africa Autonomous Underwater Vehicles Market Revenue (Million), by Import Market Analysis (Value & Volume) 2024 & 2032
                                                              51. Figure 51: Middle East & Africa Autonomous Underwater Vehicles Market Revenue Share (%), by Import Market Analysis (Value & Volume) 2024 & 2032
                                                              52. Figure 52: Middle East & Africa Autonomous Underwater Vehicles Market Revenue (Million), by Export Market Analysis (Value & Volume) 2024 & 2032
                                                              53. Figure 53: Middle East & Africa Autonomous Underwater Vehicles Market Revenue Share (%), by Export Market Analysis (Value & Volume) 2024 & 2032
                                                              54. Figure 54: Middle East & Africa Autonomous Underwater Vehicles Market Revenue (Million), by Price Trend Analysis 2024 & 2032
                                                              55. Figure 55: Middle East & Africa Autonomous Underwater Vehicles Market Revenue Share (%), by Price Trend Analysis 2024 & 2032
                                                              56. Figure 56: Middle East & Africa Autonomous Underwater Vehicles Market Revenue (Million), by Country 2024 & 2032
                                                              57. Figure 57: Middle East & Africa Autonomous Underwater Vehicles Market Revenue Share (%), by Country 2024 & 2032
                                                              58. Figure 58: Asia Pacific Autonomous Underwater Vehicles Market Revenue (Million), by Production Analysis 2024 & 2032
                                                              59. Figure 59: Asia Pacific Autonomous Underwater Vehicles Market Revenue Share (%), by Production Analysis 2024 & 2032
                                                              60. Figure 60: Asia Pacific Autonomous Underwater Vehicles Market Revenue (Million), by Consumption Analysis 2024 & 2032
                                                              61. Figure 61: Asia Pacific Autonomous Underwater Vehicles Market Revenue Share (%), by Consumption Analysis 2024 & 2032
                                                              62. Figure 62: Asia Pacific Autonomous Underwater Vehicles Market Revenue (Million), by Import Market Analysis (Value & Volume) 2024 & 2032
                                                              63. Figure 63: Asia Pacific Autonomous Underwater Vehicles Market Revenue Share (%), by Import Market Analysis (Value & Volume) 2024 & 2032
                                                              64. Figure 64: Asia Pacific Autonomous Underwater Vehicles Market Revenue (Million), by Export Market Analysis (Value & Volume) 2024 & 2032
                                                              65. Figure 65: Asia Pacific Autonomous Underwater Vehicles Market Revenue Share (%), by Export Market Analysis (Value & Volume) 2024 & 2032
                                                              66. Figure 66: Asia Pacific Autonomous Underwater Vehicles Market Revenue (Million), by Price Trend Analysis 2024 & 2032
                                                              67. Figure 67: Asia Pacific Autonomous Underwater Vehicles Market Revenue Share (%), by Price Trend Analysis 2024 & 2032
                                                              68. Figure 68: Asia Pacific Autonomous Underwater Vehicles Market Revenue (Million), by Country 2024 & 2032
                                                              69. Figure 69: Asia Pacific Autonomous Underwater Vehicles Market Revenue Share (%), by Country 2024 & 2032

                                                              List of Tables

                                                              1. Table 1: Global Autonomous Underwater Vehicles Market Revenue Million Forecast, by Region 2019 & 2032
                                                              2. Table 2: Global Autonomous Underwater Vehicles Market Revenue Million Forecast, by Production Analysis 2019 & 2032
                                                              3. Table 3: Global Autonomous Underwater Vehicles Market Revenue Million Forecast, by Consumption Analysis 2019 & 2032
                                                              4. Table 4: Global Autonomous Underwater Vehicles Market Revenue Million Forecast, by Import Market Analysis (Value & Volume) 2019 & 2032
                                                              5. Table 5: Global Autonomous Underwater Vehicles Market Revenue Million Forecast, by Export Market Analysis (Value & Volume) 2019 & 2032
                                                              6. Table 6: Global Autonomous Underwater Vehicles Market Revenue Million Forecast, by Price Trend Analysis 2019 & 2032
                                                              7. Table 7: Global Autonomous Underwater Vehicles Market Revenue Million Forecast, by Region 2019 & 2032
                                                              8. Table 8: Global Autonomous Underwater Vehicles Market Revenue Million Forecast, by Country 2019 & 2032
                                                              9. Table 9: United States Autonomous Underwater Vehicles Market Revenue (Million) Forecast, by Application 2019 & 2032
                                                              10. Table 10: Canada Autonomous Underwater Vehicles Market Revenue (Million) Forecast, by Application 2019 & 2032
                                                              11. Table 11: Global Autonomous Underwater Vehicles Market Revenue Million Forecast, by Country 2019 & 2032
                                                              12. Table 12: United Kingdom Autonomous Underwater Vehicles Market Revenue (Million) Forecast, by Application 2019 & 2032
                                                              13. Table 13: Germany Autonomous Underwater Vehicles Market Revenue (Million) Forecast, by Application 2019 & 2032
                                                              14. Table 14: France Autonomous Underwater Vehicles Market Revenue (Million) Forecast, by Application 2019 & 2032
                                                              15. Table 15: Rest of Europe Autonomous Underwater Vehicles Market Revenue (Million) Forecast, by Application 2019 & 2032
                                                              16. Table 16: Global Autonomous Underwater Vehicles Market Revenue Million Forecast, by Country 2019 & 2032
                                                              17. Table 17: China Autonomous Underwater Vehicles Market Revenue (Million) Forecast, by Application 2019 & 2032
                                                              18. Table 18: India Autonomous Underwater Vehicles Market Revenue (Million) Forecast, by Application 2019 & 2032
                                                              19. Table 19: Japan Autonomous Underwater Vehicles Market Revenue (Million) Forecast, by Application 2019 & 2032
                                                              20. Table 20: South Korea Autonomous Underwater Vehicles Market Revenue (Million) Forecast, by Application 2019 & 2032
                                                              21. Table 21: Rest of Asia Pacific Autonomous Underwater Vehicles Market Revenue (Million) Forecast, by Application 2019 & 2032
                                                              22. Table 22: Global Autonomous Underwater Vehicles Market Revenue Million Forecast, by Country 2019 & 2032
                                                              23. Table 23: Autonomous Underwater Vehicles Market Revenue (Million) Forecast, by Application 2019 & 2032
                                                              24. Table 24: Global Autonomous Underwater Vehicles Market Revenue Million Forecast, by Production Analysis 2019 & 2032
                                                              25. Table 25: Global Autonomous Underwater Vehicles Market Revenue Million Forecast, by Consumption Analysis 2019 & 2032
                                                              26. Table 26: Global Autonomous Underwater Vehicles Market Revenue Million Forecast, by Import Market Analysis (Value & Volume) 2019 & 2032
                                                              27. Table 27: Global Autonomous Underwater Vehicles Market Revenue Million Forecast, by Export Market Analysis (Value & Volume) 2019 & 2032
                                                              28. Table 28: Global Autonomous Underwater Vehicles Market Revenue Million Forecast, by Price Trend Analysis 2019 & 2032
                                                              29. Table 29: Global Autonomous Underwater Vehicles Market Revenue Million Forecast, by Country 2019 & 2032
                                                              30. Table 30: United States Autonomous Underwater Vehicles Market Revenue (Million) Forecast, by Application 2019 & 2032
                                                              31. Table 31: Canada Autonomous Underwater Vehicles Market Revenue (Million) Forecast, by Application 2019 & 2032
                                                              32. Table 32: Mexico Autonomous Underwater Vehicles Market Revenue (Million) Forecast, by Application 2019 & 2032
                                                              33. Table 33: Global Autonomous Underwater Vehicles Market Revenue Million Forecast, by Production Analysis 2019 & 2032
                                                              34. Table 34: Global Autonomous Underwater Vehicles Market Revenue Million Forecast, by Consumption Analysis 2019 & 2032
                                                              35. Table 35: Global Autonomous Underwater Vehicles Market Revenue Million Forecast, by Import Market Analysis (Value & Volume) 2019 & 2032
                                                              36. Table 36: Global Autonomous Underwater Vehicles Market Revenue Million Forecast, by Export Market Analysis (Value & Volume) 2019 & 2032
                                                              37. Table 37: Global Autonomous Underwater Vehicles Market Revenue Million Forecast, by Price Trend Analysis 2019 & 2032
                                                              38. Table 38: Global Autonomous Underwater Vehicles Market Revenue Million Forecast, by Country 2019 & 2032
                                                              39. Table 39: Brazil Autonomous Underwater Vehicles Market Revenue (Million) Forecast, by Application 2019 & 2032
                                                              40. Table 40: Argentina Autonomous Underwater Vehicles Market Revenue (Million) Forecast, by Application 2019 & 2032
                                                              41. Table 41: Rest of South America Autonomous Underwater Vehicles Market Revenue (Million) Forecast, by Application 2019 & 2032
                                                              42. Table 42: Global Autonomous Underwater Vehicles Market Revenue Million Forecast, by Production Analysis 2019 & 2032
                                                              43. Table 43: Global Autonomous Underwater Vehicles Market Revenue Million Forecast, by Consumption Analysis 2019 & 2032
                                                              44. Table 44: Global Autonomous Underwater Vehicles Market Revenue Million Forecast, by Import Market Analysis (Value & Volume) 2019 & 2032
                                                              45. Table 45: Global Autonomous Underwater Vehicles Market Revenue Million Forecast, by Export Market Analysis (Value & Volume) 2019 & 2032
                                                              46. Table 46: Global Autonomous Underwater Vehicles Market Revenue Million Forecast, by Price Trend Analysis 2019 & 2032
                                                              47. Table 47: Global Autonomous Underwater Vehicles Market Revenue Million Forecast, by Country 2019 & 2032
                                                              48. Table 48: United Kingdom Autonomous Underwater Vehicles Market Revenue (Million) Forecast, by Application 2019 & 2032
                                                              49. Table 49: Germany Autonomous Underwater Vehicles Market Revenue (Million) Forecast, by Application 2019 & 2032
                                                              50. Table 50: France Autonomous Underwater Vehicles Market Revenue (Million) Forecast, by Application 2019 & 2032
                                                              51. Table 51: Italy Autonomous Underwater Vehicles Market Revenue (Million) Forecast, by Application 2019 & 2032
                                                              52. Table 52: Spain Autonomous Underwater Vehicles Market Revenue (Million) Forecast, by Application 2019 & 2032
                                                              53. Table 53: Russia Autonomous Underwater Vehicles Market Revenue (Million) Forecast, by Application 2019 & 2032
                                                              54. Table 54: Benelux Autonomous Underwater Vehicles Market Revenue (Million) Forecast, by Application 2019 & 2032
                                                              55. Table 55: Nordics Autonomous Underwater Vehicles Market Revenue (Million) Forecast, by Application 2019 & 2032
                                                              56. Table 56: Rest of Europe Autonomous Underwater Vehicles Market Revenue (Million) Forecast, by Application 2019 & 2032
                                                              57. Table 57: Global Autonomous Underwater Vehicles Market Revenue Million Forecast, by Production Analysis 2019 & 2032
                                                              58. Table 58: Global Autonomous Underwater Vehicles Market Revenue Million Forecast, by Consumption Analysis 2019 & 2032
                                                              59. Table 59: Global Autonomous Underwater Vehicles Market Revenue Million Forecast, by Import Market Analysis (Value & Volume) 2019 & 2032
                                                              60. Table 60: Global Autonomous Underwater Vehicles Market Revenue Million Forecast, by Export Market Analysis (Value & Volume) 2019 & 2032
                                                              61. Table 61: Global Autonomous Underwater Vehicles Market Revenue Million Forecast, by Price Trend Analysis 2019 & 2032
                                                              62. Table 62: Global Autonomous Underwater Vehicles Market Revenue Million Forecast, by Country 2019 & 2032
                                                              63. Table 63: Turkey Autonomous Underwater Vehicles Market Revenue (Million) Forecast, by Application 2019 & 2032
                                                              64. Table 64: Israel Autonomous Underwater Vehicles Market Revenue (Million) Forecast, by Application 2019 & 2032
                                                              65. Table 65: GCC Autonomous Underwater Vehicles Market Revenue (Million) Forecast, by Application 2019 & 2032
                                                              66. Table 66: North Africa Autonomous Underwater Vehicles Market Revenue (Million) Forecast, by Application 2019 & 2032
                                                              67. Table 67: South Africa Autonomous Underwater Vehicles Market Revenue (Million) Forecast, by Application 2019 & 2032
                                                              68. Table 68: Rest of Middle East & Africa Autonomous Underwater Vehicles Market Revenue (Million) Forecast, by Application 2019 & 2032
                                                              69. Table 69: Global Autonomous Underwater Vehicles Market Revenue Million Forecast, by Production Analysis 2019 & 2032
                                                              70. Table 70: Global Autonomous Underwater Vehicles Market Revenue Million Forecast, by Consumption Analysis 2019 & 2032
                                                              71. Table 71: Global Autonomous Underwater Vehicles Market Revenue Million Forecast, by Import Market Analysis (Value & Volume) 2019 & 2032
                                                              72. Table 72: Global Autonomous Underwater Vehicles Market Revenue Million Forecast, by Export Market Analysis (Value & Volume) 2019 & 2032
                                                              73. Table 73: Global Autonomous Underwater Vehicles Market Revenue Million Forecast, by Price Trend Analysis 2019 & 2032
                                                              74. Table 74: Global Autonomous Underwater Vehicles Market Revenue Million Forecast, by Country 2019 & 2032
                                                              75. Table 75: China Autonomous Underwater Vehicles Market Revenue (Million) Forecast, by Application 2019 & 2032
                                                              76. Table 76: India Autonomous Underwater Vehicles Market Revenue (Million) Forecast, by Application 2019 & 2032
                                                              77. Table 77: Japan Autonomous Underwater Vehicles Market Revenue (Million) Forecast, by Application 2019 & 2032
                                                              78. Table 78: South Korea Autonomous Underwater Vehicles Market Revenue (Million) Forecast, by Application 2019 & 2032
                                                              79. Table 79: ASEAN Autonomous Underwater Vehicles Market Revenue (Million) Forecast, by Application 2019 & 2032
                                                              80. Table 80: Oceania Autonomous Underwater Vehicles Market Revenue (Million) Forecast, by Application 2019 & 2032
                                                              81. Table 81: Rest of Asia Pacific Autonomous Underwater Vehicles Market Revenue (Million) Forecast, by Application 2019 & 2032


                                                              Frequently Asked Questions

                                                              1. What is the projected Compound Annual Growth Rate (CAGR) of the Autonomous Underwater Vehicles Market?

                                                              The projected CAGR is approximately 13.05%.

                                                              2. Which companies are prominent players in the Autonomous Underwater Vehicles Market?

                                                              Key companies in the market include Teledyne Marine (Teledyne Technologies Inc ), General Dynamics Corporation, Anduril Industries Inc, Mazagaon Dockyard Limite, Kongsberg Gruppen ASA, Lockheed Martin Corporation, Exail Technologies, Huntington Ingalls Industries Inc, The Boeing Company.

                                                              3. What are the main segments of the Autonomous Underwater Vehicles Market?

                                                              The market segments include Production Analysis, Consumption Analysis, Import Market Analysis (Value & Volume), Export Market Analysis (Value & Volume), Price Trend Analysis.

                                                              4. Can you provide details about the market size?

                                                              The market size is estimated to be USD XX Million as of 2022.

                                                              5. What are some drivers contributing to market growth?

                                                              Increase in Internet of Things (IoT) and Autonomous Systems; Rise in Demand for Military and Defense Satellite Communication Solutions.

                                                              6. What are the notable trends driving market growth?

                                                              Civil Segment is Expected to Experience Substantial Growth During the Forecast Period.

                                                              7. Are there any restraints impacting market growth?

                                                              Cybersecurity Threats to Satellite Communication; Interference in Transmission of Data.

                                                              8. Can you provide examples of recent developments in the market?

                                                              July 2023: An AUV named Neerakshi, built by India-based Defence PSU Garden Reach Shipbuilders and Engineers (GRSE) Ltd in collaboration with MSME entity Aerospace Engineering Private Ltd (AEPL), was launched. It is a lightweight and man-portable AUV with a length of 2.15 m and an endurance of nearly 4 hours. It is designed to operate completely autonomously, and its modular design enables it to carry out a variety of roles depending on the payload. The development of this AUV is regarded as a major step towards indigenous capability development in keeping with India's Atmanirbharta policy.

                                                              9. What pricing options are available for accessing the report?

                                                              Pricing options include single-user, multi-user, and enterprise licenses priced at USD 4750, USD 5250, and USD 8750 respectively.

                                                              10. Is the market size provided in terms of value or volume?

                                                              The market size is provided in terms of value, measured in Million.

                                                              11. Are there any specific market keywords associated with the report?

                                                              Yes, the market keyword associated with the report is "Autonomous Underwater Vehicles Market," which aids in identifying and referencing the specific market segment covered.

                                                              12. How do I determine which pricing option suits my needs best?

                                                              The pricing options vary based on user requirements and access needs. Individual users may opt for single-user licenses, while businesses requiring broader access may choose multi-user or enterprise licenses for cost-effective access to the report.

                                                              13. Are there any additional resources or data provided in the Autonomous Underwater Vehicles Market report?

                                                              While the report offers comprehensive insights, it's advisable to review the specific contents or supplementary materials provided to ascertain if additional resources or data are available.

                                                              14. How can I stay updated on further developments or reports in the Autonomous Underwater Vehicles Market?

                                                              To stay informed about further developments, trends, and reports in the Autonomous Underwater Vehicles Market, consider subscribing to industry newsletters, following relevant companies and organizations, or regularly checking reputable industry news sources and publications.


                                                              Methodology

                                                              Step 1 - Identification of Relevant Samples Size from Population Database

                                                              Step Chart
                                                              Bar Chart
                                                              Method Chart

                                                              Step 2 - Approaches for Defining Global Market Size (Value, Volume* & Price*)

                                                              Approach Chart
                                                              Top-down and bottom-up approaches are used to validate the global market size and estimate the market size for manufactures, regional segments, product, and application.

                                                              Note*: In applicable scenarios

                                                              Step 3 - Data Sources

                                                              Primary Research

                                                              • Web Analytics
                                                              • Survey Reports
                                                              • Research Institute
                                                              • Latest Research Reports
                                                              • Opinion Leaders

                                                              Secondary Research

                                                              • Annual Reports
                                                              • White Paper
                                                              • Latest Press Release
                                                              • Industry Association
                                                              • Paid Database
                                                              • Investor Presentations
                                                              Analyst Chart

                                                              Step 4 - Data Triangulation

                                                              Involves using different sources of information in order to increase the validity of a study

                                                              These sources are likely to be stakeholders in a program - participants, other researchers, program staff, other community members, and so on.

                                                              Then we put all data in single framework & apply various statistical tools to find out the dynamic on the market.

                                                              During the analysis stage, feedback from the stakeholder groups would be compared to determine areas of agreement as well as areas of divergence

                                                              Additionally, after gathering mixed and scattered data from a wide range of sources, data is triangulated and correlated to come up with estimated figures which are further validated through primary mediums or industry experts, opinion leaders.

                                                              About Precision Market View

                                                              Precision Market View offers precise market research, industry intelligence, and data analysis for healthcare, manufacturing, technology, and energy. Our reports provide the clarity you need to make informed decisions and drive growth.

                                                              Our team combines primary research, advanced analytics, and industry expertise to deliver actionable intelligence. We offer syndicated reports, custom research, and consulting services tailored to your business needs.

                                                              At Precision Market View, we are committed to quality, transparency, and client satisfaction. Every report is rigorously validated to ensure accuracy and relevance. Our global perspective and local expertise help you understand both the big picture and the finer details of your market.

                                                              Stay informed with Precision Market View. Subscribe to our newsletter for the latest updates and research highlights, and follow us on social media for real-time insights.

                                                              Precision Market View – Clarity for Your Strategic Decisions.

                                                              artwork spiralartwork spiralRelated Reports
                                                              artwork underline

                                                              Exploring Americas Intelligence Surveillance and Reconnaissance Market Market Disruption and Innovation

                                                              Discover the booming Americas Intelligence Surveillance and Reconnaissance (ISR) market! This comprehensive analysis reveals a CAGR exceeding 4.80% through 2033, driven by geopolitical tensions and technological advancements. Explore key players, regional trends, and growth opportunities in this vital sector.

                                                              July 2025
                                                              Base Year: 2024
                                                              No Of Pages: 197
                                                              Price: $3800

                                                              Exploring Innovation in Asia-Pacific And Middle-East Inflight Catering Market Industry

                                                              Discover the booming Asia-Pacific & Middle-East inflight catering market! Projected to reach \$15.89B by 2033 with a 10.05% CAGR, this report analyzes market size, key trends (premiumization, diverse cuisines), and leading players like Emirates & LSG. Learn more about regional growth and investment opportunities.

                                                              July 2025
                                                              Base Year: 2024
                                                              No Of Pages: 234
                                                              Price: $4750

                                                              Opportunities in Europe Military Satellite Market Market 2025-2033

                                                              Discover the booming European military satellite market! Our analysis reveals a €1.5 billion market in 2025 projected to reach €4 billion by 2033, driven by geopolitical tensions and technological advancements. Explore key trends, segments (LEO, GEO, satellite subsystems), and major players shaping this dynamic sector.

                                                              July 2025
                                                              Base Year: 2024
                                                              No Of Pages: 197
                                                              Price: $3800

                                                              Global Southeast Asia Defense Market Trends: Region-Specific Insights 2025-2033

                                                              The Southeast Asia defense market is booming, projected to reach over $25 billion by 2033, driven by modernization efforts and geopolitical tensions. This comprehensive analysis reveals key market trends, drivers, restraints, and leading companies in this rapidly expanding sector. Explore the opportunities and challenges in the Singapore, Indonesia, Thailand, and Malaysia defense markets.

                                                              July 2025
                                                              Base Year: 2024
                                                              No Of Pages: 197
                                                              Price: $3800

                                                              Comprehensive Overview of Cabin Interior Composites Industry Trends: 2025-2033

                                                              The Cabin Interior Composites market is booming, projected to exceed $XX million by 2033 with a CAGR above 6%. Learn about key drivers, market trends, leading companies (Triumph Group, Safran, etc.), and regional growth forecasts in this comprehensive market analysis. Discover opportunities in lightweight aircraft design and sustainable materials.

                                                              July 2025
                                                              Base Year: 2024
                                                              No Of Pages: 234
                                                              Price: $4750

                                                              Micro Turbine Generator System Market Market Drivers and Challenges: Trends 2025-2033

                                                              The Micro Turbine Generator System (MTGS) market is booming, projected to exceed a CAGR of 18% through 2033. Driven by demand for reliable power in remote areas and advancements in technology, this market presents lucrative opportunities across commercial, military, and industrial sectors. Explore market trends, key players, and regional insights in this comprehensive analysis.

                                                              July 2025
                                                              Base Year: 2024
                                                              No Of Pages: 234
                                                              Price: $4750

                                                              Electrical Weapons Market Market Trends and Strategic Roadmap

                                                              The global electrical weapons market is booming, projected to reach [estimated 2033 value based on CAGR] by 2033. Driven by law enforcement and military demand for less-lethal options, this market analysis explores key trends, leading companies (Axon, Lockheed Martin, etc.), and regional growth opportunities in stun guns, tasers, and advanced technologies.

                                                              July 2025
                                                              Base Year: 2024
                                                              No Of Pages: 234
                                                              Price: $4750

                                                              Fighter Aircraft Market: Disruptive Technologies Driving Market Growth 2025-2033

                                                              The global fighter aircraft market, valued at $47.34 billion in 2025, is poised for significant growth (CAGR 3.72%) driven by geopolitical tensions and technological advancements. Explore market trends, leading companies (Lockheed Martin, Boeing, Dassault), and regional insights in this comprehensive analysis.

                                                              July 2025
                                                              Base Year: 2024
                                                              No Of Pages: 234
                                                              Price: $4750

                                                              Military Gas Mask Market Market’s Consumer Insights and Trends

                                                              The Military Gas Mask Market is poised for significant growth, driven by rising geopolitical tensions and technological advancements. Discover key trends, market size projections (2025-2033), leading companies, and regional analysis in this comprehensive market report. Explore the impact of powered respirators and evolving military needs on this dynamic sector.

                                                              July 2025
                                                              Base Year: 2024
                                                              No Of Pages: 234
                                                              Price: $4750

                                                              Exploring Middle-East and Africa Airport Baggage Handling Systems Market Growth Trajectories: CAGR Insights 2025-2033

                                                              The Middle East & Africa Airport Baggage Handling Systems market is booming, projected to reach $90.71 million in 2025 with a 10.09% CAGR through 2033. Discover key drivers, trends, and regional insights in this comprehensive market analysis. Explore growth opportunities in automated baggage systems and airport modernization.

                                                              July 2025
                                                              Base Year: 2024
                                                              No Of Pages: 210
                                                              Price: $4750

                                                              Aircraft Engines Market in Europe Market Demand and Consumption Trends: Outlook 2025-2033

                                                              The European aircraft engines market is booming, with a projected €20.73 billion valuation in 2025 and a 3.82% CAGR through 2033. Discover key trends, major players (Rolls-Royce, Safran, Pratt & Whitney), and regional breakdowns in this comprehensive market analysis.

                                                              July 2025
                                                              Base Year: 2024
                                                              No Of Pages: 234
                                                              Price: $4750

                                                              Small Arms Light Weapons Market Market Analysis and Forecasts

                                                              The global small arms and light weapons market is experiencing steady growth, driven by increased military spending, law enforcement demand, and civilian ownership. This comprehensive analysis explores market size, trends, key players, and regional insights from 2019-2033, offering valuable data for industry stakeholders.

                                                              July 2025
                                                              Base Year: 2024
                                                              No Of Pages: 234
                                                              Price: $4750

                                                              Turkey Defense & Aerospace Industry Future-Proof Strategies: Market Trends 2025-2033

                                                              Discover the booming Turkish defense & aerospace industry! This in-depth market analysis reveals a $15.27B (2025) market with a projected CAGR of 1.15%, driven by government investment and leading companies like Turkish Technic and ASELSAN. Explore market trends, key players, and future growth potential.

                                                              July 2025
                                                              Base Year: 2024
                                                              No Of Pages: 197
                                                              Price: $3800

                                                              Understanding UAM Market Trends and Growth Dynamics

                                                              The Urban Air Mobility (UAM) market is booming, projected to reach $19.13 billion by 2033 with a 23.54% CAGR. Discover key trends, growth drivers, and major players shaping this transformative sector, including eVTOL aircraft, autonomous flight, and regional market analysis. Learn how advancements in technology and supportive regulations are driving this rapidly expanding market.

                                                              July 2025
                                                              Base Year: 2024
                                                              No Of Pages: 234
                                                              Price: $4750

                                                              Growth Strategies in Europe Air Defense Systems Market Market: 2025-2033 Outlook

                                                              The European Air Defense Systems Market is booming, projected to reach €16.31 billion by 2033, driven by geopolitical tensions and technological advancements. This in-depth analysis reveals key market drivers, trends, restraints, and leading companies, providing valuable insights for investors and industry professionals. Explore the market's growth potential across air, sea, and land-based systems in key European nations.

                                                              July 2025
                                                              Base Year: 2024
                                                              No Of Pages: 234
                                                              Price: $4750

                                                              Defense Market in the Middle East & Africa CAGR Growth Drivers and Trends: Forecasts 2025-2033

                                                              The Middle East & Africa defense market is booming, projected to reach \$207.5 billion by 2033, driven by geopolitical instability and modernization efforts. Explore market trends, key players (Rheinmetall, Elbit Systems, Lockheed Martin), and regional growth forecasts in this comprehensive analysis.

                                                              July 2025
                                                              Base Year: 2024
                                                              No Of Pages: 234
                                                              Price: $4750

                                                              Air-based Remote Weapon Stations Market 2025 Trends and Forecasts 2033: Analyzing Growth Opportunities

                                                              The Air-based Remote Weapon Stations (RWS) market is booming, with a 7.32% CAGR. Explore market trends, key players (General Dynamics, Elbit Systems, Leonardo), regional insights, and future projections for this rapidly expanding sector of defense technology. Discover the impact of UAVs and advanced sensor technologies on this multi-billion dollar market.

                                                              July 2025
                                                              Base Year: 2024
                                                              No Of Pages: 234
                                                              Price: $4750

                                                              Comprehensive Review of US Business Jet Market Growth Potential

                                                              The US business jet market is booming, with a CAGR exceeding 16% and projected to reach $75 billion by 2033. This report analyzes market drivers, restraints, segments (large, light, mid-size jets), key players (Textron, Dassault, Embraer, Bombardier), and regional trends across the US. Discover insights into this lucrative sector.

                                                              July 2025
                                                              Base Year: 2024
                                                              No Of Pages: 197
                                                              Price: $3800

                                                              Latin America Aviation Industry Market Size and Trends 2025-2033: Comprehensive Outlook

                                                              Discover the booming Latin American aviation market! This in-depth analysis reveals a $40.11B (2025) industry with a 3.03% CAGR, driven by tourism, infrastructure improvements, and a growing middle class. Learn about key players, market segments (commercial, military, general aviation), and regional growth projections for 2025-2033.

                                                              July 2025
                                                              Base Year: 2024
                                                              No Of Pages: 234
                                                              Price: $4750

                                                              Europe Aircraft Lighting Market Market’s Technological Evolution: Trends and Analysis 2025-2033

                                                              The European Aircraft Lighting Market is booming, projected to reach €324.57 million by 2033, driven by LED technology adoption and stringent safety regulations. Discover key trends, growth drivers, and leading companies shaping this dynamic sector.

                                                              July 2025
                                                              Base Year: 2024
                                                              No Of Pages: 234
                                                              Price: $4750
                                                              • Home
                                                              • About Us
                                                              • Industries
                                                                • Aerospace & Defense
                                                                • Agriculture
                                                                • Animal Nutrition & Wellness
                                                                • Automotive
                                                                • Chemicals & Materials
                                                                • Consumer Goods and Services
                                                                • Energy & Power
                                                                • Financial Services and Investment Intelligence
                                                                • Food & Beverage
                                                                • Home and Property Improvement
                                                                • Hospitality and Tourism
                                                                • Logistics
                                                                • Manufacturing Products and Services
                                                                • Packaging
                                                                • Professional and Commercial Services
                                                                • Real Estate and Construction
                                                                • Retail
                                                                • Technology, Media and Telecom
                                                                • Healthcare
                                                              • Services
                                                              • Contact
                                                              Main Logo
                                                              • Home
                                                              • About Us
                                                              • Industries
                                                                • Aerospace & Defense
                                                                • Agriculture
                                                                • Animal Nutrition & Wellness
                                                                • Automotive
                                                                • Chemicals & Materials
                                                                • Consumer Goods and Services
                                                                • Energy & Power
                                                                • Financial Services and Investment Intelligence
                                                                • Food & Beverage
                                                                • Home and Property Improvement
                                                                • Hospitality and Tourism
                                                                • Logistics
                                                                • Manufacturing Products and Services
                                                                • Packaging
                                                                • Professional and Commercial Services
                                                                • Real Estate and Construction
                                                                • Retail
                                                                • Technology, Media and Telecom
                                                                • Healthcare
                                                              • Services
                                                              • Contact
                                                              +17162654855
                                                              [email protected]

                                                              +17162654855

                                                              [email protected]

                                                              Business Address

                                                              Head Office

                                                              Office no. A 5010, fifth floor, Solitaire Business Hub, Near Phoenix mall, Pune, Maharashtra 411014

                                                              Contact Information

                                                              Craig Francis

                                                              Business Development Head

                                                              +17162654855

                                                              [email protected]

                                                              Connect With Us

                                                              Secure Payment Partners

                                                              payment image
                                                              RetailLogisticsPackagingAutomotiveHealthcareAgricultureEnergy & PowerFood & BeverageAerospace & DefenseChemicals & MaterialsHospitality and TourismAnimal Nutrition & WellnessConsumer Goods and ServicesReal Estate and ConstructionHome and Property ImprovementTechnology, Media and TelecomManufacturing Products and ServicesFinancial Services and Investment Intelligence

                                                              © 2025 All rights reserved


                                                              Privacy Policy
                                                              Terms and Conditions
                                                              FAQ