

Key Insights
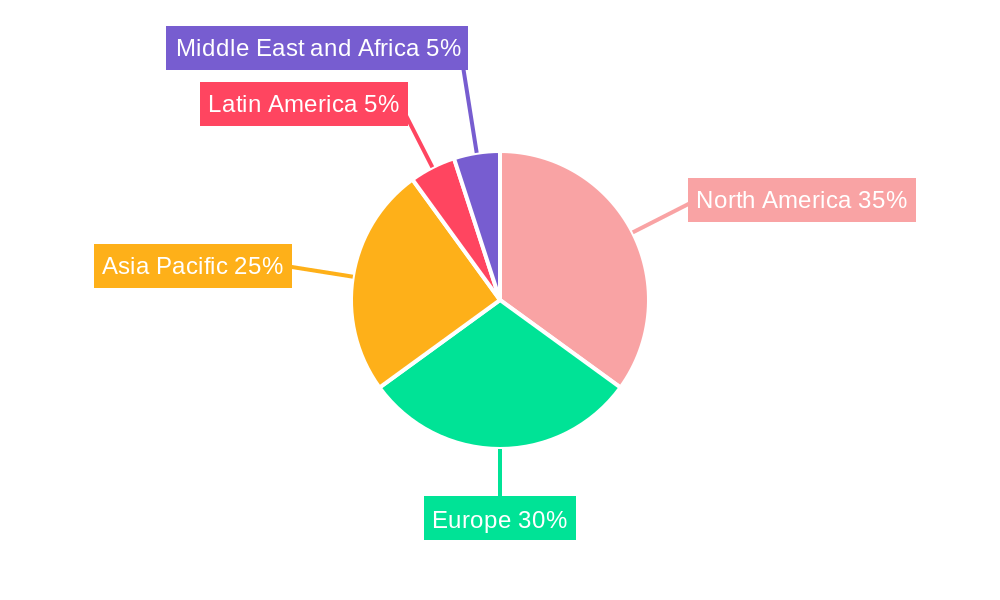
The autonomous ships market is experiencing robust growth, projected to reach a substantial size driven by increasing demand for enhanced safety, efficiency, and reduced operational costs within the maritime industry. The market's Compound Annual Growth Rate (CAGR) of 7.30% from 2019 to 2033 indicates a significant upward trajectory. This expansion is fueled by several key factors. Firstly, technological advancements in areas such as artificial intelligence (AI), sensor technology, and autonomous navigation systems are making autonomous vessels increasingly feasible and reliable. Secondly, the maritime sector faces persistent challenges related to crew shortages, high labor costs, and safety concerns; autonomous ships offer a compelling solution to mitigate these issues. Thirdly, the growing adoption of autonomous systems across various applications, including commercial shipping and military operations, is further bolstering market growth. The segmentation reveals a diverse landscape, with partially autonomous ships currently holding a significant market share due to their immediate applicability and lower risk profile. However, fully autonomous ships are expected to witness faster growth in the coming years, as technology matures and regulatory frameworks evolve. Geographical analysis shows that North America and Europe, with their advanced technological infrastructure and robust maritime industries, are currently leading the market. However, the Asia-Pacific region, particularly China and India, presents significant growth potential due to the rapid expansion of their shipping sectors and investment in autonomous technology.
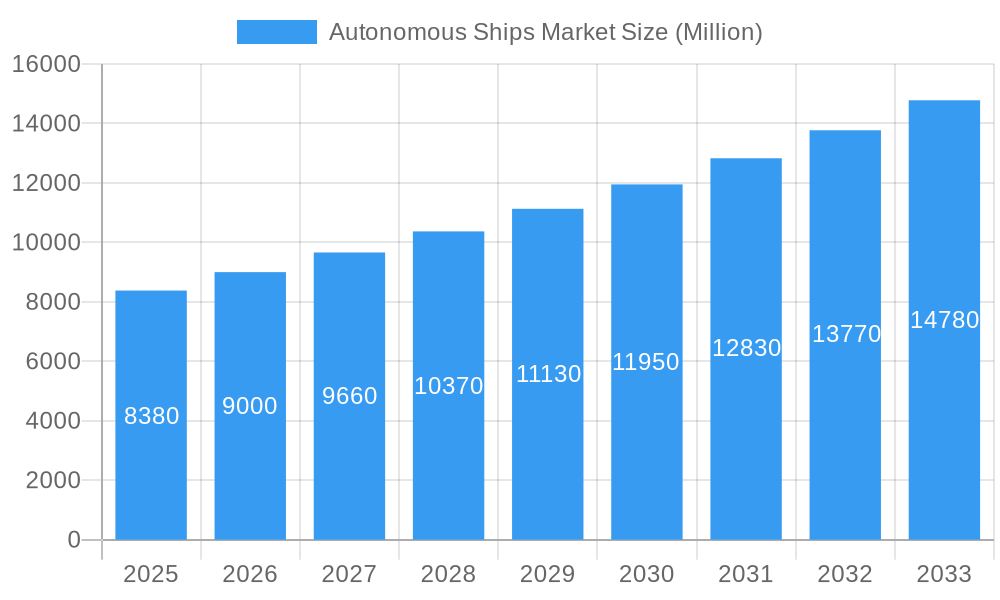
Autonomous Ships Market Market Size (In Billion)
The competitive landscape comprises a mix of established players and emerging technology companies. Major players like ABB Ltd, Kongsberg Gruppen ASA, and Rolls-Royce plc are investing heavily in R&D and strategic partnerships to maintain their leadership positions. The entry of new players, particularly those specializing in AI and software solutions, is further intensifying competition and accelerating innovation. While regulatory hurdles and initial high capital investment costs present challenges, ongoing industry collaborations and government support are actively working towards streamlining the regulatory landscape and fostering wider adoption of autonomous shipping technologies. The forecast period from 2025 to 2033 will likely witness a substantial shift toward higher levels of autonomy, with fully autonomous ships becoming increasingly prevalent across various maritime applications. The long-term outlook remains optimistic, underpinned by the continuing technological advancements, evolving regulations, and the pressing need for a more efficient and sustainable maritime industry.
Autonomous Ships Market Company Market Share
This in-depth report provides a comprehensive analysis of the Autonomous Ships Market, offering valuable insights for stakeholders across the maritime industry. The study period spans 2019-2033, with 2025 as the base and estimated year. The report meticulously analyzes market size, segmentation, growth drivers, challenges, and competitive dynamics, forecasting market trends until 2033.
Autonomous Ships Market Market Structure & Competitive Dynamics
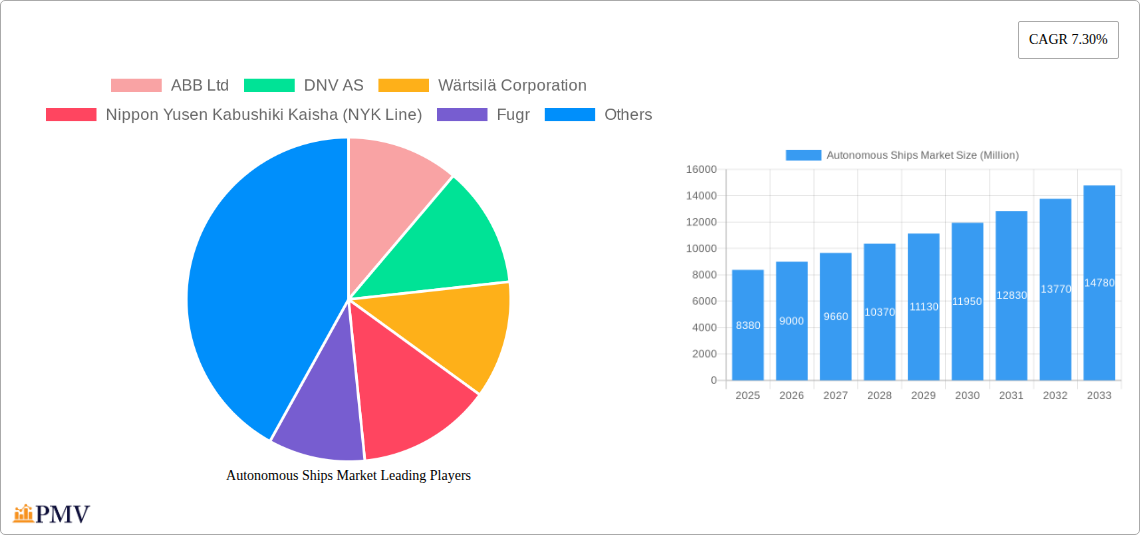
The Autonomous Ships Market exhibits a moderately concentrated structure, with key players like ABB Ltd, DNV AS, Wärtsilä Corporation, Nippon Yusen Kabushiki Kaisha (NYK Line), Fugro, Kongsberg Gruppen ASA, MITSUI E&S Co Ltd, Vigor Industrial LLC, Rolls-Royce plc, Praxis Automation Technology B V, Hanwha Corporation, and HD Hyundai Heavy Industries Co Ltd holding significant market share. Market concentration is influenced by factors such as technological expertise, intellectual property, and established partnerships within the maritime ecosystem. Innovation ecosystems are dynamic, driven by collaborations between technology companies, shipbuilders, and research institutions. The regulatory landscape is evolving, with international bodies defining safety standards and guidelines for autonomous vessel operation. Product substitutes are currently limited, with autonomous ships offering unique advantages in terms of efficiency and safety. End-user trends show a growing demand for automation across commercial and military applications, pushing market growth. M&A activity is anticipated to increase, with larger players acquiring smaller, specialized technology firms to expand their portfolios and capabilities. The total value of M&A deals in the last 5 years is estimated at xx Million. Individual company market shares are currently xx% for ABB Ltd, xx% for DNV AS, and xx% for Wärtsilä Corporation (with remaining shares distributed among other players).
Autonomous Ships Market Industry Trends & Insights
The Autonomous Ships Market is experiencing robust growth, driven by several key factors. The increasing demand for enhanced maritime efficiency, coupled with the need for reduced operational costs, is a primary catalyst. Technological advancements in areas such as AI, machine learning, and sensor technology are paving the way for more sophisticated autonomous systems. Consumer preferences are shifting towards safer, more reliable shipping solutions, leading to increased adoption of autonomous vessels. The competitive landscape is highly innovative, with companies continuously striving to develop cutting-edge technologies. The market is projected to achieve a CAGR of xx% during the forecast period (2025-2033), with a significant market penetration expected in the commercial sector. The growth is further amplified by factors like the rising global trade volume, increasing fuel costs, and the need to address the shortage of skilled maritime labor. The increasing adoption of autonomous technologies is significantly impacting the industry landscape and transforming the way maritime operations are conducted, leading to increased operational efficiency and significant cost savings. Market penetration is currently estimated at xx% and is expected to rise significantly over the next decade.
Dominant Markets & Segments in Autonomous Ships Market
The Asia-Pacific region is currently the dominant market for autonomous ships, driven by robust economic growth, substantial investments in maritime infrastructure, and a high concentration of shipping activities. Within this region, China and Japan are leading adopters.
Key Drivers:
- Favorable government policies and incentives supporting technological advancements in the maritime sector.
- Strong presence of major shipbuilders and technology providers.
- High volume of maritime traffic and growing trade activities.
Segment Dominance:
- Type: Partially autonomous ships currently hold the largest market share, owing to their relatively lower implementation costs and immediate operational benefits. However, fully autonomous ships are anticipated to witness significant growth in the coming years.
- Application: The commercial segment dominates, accounting for the largest share of the market. The military application segment is also showing substantial growth, driven by the increasing adoption of autonomous vessels for surveillance and defense operations.
The detailed analysis reveals that the partially autonomous segment contributes xx Million in revenue, while the fully autonomous segment projects xx Million. The commercial application sector is far larger at xx Million compared to the military application sector which is at xx Million.
Autonomous Ships Market Product Innovations
Recent innovations focus on improving the reliability, safety, and efficiency of autonomous systems. This includes advancements in sensor technology, AI-powered navigation systems, and remote control capabilities. Companies are constantly refining their systems to better address the unique challenges of autonomous navigation in diverse maritime environments. These innovations are driving increased market adoption by enhancing operational efficiency, reducing risks, and boosting overall productivity in maritime operations.
Report Segmentation & Scope
The report segments the Autonomous Ships Market based on type (Partially Autonomous, Remotely Controlled Ship, Fully Autonomous) and application (Commercial, Military).
Type:
- Partially Autonomous: This segment is expected to witness steady growth, driven by the adoption of automation technologies to improve efficiency. Market size in 2025 is projected at xx Million.
- Remotely Controlled Ship: This segment is characterized by substantial growth as advancements in remote operations become more prevalent. The 2025 market size is anticipated to reach xx Million.
- Fully Autonomous: This segment is anticipated to show the highest growth rate over the forecast period, driven by technological advancements and increasing market acceptance. It is predicted to have a market size of xx Million in 2025.
Application:
- Commercial: This segment accounts for the largest market share, driven by the need for efficient and cost-effective shipping solutions. 2025 market size is predicted at xx Million.
- Military: This segment is expected to demonstrate significant growth, driven by the rising demand for autonomous naval vessels. The 2025 market size is estimated at xx Million.
Key Drivers of Autonomous Ships Market Growth
Technological advancements in AI, sensor technology, and communication systems are key drivers. The increasing demand for improved efficiency and reduced operational costs fuels market growth. Furthermore, supportive regulatory frameworks and growing government investment in autonomous maritime technologies are significant contributors. For example, the recent investments by several governments in research and development of autonomous navigation technology significantly accelerates growth.
Challenges in the Autonomous Ships Market Sector
Regulatory uncertainties regarding the safety and operational standards of autonomous ships pose a significant challenge. Supply chain disruptions and the scarcity of skilled labor for the development and maintenance of these complex systems present obstacles. Furthermore, the high initial investment costs associated with the adoption of autonomous technologies and competitive pressures from established players in the maritime industry represent considerable barriers. These challenges could cumulatively reduce the projected market size by an estimated xx Million by 2033.
Leading Players in the Autonomous Ships Market Market
- ABB Ltd
- DNV AS
- Wärtsilä Corporation
- Nippon Yusen Kabushiki Kaisha (NYK Line)
- Fugro
- Kongsberg Gruppen ASA
- MITSUI E&S Co Ltd
- Vigor Industrial LLC
- Rolls-Royce plc
- Praxis Automation Technology B V
- Hanwha Corporation
- HD Hyundai Heavy Industries Co Ltd
Key Developments in Autonomous Ships Market Sector
- August 2022: Avikus, a subsidiary of HD Hyundai Heavy Industries, secured an order for its autonomous navigation solution (HiNAS 2.0) to be installed on 23 vessels by SK Shipping and Sinokor Merchant Marine. This deal underscores the growing adoption of autonomous navigation technologies in commercial shipping.
- February 2023: Austal USA delivered an autonomous-capable EPF 13 ship to the US Navy. The integration of automated maintenance, health monitoring, and mission readiness capabilities enables extended autonomous operation. This highlights the increasing interest in autonomous technologies for military applications.
Strategic Autonomous Ships Market Market Outlook
The Autonomous Ships Market is poised for significant growth, driven by continuous technological advancements and the increasing demand for efficient, safe, and cost-effective maritime operations. Strategic opportunities exist for companies focusing on the development and integration of advanced AI, sensor technologies, and cybersecurity solutions within autonomous vessel systems. The market is expected to see continued consolidation, with larger players acquiring smaller firms to strengthen their capabilities and market share. The future potential is vast, with widespread adoption across various maritime segments, transforming the global shipping industry in the coming decades.
Autonomous Ships Market Segmentation
-
1. Type
- 1.1. Partially Autonomous
- 1.2. Remotely Controlled Ship
- 1.3. Fully Autonomous
-
2. Application
- 2.1. Commercial
- 2.2. Military
Autonomous Ships Market Segmentation By Geography
-
1. North America
- 1.1. United States
- 1.2. Canada
-
2. Europe
- 2.1. United Kingdom
- 2.2. Germany
- 2.3. France
- 2.4. Italy
- 2.5. Russia
- 2.6. Rest of Europe
-
3. Asia Pacific
- 3.1. China
- 3.2. India
- 3.3. Japan
- 3.4. South Korea
- 3.5. Australia
- 3.6. Rest of Asia Pacific
-
4. Latin America
- 4.1. Brazil
- 4.2. Rest of Latin America
-
5. Middle East and Africa
- 5.1. Saudi Arabia
- 5.2. United Arab Emirates
- 5.3. Qatar
- 5.4. Egypt
- 5.5. South Africa
- 5.6. Rest of Middle East and Africa
Autonomous Ships Market Regional Market Share
Geographic Coverage of Autonomous Ships Market
Autonomous Ships Market REPORT HIGHLIGHTS
| Aspects | Details |
|---|---|
| Study Period | 2020-2034 |
| Base Year | 2025 |
| Estimated Year | 2026 |
| Forecast Period | 2026-2034 |
| Historical Period | 2020-2025 |
| Growth Rate | CAGR of 7.30% from 2020-2034 |
| Segmentation |
|
Table of Contents
- 1. Introduction
- 1.1. Research Scope
- 1.2. Market Segmentation
- 1.3. Research Objective
- 1.4. Definitions and Assumptions
- 2. Executive Summary
- 2.1. Market Snapshot
- 3. Market Dynamics
- 3.1. Market Drivers
- 3.2. Market Restrains
- 3.3. Market Trends
- 3.4. Market Opportunities
- 4. Market Factor Analysis
- 4.1. Porters Five Forces
- 4.1.1. Bargaining Power of Suppliers
- 4.1.2. Bargaining Power of Buyers
- 4.1.3. Threat of New Entrants
- 4.1.4. Threat of Substitutes
- 4.1.5. Competitive Rivalry
- 4.2. PESTEL analysis
- 4.3. BCG Analysis
- 4.3.1. Stars (High Growth, High Market Share)
- 4.3.2. Cash Cows (Low Growth, High Market Share)
- 4.3.3. Question Mark (High Growth, Low Market Share)
- 4.3.4. Dogs (Low Growth, Low Market Share)
- 4.4. Ansoff Matrix Analysis
- 4.5. Supply Chain Analysis
- 4.6. Regulatory Landscape
- 4.7. Current Market Potential and Opportunity Assessment (TAM–SAM–SOM Framework)
- 4.8. PMV Analyst Note
- 4.1. Porters Five Forces
- 5. Market Analysis, Insights and Forecast 2021-2033
- 5.1. Market Analysis, Insights and Forecast - by Type
- 5.1.1. Partially Autonomous
- 5.1.2. Remotely Controlled Ship
- 5.1.3. Fully Autonomous
- 5.2. Market Analysis, Insights and Forecast - by Application
- 5.2.1. Commercial
- 5.2.2. Military
- 5.3. Market Analysis, Insights and Forecast - by Region
- 5.3.1. North America
- 5.3.2. Europe
- 5.3.3. Asia Pacific
- 5.3.4. Latin America
- 5.3.5. Middle East and Africa
- 5.1. Market Analysis, Insights and Forecast - by Type
- 6. Global Autonomous Ships Market Analysis, Insights and Forecast, 2021-2033
- 6.1. Market Analysis, Insights and Forecast - by Type
- 6.1.1. Partially Autonomous
- 6.1.2. Remotely Controlled Ship
- 6.1.3. Fully Autonomous
- 6.2. Market Analysis, Insights and Forecast - by Application
- 6.2.1. Commercial
- 6.2.2. Military
- 6.1. Market Analysis, Insights and Forecast - by Type
- 7. North America Autonomous Ships Market Analysis, Insights and Forecast, 2020-2032
- 7.1. Market Analysis, Insights and Forecast - by Type
- 7.1.1. Partially Autonomous
- 7.1.2. Remotely Controlled Ship
- 7.1.3. Fully Autonomous
- 7.2. Market Analysis, Insights and Forecast - by Application
- 7.2.1. Commercial
- 7.2.2. Military
- 7.1. Market Analysis, Insights and Forecast - by Type
- 8. Europe Autonomous Ships Market Analysis, Insights and Forecast, 2020-2032
- 8.1. Market Analysis, Insights and Forecast - by Type
- 8.1.1. Partially Autonomous
- 8.1.2. Remotely Controlled Ship
- 8.1.3. Fully Autonomous
- 8.2. Market Analysis, Insights and Forecast - by Application
- 8.2.1. Commercial
- 8.2.2. Military
- 8.1. Market Analysis, Insights and Forecast - by Type
- 9. Asia Pacific Autonomous Ships Market Analysis, Insights and Forecast, 2020-2032
- 9.1. Market Analysis, Insights and Forecast - by Type
- 9.1.1. Partially Autonomous
- 9.1.2. Remotely Controlled Ship
- 9.1.3. Fully Autonomous
- 9.2. Market Analysis, Insights and Forecast - by Application
- 9.2.1. Commercial
- 9.2.2. Military
- 9.1. Market Analysis, Insights and Forecast - by Type
- 10. Latin America Autonomous Ships Market Analysis, Insights and Forecast, 2020-2032
- 10.1. Market Analysis, Insights and Forecast - by Type
- 10.1.1. Partially Autonomous
- 10.1.2. Remotely Controlled Ship
- 10.1.3. Fully Autonomous
- 10.2. Market Analysis, Insights and Forecast - by Application
- 10.2.1. Commercial
- 10.2.2. Military
- 10.1. Market Analysis, Insights and Forecast - by Type
- 11. Middle East and Africa Autonomous Ships Market Analysis, Insights and Forecast, 2020-2032
- 11.1. Market Analysis, Insights and Forecast - by Type
- 11.1.1. Partially Autonomous
- 11.1.2. Remotely Controlled Ship
- 11.1.3. Fully Autonomous
- 11.2. Market Analysis, Insights and Forecast - by Application
- 11.2.1. Commercial
- 11.2.2. Military
- 11.1. Market Analysis, Insights and Forecast - by Type
- 12. Competitive Analysis
- 12.1. Company Profiles
- 12.1.1 ABB Ltd
- 12.1.1.1. Company Overview
- 12.1.1.2. Products
- 12.1.1.3. Company Financials
- 12.1.1.4. SWOT Analysis
- 12.1.2 DNV AS
- 12.1.2.1. Company Overview
- 12.1.2.2. Products
- 12.1.2.3. Company Financials
- 12.1.2.4. SWOT Analysis
- 12.1.3 Wärtsilä Corporation
- 12.1.3.1. Company Overview
- 12.1.3.2. Products
- 12.1.3.3. Company Financials
- 12.1.3.4. SWOT Analysis
- 12.1.4 Nippon Yusen Kabushiki Kaisha (NYK Line)
- 12.1.4.1. Company Overview
- 12.1.4.2. Products
- 12.1.4.3. Company Financials
- 12.1.4.4. SWOT Analysis
- 12.1.5 Fugr
- 12.1.5.1. Company Overview
- 12.1.5.2. Products
- 12.1.5.3. Company Financials
- 12.1.5.4. SWOT Analysis
- 12.1.6 Kongsberg Gruppen ASA
- 12.1.6.1. Company Overview
- 12.1.6.2. Products
- 12.1.6.3. Company Financials
- 12.1.6.4. SWOT Analysis
- 12.1.7 MITSUI E&S Co Ltd
- 12.1.7.1. Company Overview
- 12.1.7.2. Products
- 12.1.7.3. Company Financials
- 12.1.7.4. SWOT Analysis
- 12.1.8 Vigor Industrial LLC
- 12.1.8.1. Company Overview
- 12.1.8.2. Products
- 12.1.8.3. Company Financials
- 12.1.8.4. SWOT Analysis
- 12.1.9 Rolls-Royce plc
- 12.1.9.1. Company Overview
- 12.1.9.2. Products
- 12.1.9.3. Company Financials
- 12.1.9.4. SWOT Analysis
- 12.1.10 Praxis Automation Technology B V
- 12.1.10.1. Company Overview
- 12.1.10.2. Products
- 12.1.10.3. Company Financials
- 12.1.10.4. SWOT Analysis
- 12.1.11 Hanwha Corporation
- 12.1.11.1. Company Overview
- 12.1.11.2. Products
- 12.1.11.3. Company Financials
- 12.1.11.4. SWOT Analysis
- 12.1.12 HD Hyundai Heavy Industries Co Ltd
- 12.1.12.1. Company Overview
- 12.1.12.2. Products
- 12.1.12.3. Company Financials
- 12.1.12.4. SWOT Analysis
- 12.1.1 ABB Ltd
- 12.2. Market Entropy
- 12.2.1 Company's Key Areas Served
- 12.2.2 Recent Developments
- 12.3. Company Market Share Analysis 2025
- 12.3.1 Top 5 Companies Market Share Analysis
- 12.3.2 Top 3 Companies Market Share Analysis
- 12.4. List of Potential Customers
- 13. Research Methodology
List of Figures
- Figure 1: Global Autonomous Ships Market Revenue Breakdown (Million, %) by Region 2025 & 2033
- Figure 2: North America Autonomous Ships Market Revenue (Million), by Type 2025 & 2033
- Figure 3: North America Autonomous Ships Market Revenue Share (%), by Type 2025 & 2033
- Figure 4: North America Autonomous Ships Market Revenue (Million), by Application 2025 & 2033
- Figure 5: North America Autonomous Ships Market Revenue Share (%), by Application 2025 & 2033
- Figure 6: North America Autonomous Ships Market Revenue (Million), by Country 2025 & 2033
- Figure 7: North America Autonomous Ships Market Revenue Share (%), by Country 2025 & 2033
- Figure 8: Europe Autonomous Ships Market Revenue (Million), by Type 2025 & 2033
- Figure 9: Europe Autonomous Ships Market Revenue Share (%), by Type 2025 & 2033
- Figure 10: Europe Autonomous Ships Market Revenue (Million), by Application 2025 & 2033
- Figure 11: Europe Autonomous Ships Market Revenue Share (%), by Application 2025 & 2033
- Figure 12: Europe Autonomous Ships Market Revenue (Million), by Country 2025 & 2033
- Figure 13: Europe Autonomous Ships Market Revenue Share (%), by Country 2025 & 2033
- Figure 14: Asia Pacific Autonomous Ships Market Revenue (Million), by Type 2025 & 2033
- Figure 15: Asia Pacific Autonomous Ships Market Revenue Share (%), by Type 2025 & 2033
- Figure 16: Asia Pacific Autonomous Ships Market Revenue (Million), by Application 2025 & 2033
- Figure 17: Asia Pacific Autonomous Ships Market Revenue Share (%), by Application 2025 & 2033
- Figure 18: Asia Pacific Autonomous Ships Market Revenue (Million), by Country 2025 & 2033
- Figure 19: Asia Pacific Autonomous Ships Market Revenue Share (%), by Country 2025 & 2033
- Figure 20: Latin America Autonomous Ships Market Revenue (Million), by Type 2025 & 2033
- Figure 21: Latin America Autonomous Ships Market Revenue Share (%), by Type 2025 & 2033
- Figure 22: Latin America Autonomous Ships Market Revenue (Million), by Application 2025 & 2033
- Figure 23: Latin America Autonomous Ships Market Revenue Share (%), by Application 2025 & 2033
- Figure 24: Latin America Autonomous Ships Market Revenue (Million), by Country 2025 & 2033
- Figure 25: Latin America Autonomous Ships Market Revenue Share (%), by Country 2025 & 2033
- Figure 26: Middle East and Africa Autonomous Ships Market Revenue (Million), by Type 2025 & 2033
- Figure 27: Middle East and Africa Autonomous Ships Market Revenue Share (%), by Type 2025 & 2033
- Figure 28: Middle East and Africa Autonomous Ships Market Revenue (Million), by Application 2025 & 2033
- Figure 29: Middle East and Africa Autonomous Ships Market Revenue Share (%), by Application 2025 & 2033
- Figure 30: Middle East and Africa Autonomous Ships Market Revenue (Million), by Country 2025 & 2033
- Figure 31: Middle East and Africa Autonomous Ships Market Revenue Share (%), by Country 2025 & 2033
List of Tables
- Table 1: Global Autonomous Ships Market Revenue Million Forecast, by Type 2020 & 2033
- Table 2: Global Autonomous Ships Market Revenue Million Forecast, by Application 2020 & 2033
- Table 3: Global Autonomous Ships Market Revenue Million Forecast, by Region 2020 & 2033
- Table 4: Global Autonomous Ships Market Revenue Million Forecast, by Type 2020 & 2033
- Table 5: Global Autonomous Ships Market Revenue Million Forecast, by Application 2020 & 2033
- Table 6: Global Autonomous Ships Market Revenue Million Forecast, by Country 2020 & 2033
- Table 7: United States Autonomous Ships Market Revenue (Million) Forecast, by Application 2020 & 2033
- Table 8: Canada Autonomous Ships Market Revenue (Million) Forecast, by Application 2020 & 2033
- Table 9: Global Autonomous Ships Market Revenue Million Forecast, by Type 2020 & 2033
- Table 10: Global Autonomous Ships Market Revenue Million Forecast, by Application 2020 & 2033
- Table 11: Global Autonomous Ships Market Revenue Million Forecast, by Country 2020 & 2033
- Table 12: United Kingdom Autonomous Ships Market Revenue (Million) Forecast, by Application 2020 & 2033
- Table 13: Germany Autonomous Ships Market Revenue (Million) Forecast, by Application 2020 & 2033
- Table 14: France Autonomous Ships Market Revenue (Million) Forecast, by Application 2020 & 2033
- Table 15: Italy Autonomous Ships Market Revenue (Million) Forecast, by Application 2020 & 2033
- Table 16: Russia Autonomous Ships Market Revenue (Million) Forecast, by Application 2020 & 2033
- Table 17: Rest of Europe Autonomous Ships Market Revenue (Million) Forecast, by Application 2020 & 2033
- Table 18: Global Autonomous Ships Market Revenue Million Forecast, by Type 2020 & 2033
- Table 19: Global Autonomous Ships Market Revenue Million Forecast, by Application 2020 & 2033
- Table 20: Global Autonomous Ships Market Revenue Million Forecast, by Country 2020 & 2033
- Table 21: China Autonomous Ships Market Revenue (Million) Forecast, by Application 2020 & 2033
- Table 22: India Autonomous Ships Market Revenue (Million) Forecast, by Application 2020 & 2033
- Table 23: Japan Autonomous Ships Market Revenue (Million) Forecast, by Application 2020 & 2033
- Table 24: South Korea Autonomous Ships Market Revenue (Million) Forecast, by Application 2020 & 2033
- Table 25: Australia Autonomous Ships Market Revenue (Million) Forecast, by Application 2020 & 2033
- Table 26: Rest of Asia Pacific Autonomous Ships Market Revenue (Million) Forecast, by Application 2020 & 2033
- Table 27: Global Autonomous Ships Market Revenue Million Forecast, by Type 2020 & 2033
- Table 28: Global Autonomous Ships Market Revenue Million Forecast, by Application 2020 & 2033
- Table 29: Global Autonomous Ships Market Revenue Million Forecast, by Country 2020 & 2033
- Table 30: Brazil Autonomous Ships Market Revenue (Million) Forecast, by Application 2020 & 2033
- Table 31: Rest of Latin America Autonomous Ships Market Revenue (Million) Forecast, by Application 2020 & 2033
- Table 32: Global Autonomous Ships Market Revenue Million Forecast, by Type 2020 & 2033
- Table 33: Global Autonomous Ships Market Revenue Million Forecast, by Application 2020 & 2033
- Table 34: Global Autonomous Ships Market Revenue Million Forecast, by Country 2020 & 2033
- Table 35: Saudi Arabia Autonomous Ships Market Revenue (Million) Forecast, by Application 2020 & 2033
- Table 36: United Arab Emirates Autonomous Ships Market Revenue (Million) Forecast, by Application 2020 & 2033
- Table 37: Qatar Autonomous Ships Market Revenue (Million) Forecast, by Application 2020 & 2033
- Table 38: Egypt Autonomous Ships Market Revenue (Million) Forecast, by Application 2020 & 2033
- Table 39: South Africa Autonomous Ships Market Revenue (Million) Forecast, by Application 2020 & 2033
- Table 40: Rest of Middle East and Africa Autonomous Ships Market Revenue (Million) Forecast, by Application 2020 & 2033
Frequently Asked Questions
1. What is the projected Compound Annual Growth Rate (CAGR) of the Autonomous Ships Market?
The projected CAGR is approximately 7.30%.
2. Which companies are prominent players in the Autonomous Ships Market?
Key companies in the market include ABB Ltd, DNV AS, Wärtsilä Corporation, Nippon Yusen Kabushiki Kaisha (NYK Line), Fugr, Kongsberg Gruppen ASA, MITSUI E&S Co Ltd, Vigor Industrial LLC, Rolls-Royce plc, Praxis Automation Technology B V, Hanwha Corporation, HD Hyundai Heavy Industries Co Ltd.
3. What are the main segments of the Autonomous Ships Market?
The market segments include Type, Application.
4. Can you provide details about the market size?
The market size is estimated to be USD 8.38 Million as of 2022.
5. What are some drivers contributing to market growth?
N/A
6. What are the notable trends driving market growth?
The Commercial Segment of the Market is Anticipated to Register the Highest Growth During the Forecast Period.
7. Are there any restraints impacting market growth?
N/A
8. Can you provide examples of recent developments in the market?
February 2023: Austal USA delivered the US Navy its autonomous capable EPF 13 ship. Austal integrated an automated maintenance, health monitoring, and mission readiness capability into EPF 13. It will enable the vessel to operate for up to 30 days without human intervention in combination with existing highly automated hull, mechanical & electrical systems installed on EPF class vessels.
9. What pricing options are available for accessing the report?
Pricing options include single-user, multi-user, and enterprise licenses priced at USD 4750, USD 5250, and USD 8750 respectively.
10. Is the market size provided in terms of value or volume?
The market size is provided in terms of value, measured in Million.
11. Are there any specific market keywords associated with the report?
Yes, the market keyword associated with the report is "Autonomous Ships Market," which aids in identifying and referencing the specific market segment covered.
12. How do I determine which pricing option suits my needs best?
The pricing options vary based on user requirements and access needs. Individual users may opt for single-user licenses, while businesses requiring broader access may choose multi-user or enterprise licenses for cost-effective access to the report.
13. Are there any additional resources or data provided in the Autonomous Ships Market report?
While the report offers comprehensive insights, it's advisable to review the specific contents or supplementary materials provided to ascertain if additional resources or data are available.
14. How can I stay updated on further developments or reports in the Autonomous Ships Market?
To stay informed about further developments, trends, and reports in the Autonomous Ships Market, consider subscribing to industry newsletters, following relevant companies and organizations, or regularly checking reputable industry news sources and publications.
Methodology
Step 1 - Identification of Relevant Samples Size from Population Database


Step 2 - Approaches for Defining Global Market Size (Value, Volume* & Price*)

Note*: In applicable scenarios
Step 3 - Data Sources
Primary Research
- Web Analytics
- Survey Reports
- Research Institute
- Latest Research Reports
- Opinion Leaders
Secondary Research
- Annual Reports
- White Paper
- Latest Press Release
- Industry Association
- Paid Database
- Investor Presentations

Step 4 - Data Triangulation
Involves using different sources of information in order to increase the validity of a study
These sources are likely to be stakeholders in a program - participants, other researchers, program staff, other community members, and so on.
Then we put all data in single framework & apply various statistical tools to find out the dynamic on the market.
During the analysis stage, feedback from the stakeholder groups would be compared to determine areas of agreement as well as areas of divergence