

Key Insights
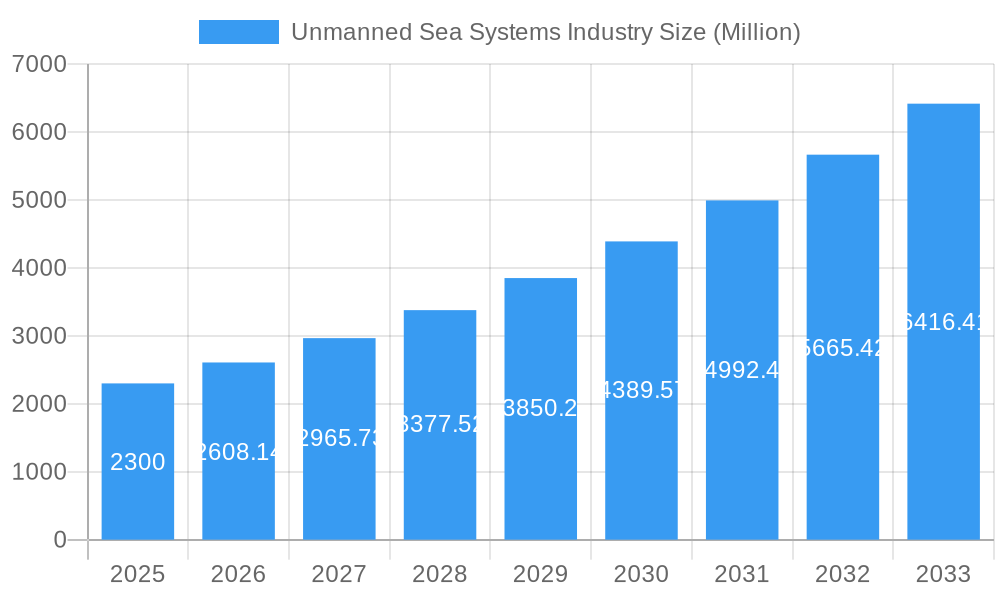
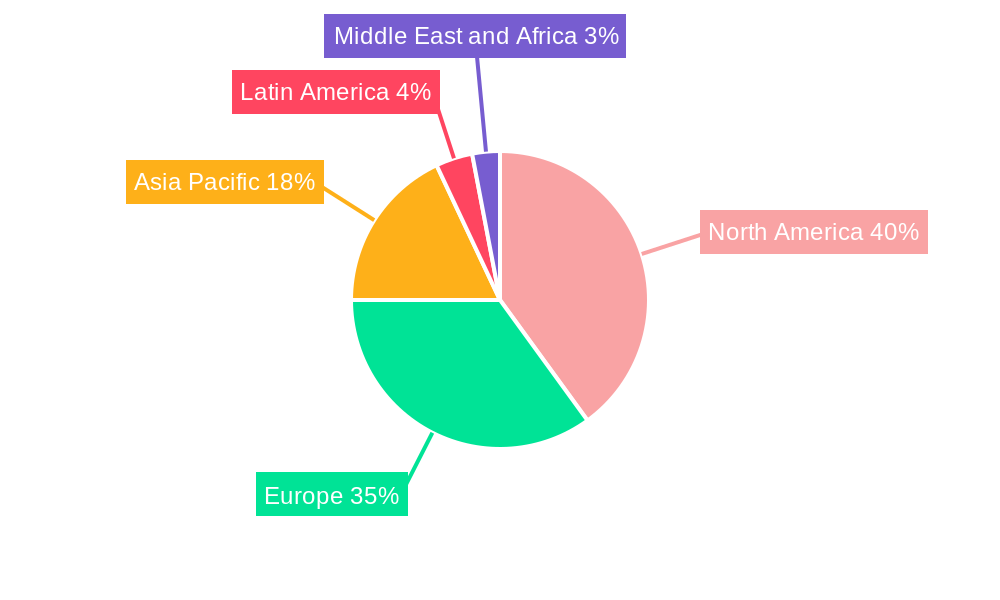
The Unmanned Sea Systems (USS) industry, encompassing Unmanned Underwater Vehicles (UUVs), Unmanned Surface Vehicles (USVs), and various capabilities (Remotely Operated Vehicles (ROVs) and Autonomous Vehicles (AVs)), is experiencing robust growth, projected to reach a market size of $2.3 billion in 2025 and maintain a Compound Annual Growth Rate (CAGR) of 13.78% from 2025 to 2033. This expansion is fueled by increasing defense budgets globally, the demand for enhanced maritime surveillance and security, and the rising adoption of autonomous systems for commercial applications like offshore energy exploration and oceanographic research. Technological advancements leading to improved sensor integration, extended operational endurance, and enhanced underwater navigation capabilities are further driving market growth. The diverse applications across military (anti-submarine warfare, mine countermeasures, intelligence gathering), commercial (oil and gas exploration, underwater infrastructure inspection, aquaculture), and other sectors (scientific research, environmental monitoring) contribute to the market's broad appeal. While the initial high capital investment for developing and deploying these systems presents a restraint, the long-term operational cost savings and strategic advantages are overcoming this barrier. North America and Europe are currently leading the market, however, the Asia-Pacific region shows significant potential for rapid growth driven by increasing investments in naval modernization and growing offshore activities.
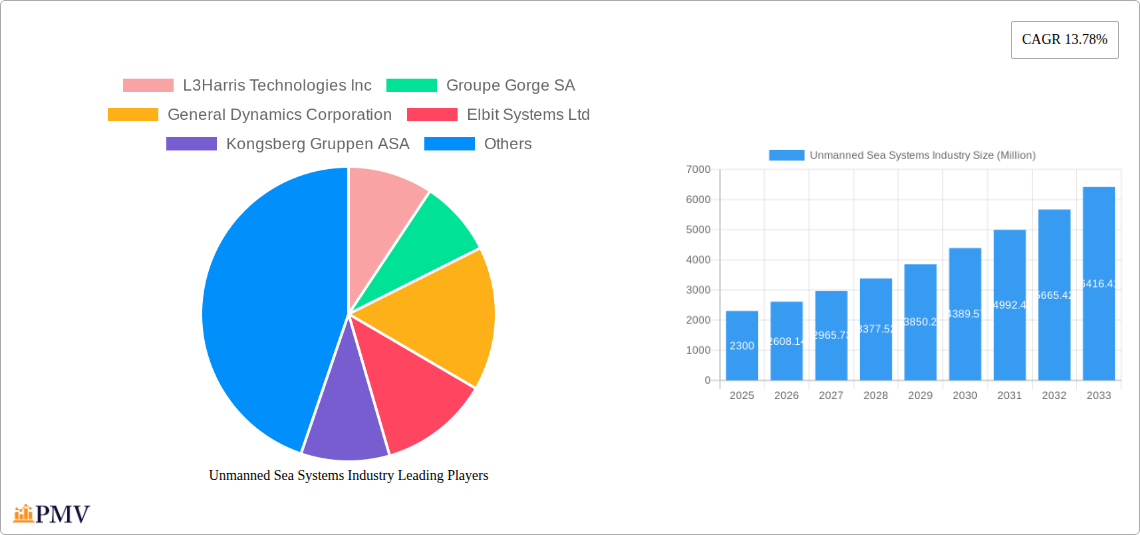
Unmanned Sea Systems Industry Market Size (In Billion)
The competitive landscape is characterized by both established defense contractors such as L3Harris Technologies, General Dynamics, and Lockheed Martin, and specialized smaller companies such as Maritime Robotics and Kongsberg Gruppen. These companies are actively engaged in research and development, focusing on improving system autonomy, payload capacity, and operational range. The market is expected to witness further consolidation through mergers and acquisitions as companies seek to expand their product portfolios and global reach. The increasing collaboration between private companies and government agencies to develop and implement advanced USS technologies is further shaping the future of the industry, fostering innovation and accelerating market growth. The continued refinement of autonomous navigation systems, coupled with advancements in artificial intelligence and machine learning, will be key factors in driving future market expansion.
Unmanned Sea Systems Industry Company Market Share
Unmanned Sea Systems Industry: A Comprehensive Market Report (2019-2033)
This comprehensive report provides an in-depth analysis of the Unmanned Sea Systems industry, encompassing market size, segmentation, competitive landscape, and future growth projections from 2019 to 2033. The study period covers the historical period (2019-2024), the base year (2025), and the forecast period (2025-2033), with a focus on the estimated year 2025. The report is crucial for industry stakeholders, investors, and researchers seeking actionable insights into this rapidly evolving sector.
Unmanned Sea Systems Industry Market Structure & Competitive Dynamics
The Unmanned Sea Systems (USS) market exhibits a moderately concentrated structure, with a handful of major players dominating the landscape. These players, including L3Harris Technologies Inc, Groupe Gorge SA, General Dynamics Corporation, Elbit Systems Ltd, Kongsberg Gruppen ASA, Lockheed Martin Corporation, Maritime Robotics AS, Teledyne Technologies Incorporated, thyssenkrupp AG, BAE Systems plc, Saab AB, and The Boeing Company, compete based on technological innovation, product capabilities, and customer relationships. Market share is highly dynamic, influenced by ongoing R&D investments, strategic partnerships, and M&A activities. The total market size in 2025 is estimated at xx Million USD.
- Market Concentration: The top 5 players account for an estimated xx% of the global market share in 2025.
- Innovation Ecosystems: Significant collaborations between defense contractors, technology startups, and research institutions drive technological advancements.
- Regulatory Frameworks: Stringent safety and security regulations, varying across different regions, impact product development and deployment.
- Product Substitutes: Limited direct substitutes exist; however, conventional manned systems remain a competitive alternative in certain applications.
- End-User Trends: Increasing demand for autonomous systems and cost-effective solutions across military and commercial sectors is driving growth.
- M&A Activities: The past five years have witnessed xx M&A deals, with an estimated total value of xx Million USD, reflecting consolidation and expansion strategies among industry players. These transactions often involve the acquisition of smaller companies with specialized technologies.
Unmanned Sea Systems Industry Industry Trends & Insights
The Unmanned Sea Systems market is experiencing robust growth, driven by a confluence of factors. Technological advancements, particularly in autonomous navigation, sensor integration, and AI-powered decision-making, are significantly enhancing the capabilities and operational efficiency of unmanned systems. This, coupled with increasing defense budgets globally and the rising adoption of USVs and UUVs for commercial applications (oceanographic research, offshore energy exploration, etc.), fuels impressive growth. The market is expected to exhibit a CAGR of xx% during the forecast period (2025-2033), reaching an estimated xx Million USD by 2033. Market penetration is particularly high in military applications, with commercial adoption steadily increasing.
Dominant Markets & Segments in Unmanned Sea Systems Industry
The North American market currently holds a dominant position in the Unmanned Sea Systems industry, driven by substantial defense spending and a strong technological base. However, the Asia-Pacific region is emerging as a significant growth area, fueled by increasing defense modernization efforts and the rising adoption of unmanned systems in various commercial applications.
- Type: Both Unmanned Underwater Vehicles (UUVs) and Unmanned Surface Vehicles (USVs) are experiencing robust growth, with UUVs holding a slightly larger market share due to their diverse applications in defense and scientific research.
- Capability: Autonomous vehicles are witnessing faster growth compared to Remotely Operated Vehicles (ROVs), reflecting a shift towards greater operational independence and reduced reliance on human intervention.
- Application: Military applications account for the largest share, driven by the need for improved surveillance, reconnaissance, and mine countermeasures. However, the commercial sector is growing rapidly, driven by increasing demand in various sectors such as maritime security, oceanographic research, and offshore oil and gas exploration.
Key Drivers:
- North America: High defense spending, strong technological innovation, and supportive regulatory environment.
- Asia-Pacific: Rising defense budgets, increasing focus on maritime security, and growing commercial applications.
Unmanned Sea Systems Industry Product Innovations
Recent innovations include advancements in AI-powered autonomy, enhanced sensor integration for improved situational awareness, and the development of hybrid USV/UUV platforms offering enhanced operational flexibility. The focus is on miniaturization, increased endurance, improved communication capabilities, and the incorporation of advanced materials for enhanced durability and stealth capabilities. These innovations cater to the increasing demand for more versatile, reliable, and cost-effective unmanned sea systems across various applications.
Report Segmentation & Scope
This report segments the Unmanned Sea Systems market across various parameters:
- By Type: Unmanned Underwater Vehicles (UUVs) – Projected market size xx Million USD in 2025; Unmanned Surface Vehicles (USVs) – Projected market size xx Million USD in 2025. Both segments exhibit strong growth potential, with UUVs slightly outpacing USVs.
- By Capability: Remotely Operated Vehicles (ROVs) and Autonomous Vehicles – Autonomous vehicles represent the faster-growing segment, driven by advancements in AI and automation technologies.
- By Application: Military, Commercial, and Other Applications – Military applications dominate the market share, but commercial applications show considerable growth potential.
Each segment is analyzed in detail, including growth projections, market size estimates, and competitive dynamics.
Key Drivers of Unmanned Sea Systems Industry Growth
Several factors propel the growth of the Unmanned Sea Systems industry: Increased defense spending globally, particularly in maritime security, fuels demand for advanced surveillance and reconnaissance capabilities. Technological advancements in AI, autonomy, and sensor technology lead to more sophisticated and reliable unmanned systems. The growing need for cost-effective solutions in commercial applications like offshore operations and marine research further drives market expansion. Supportive government policies and initiatives promoting the adoption of autonomous technologies also contribute to growth.
Challenges in the Unmanned Sea Systems Industry Sector
Key challenges include high initial investment costs for developing and deploying unmanned systems, stringent regulatory hurdles surrounding their operation in various maritime environments, and the potential for supply chain disruptions impacting the availability of crucial components. Furthermore, cybersecurity concerns related to autonomous systems and the need for robust communication infrastructure pose significant obstacles. These challenges can negatively impact market growth if not properly addressed.
Leading Players in the Unmanned Sea Systems Industry Market
- L3Harris Technologies Inc L3Harris Technologies Inc
- Groupe Gorge SA
- General Dynamics Corporation General Dynamics Corporation
- Elbit Systems Ltd Elbit Systems Ltd
- Kongsberg Gruppen ASA Kongsberg Gruppen ASA
- Lockheed Martin Corporation Lockheed Martin Corporation
- Maritime Robotics AS
- Teledyne Technologies Incorporated Teledyne Technologies Incorporated
- thyssenkrupp AG thyssenkrupp AG
- BAE Systems plc BAE Systems plc
- Saab AB Saab AB
- The Boeing Company The Boeing Company
Key Developments in Unmanned Sea Systems Industry Sector
- September 2023: HII received a FAR-based contract from the US Navy for USD 19 Million with a ceiling of USD 347 Million to begin shipments of the REMUS 300 to PMS 408 by September 2024, with ongoing technology advancements and deliveries through 2028. This significantly boosts the market for UUVs.
- October 2023: The Naval Sea Systems Command, Washington, DC, signed a modification contract with Lockheed Martin Corporation to provide engineering support for Extra Large Unmanned Undersea Vehicle (UUV). The value of the contract was USD 11 Million, and it will be completed by September 2024. This highlights the growing importance of large-scale UUV deployments.
Strategic Unmanned Sea Systems Industry Market Outlook
The Unmanned Sea Systems market is poised for sustained growth, driven by technological advancements, increasing defense spending, and the expansion of commercial applications. Strategic opportunities exist for companies focused on developing innovative autonomous systems, enhancing sensor technologies, and improving the reliability and affordability of unmanned platforms. Focusing on specific niche applications and establishing strategic partnerships across the value chain will be crucial for success in this dynamic market.
Unmanned Sea Systems Industry Segmentation
- 1. Production Analysis
- 2. Consumption Analysis
- 3. Import Market Analysis (Value & Volume)
- 4. Export Market Analysis (Value & Volume)
- 5. Price Trend Analysis
Unmanned Sea Systems Industry Segmentation By Geography
-
1. North America
- 1.1. United States
- 1.2. Canada
- 1.3. Mexico
-
2. South America
- 2.1. Brazil
- 2.2. Argentina
- 2.3. Rest of South America
-
3. Europe
- 3.1. United Kingdom
- 3.2. Germany
- 3.3. France
- 3.4. Italy
- 3.5. Spain
- 3.6. Russia
- 3.7. Benelux
- 3.8. Nordics
- 3.9. Rest of Europe
-
4. Middle East & Africa
- 4.1. Turkey
- 4.2. Israel
- 4.3. GCC
- 4.4. North Africa
- 4.5. South Africa
- 4.6. Rest of Middle East & Africa
-
5. Asia Pacific
- 5.1. China
- 5.2. India
- 5.3. Japan
- 5.4. South Korea
- 5.5. ASEAN
- 5.6. Oceania
- 5.7. Rest of Asia Pacific
Unmanned Sea Systems Industry Regional Market Share
Geographic Coverage of Unmanned Sea Systems Industry
Unmanned Sea Systems Industry REPORT HIGHLIGHTS
| Aspects | Details |
|---|---|
| Study Period | 2020-2034 |
| Base Year | 2025 |
| Estimated Year | 2026 |
| Forecast Period | 2026-2034 |
| Historical Period | 2020-2025 |
| Growth Rate | CAGR of 13.78% from 2020-2034 |
| Segmentation |
|
Table of Contents
- 1. Introduction
- 1.1. Research Scope
- 1.2. Market Segmentation
- 1.3. Research Objective
- 1.4. Definitions and Assumptions
- 2. Executive Summary
- 2.1. Market Snapshot
- 3. Market Dynamics
- 3.1. Market Drivers
- 3.2. Market Restrains
- 3.3. Market Trends
- 3.4. Market Opportunities
- 4. Market Factor Analysis
- 4.1. Porters Five Forces
- 4.1.1. Bargaining Power of Suppliers
- 4.1.2. Bargaining Power of Buyers
- 4.1.3. Threat of New Entrants
- 4.1.4. Threat of Substitutes
- 4.1.5. Competitive Rivalry
- 4.2. PESTEL analysis
- 4.3. BCG Analysis
- 4.3.1. Stars (High Growth, High Market Share)
- 4.3.2. Cash Cows (Low Growth, High Market Share)
- 4.3.3. Question Mark (High Growth, Low Market Share)
- 4.3.4. Dogs (Low Growth, Low Market Share)
- 4.4. Ansoff Matrix Analysis
- 4.5. Supply Chain Analysis
- 4.6. Regulatory Landscape
- 4.7. Current Market Potential and Opportunity Assessment (TAM–SAM–SOM Framework)
- 4.8. PMV Analyst Note
- 4.1. Porters Five Forces
- 5. Market Analysis, Insights and Forecast 2021-2033
- 5.1. Market Analysis, Insights and Forecast - by Production Analysis
- 5.2. Market Analysis, Insights and Forecast - by Consumption Analysis
- 5.3. Market Analysis, Insights and Forecast - by Import Market Analysis (Value & Volume)
- 5.4. Market Analysis, Insights and Forecast - by Export Market Analysis (Value & Volume)
- 5.5. Market Analysis, Insights and Forecast - by Price Trend Analysis
- 5.6. Market Analysis, Insights and Forecast - by Region
- 5.6.1. North America
- 5.6.2. South America
- 5.6.3. Europe
- 5.6.4. Middle East & Africa
- 5.6.5. Asia Pacific
- 6. Global Unmanned Sea Systems Industry Analysis, Insights and Forecast, 2021-2033
- 6.1. Market Analysis, Insights and Forecast - by Production Analysis
- 6.2. Market Analysis, Insights and Forecast - by Consumption Analysis
- 6.3. Market Analysis, Insights and Forecast - by Import Market Analysis (Value & Volume)
- 6.4. Market Analysis, Insights and Forecast - by Export Market Analysis (Value & Volume)
- 6.5. Market Analysis, Insights and Forecast - by Price Trend Analysis
- 7. North America Unmanned Sea Systems Industry Analysis, Insights and Forecast, 2020-2032
- 7.1. Market Analysis, Insights and Forecast - by Production Analysis
- 7.2. Market Analysis, Insights and Forecast - by Consumption Analysis
- 7.3. Market Analysis, Insights and Forecast - by Import Market Analysis (Value & Volume)
- 7.4. Market Analysis, Insights and Forecast - by Export Market Analysis (Value & Volume)
- 7.5. Market Analysis, Insights and Forecast - by Price Trend Analysis
- 8. South America Unmanned Sea Systems Industry Analysis, Insights and Forecast, 2020-2032
- 8.1. Market Analysis, Insights and Forecast - by Production Analysis
- 8.2. Market Analysis, Insights and Forecast - by Consumption Analysis
- 8.3. Market Analysis, Insights and Forecast - by Import Market Analysis (Value & Volume)
- 8.4. Market Analysis, Insights and Forecast - by Export Market Analysis (Value & Volume)
- 8.5. Market Analysis, Insights and Forecast - by Price Trend Analysis
- 9. Europe Unmanned Sea Systems Industry Analysis, Insights and Forecast, 2020-2032
- 9.1. Market Analysis, Insights and Forecast - by Production Analysis
- 9.2. Market Analysis, Insights and Forecast - by Consumption Analysis
- 9.3. Market Analysis, Insights and Forecast - by Import Market Analysis (Value & Volume)
- 9.4. Market Analysis, Insights and Forecast - by Export Market Analysis (Value & Volume)
- 9.5. Market Analysis, Insights and Forecast - by Price Trend Analysis
- 10. Middle East & Africa Unmanned Sea Systems Industry Analysis, Insights and Forecast, 2020-2032
- 10.1. Market Analysis, Insights and Forecast - by Production Analysis
- 10.2. Market Analysis, Insights and Forecast - by Consumption Analysis
- 10.3. Market Analysis, Insights and Forecast - by Import Market Analysis (Value & Volume)
- 10.4. Market Analysis, Insights and Forecast - by Export Market Analysis (Value & Volume)
- 10.5. Market Analysis, Insights and Forecast - by Price Trend Analysis
- 11. Asia Pacific Unmanned Sea Systems Industry Analysis, Insights and Forecast, 2020-2032
- 11.1. Market Analysis, Insights and Forecast - by Production Analysis
- 11.2. Market Analysis, Insights and Forecast - by Consumption Analysis
- 11.3. Market Analysis, Insights and Forecast - by Import Market Analysis (Value & Volume)
- 11.4. Market Analysis, Insights and Forecast - by Export Market Analysis (Value & Volume)
- 11.5. Market Analysis, Insights and Forecast - by Price Trend Analysis
- 12. Competitive Analysis
- 12.1. Company Profiles
- 12.1.1 L3Harris Technologies Inc
- 12.1.1.1. Company Overview
- 12.1.1.2. Products
- 12.1.1.3. Company Financials
- 12.1.1.4. SWOT Analysis
- 12.1.2 Groupe Gorge SA
- 12.1.2.1. Company Overview
- 12.1.2.2. Products
- 12.1.2.3. Company Financials
- 12.1.2.4. SWOT Analysis
- 12.1.3 General Dynamics Corporation
- 12.1.3.1. Company Overview
- 12.1.3.2. Products
- 12.1.3.3. Company Financials
- 12.1.3.4. SWOT Analysis
- 12.1.4 Elbit Systems Ltd
- 12.1.4.1. Company Overview
- 12.1.4.2. Products
- 12.1.4.3. Company Financials
- 12.1.4.4. SWOT Analysis
- 12.1.5 Kongsberg Gruppen ASA
- 12.1.5.1. Company Overview
- 12.1.5.2. Products
- 12.1.5.3. Company Financials
- 12.1.5.4. SWOT Analysis
- 12.1.6 Lockheed Martin Corporation
- 12.1.6.1. Company Overview
- 12.1.6.2. Products
- 12.1.6.3. Company Financials
- 12.1.6.4. SWOT Analysis
- 12.1.7 Maritime Robotics AS
- 12.1.7.1. Company Overview
- 12.1.7.2. Products
- 12.1.7.3. Company Financials
- 12.1.7.4. SWOT Analysis
- 12.1.8 Teledyne Technologies Incorporated
- 12.1.8.1. Company Overview
- 12.1.8.2. Products
- 12.1.8.3. Company Financials
- 12.1.8.4. SWOT Analysis
- 12.1.9 thyssenkrupp AG
- 12.1.9.1. Company Overview
- 12.1.9.2. Products
- 12.1.9.3. Company Financials
- 12.1.9.4. SWOT Analysis
- 12.1.10 BAE Systems plc
- 12.1.10.1. Company Overview
- 12.1.10.2. Products
- 12.1.10.3. Company Financials
- 12.1.10.4. SWOT Analysis
- 12.1.11 Saab AB
- 12.1.11.1. Company Overview
- 12.1.11.2. Products
- 12.1.11.3. Company Financials
- 12.1.11.4. SWOT Analysis
- 12.1.12 The Boeing Company
- 12.1.12.1. Company Overview
- 12.1.12.2. Products
- 12.1.12.3. Company Financials
- 12.1.12.4. SWOT Analysis
- 12.1.1 L3Harris Technologies Inc
- 12.2. Market Entropy
- 12.2.1 Company's Key Areas Served
- 12.2.2 Recent Developments
- 12.3. Company Market Share Analysis 2025
- 12.3.1 Top 5 Companies Market Share Analysis
- 12.3.2 Top 3 Companies Market Share Analysis
- 12.4. List of Potential Customers
- 13. Research Methodology
List of Figures
- Figure 1: Global Unmanned Sea Systems Industry Revenue Breakdown (Million, %) by Region 2025 & 2033
- Figure 2: North America Unmanned Sea Systems Industry Revenue (Million), by Production Analysis 2025 & 2033
- Figure 3: North America Unmanned Sea Systems Industry Revenue Share (%), by Production Analysis 2025 & 2033
- Figure 4: North America Unmanned Sea Systems Industry Revenue (Million), by Consumption Analysis 2025 & 2033
- Figure 5: North America Unmanned Sea Systems Industry Revenue Share (%), by Consumption Analysis 2025 & 2033
- Figure 6: North America Unmanned Sea Systems Industry Revenue (Million), by Import Market Analysis (Value & Volume) 2025 & 2033
- Figure 7: North America Unmanned Sea Systems Industry Revenue Share (%), by Import Market Analysis (Value & Volume) 2025 & 2033
- Figure 8: North America Unmanned Sea Systems Industry Revenue (Million), by Export Market Analysis (Value & Volume) 2025 & 2033
- Figure 9: North America Unmanned Sea Systems Industry Revenue Share (%), by Export Market Analysis (Value & Volume) 2025 & 2033
- Figure 10: North America Unmanned Sea Systems Industry Revenue (Million), by Price Trend Analysis 2025 & 2033
- Figure 11: North America Unmanned Sea Systems Industry Revenue Share (%), by Price Trend Analysis 2025 & 2033
- Figure 12: North America Unmanned Sea Systems Industry Revenue (Million), by Country 2025 & 2033
- Figure 13: North America Unmanned Sea Systems Industry Revenue Share (%), by Country 2025 & 2033
- Figure 14: South America Unmanned Sea Systems Industry Revenue (Million), by Production Analysis 2025 & 2033
- Figure 15: South America Unmanned Sea Systems Industry Revenue Share (%), by Production Analysis 2025 & 2033
- Figure 16: South America Unmanned Sea Systems Industry Revenue (Million), by Consumption Analysis 2025 & 2033
- Figure 17: South America Unmanned Sea Systems Industry Revenue Share (%), by Consumption Analysis 2025 & 2033
- Figure 18: South America Unmanned Sea Systems Industry Revenue (Million), by Import Market Analysis (Value & Volume) 2025 & 2033
- Figure 19: South America Unmanned Sea Systems Industry Revenue Share (%), by Import Market Analysis (Value & Volume) 2025 & 2033
- Figure 20: South America Unmanned Sea Systems Industry Revenue (Million), by Export Market Analysis (Value & Volume) 2025 & 2033
- Figure 21: South America Unmanned Sea Systems Industry Revenue Share (%), by Export Market Analysis (Value & Volume) 2025 & 2033
- Figure 22: South America Unmanned Sea Systems Industry Revenue (Million), by Price Trend Analysis 2025 & 2033
- Figure 23: South America Unmanned Sea Systems Industry Revenue Share (%), by Price Trend Analysis 2025 & 2033
- Figure 24: South America Unmanned Sea Systems Industry Revenue (Million), by Country 2025 & 2033
- Figure 25: South America Unmanned Sea Systems Industry Revenue Share (%), by Country 2025 & 2033
- Figure 26: Europe Unmanned Sea Systems Industry Revenue (Million), by Production Analysis 2025 & 2033
- Figure 27: Europe Unmanned Sea Systems Industry Revenue Share (%), by Production Analysis 2025 & 2033
- Figure 28: Europe Unmanned Sea Systems Industry Revenue (Million), by Consumption Analysis 2025 & 2033
- Figure 29: Europe Unmanned Sea Systems Industry Revenue Share (%), by Consumption Analysis 2025 & 2033
- Figure 30: Europe Unmanned Sea Systems Industry Revenue (Million), by Import Market Analysis (Value & Volume) 2025 & 2033
- Figure 31: Europe Unmanned Sea Systems Industry Revenue Share (%), by Import Market Analysis (Value & Volume) 2025 & 2033
- Figure 32: Europe Unmanned Sea Systems Industry Revenue (Million), by Export Market Analysis (Value & Volume) 2025 & 2033
- Figure 33: Europe Unmanned Sea Systems Industry Revenue Share (%), by Export Market Analysis (Value & Volume) 2025 & 2033
- Figure 34: Europe Unmanned Sea Systems Industry Revenue (Million), by Price Trend Analysis 2025 & 2033
- Figure 35: Europe Unmanned Sea Systems Industry Revenue Share (%), by Price Trend Analysis 2025 & 2033
- Figure 36: Europe Unmanned Sea Systems Industry Revenue (Million), by Country 2025 & 2033
- Figure 37: Europe Unmanned Sea Systems Industry Revenue Share (%), by Country 2025 & 2033
- Figure 38: Middle East & Africa Unmanned Sea Systems Industry Revenue (Million), by Production Analysis 2025 & 2033
- Figure 39: Middle East & Africa Unmanned Sea Systems Industry Revenue Share (%), by Production Analysis 2025 & 2033
- Figure 40: Middle East & Africa Unmanned Sea Systems Industry Revenue (Million), by Consumption Analysis 2025 & 2033
- Figure 41: Middle East & Africa Unmanned Sea Systems Industry Revenue Share (%), by Consumption Analysis 2025 & 2033
- Figure 42: Middle East & Africa Unmanned Sea Systems Industry Revenue (Million), by Import Market Analysis (Value & Volume) 2025 & 2033
- Figure 43: Middle East & Africa Unmanned Sea Systems Industry Revenue Share (%), by Import Market Analysis (Value & Volume) 2025 & 2033
- Figure 44: Middle East & Africa Unmanned Sea Systems Industry Revenue (Million), by Export Market Analysis (Value & Volume) 2025 & 2033
- Figure 45: Middle East & Africa Unmanned Sea Systems Industry Revenue Share (%), by Export Market Analysis (Value & Volume) 2025 & 2033
- Figure 46: Middle East & Africa Unmanned Sea Systems Industry Revenue (Million), by Price Trend Analysis 2025 & 2033
- Figure 47: Middle East & Africa Unmanned Sea Systems Industry Revenue Share (%), by Price Trend Analysis 2025 & 2033
- Figure 48: Middle East & Africa Unmanned Sea Systems Industry Revenue (Million), by Country 2025 & 2033
- Figure 49: Middle East & Africa Unmanned Sea Systems Industry Revenue Share (%), by Country 2025 & 2033
- Figure 50: Asia Pacific Unmanned Sea Systems Industry Revenue (Million), by Production Analysis 2025 & 2033
- Figure 51: Asia Pacific Unmanned Sea Systems Industry Revenue Share (%), by Production Analysis 2025 & 2033
- Figure 52: Asia Pacific Unmanned Sea Systems Industry Revenue (Million), by Consumption Analysis 2025 & 2033
- Figure 53: Asia Pacific Unmanned Sea Systems Industry Revenue Share (%), by Consumption Analysis 2025 & 2033
- Figure 54: Asia Pacific Unmanned Sea Systems Industry Revenue (Million), by Import Market Analysis (Value & Volume) 2025 & 2033
- Figure 55: Asia Pacific Unmanned Sea Systems Industry Revenue Share (%), by Import Market Analysis (Value & Volume) 2025 & 2033
- Figure 56: Asia Pacific Unmanned Sea Systems Industry Revenue (Million), by Export Market Analysis (Value & Volume) 2025 & 2033
- Figure 57: Asia Pacific Unmanned Sea Systems Industry Revenue Share (%), by Export Market Analysis (Value & Volume) 2025 & 2033
- Figure 58: Asia Pacific Unmanned Sea Systems Industry Revenue (Million), by Price Trend Analysis 2025 & 2033
- Figure 59: Asia Pacific Unmanned Sea Systems Industry Revenue Share (%), by Price Trend Analysis 2025 & 2033
- Figure 60: Asia Pacific Unmanned Sea Systems Industry Revenue (Million), by Country 2025 & 2033
- Figure 61: Asia Pacific Unmanned Sea Systems Industry Revenue Share (%), by Country 2025 & 2033
List of Tables
- Table 1: Global Unmanned Sea Systems Industry Revenue Million Forecast, by Production Analysis 2020 & 2033
- Table 2: Global Unmanned Sea Systems Industry Revenue Million Forecast, by Consumption Analysis 2020 & 2033
- Table 3: Global Unmanned Sea Systems Industry Revenue Million Forecast, by Import Market Analysis (Value & Volume) 2020 & 2033
- Table 4: Global Unmanned Sea Systems Industry Revenue Million Forecast, by Export Market Analysis (Value & Volume) 2020 & 2033
- Table 5: Global Unmanned Sea Systems Industry Revenue Million Forecast, by Price Trend Analysis 2020 & 2033
- Table 6: Global Unmanned Sea Systems Industry Revenue Million Forecast, by Region 2020 & 2033
- Table 7: Global Unmanned Sea Systems Industry Revenue Million Forecast, by Production Analysis 2020 & 2033
- Table 8: Global Unmanned Sea Systems Industry Revenue Million Forecast, by Consumption Analysis 2020 & 2033
- Table 9: Global Unmanned Sea Systems Industry Revenue Million Forecast, by Import Market Analysis (Value & Volume) 2020 & 2033
- Table 10: Global Unmanned Sea Systems Industry Revenue Million Forecast, by Export Market Analysis (Value & Volume) 2020 & 2033
- Table 11: Global Unmanned Sea Systems Industry Revenue Million Forecast, by Price Trend Analysis 2020 & 2033
- Table 12: Global Unmanned Sea Systems Industry Revenue Million Forecast, by Country 2020 & 2033
- Table 13: United States Unmanned Sea Systems Industry Revenue (Million) Forecast, by Application 2020 & 2033
- Table 14: Canada Unmanned Sea Systems Industry Revenue (Million) Forecast, by Application 2020 & 2033
- Table 15: Mexico Unmanned Sea Systems Industry Revenue (Million) Forecast, by Application 2020 & 2033
- Table 16: Global Unmanned Sea Systems Industry Revenue Million Forecast, by Production Analysis 2020 & 2033
- Table 17: Global Unmanned Sea Systems Industry Revenue Million Forecast, by Consumption Analysis 2020 & 2033
- Table 18: Global Unmanned Sea Systems Industry Revenue Million Forecast, by Import Market Analysis (Value & Volume) 2020 & 2033
- Table 19: Global Unmanned Sea Systems Industry Revenue Million Forecast, by Export Market Analysis (Value & Volume) 2020 & 2033
- Table 20: Global Unmanned Sea Systems Industry Revenue Million Forecast, by Price Trend Analysis 2020 & 2033
- Table 21: Global Unmanned Sea Systems Industry Revenue Million Forecast, by Country 2020 & 2033
- Table 22: Brazil Unmanned Sea Systems Industry Revenue (Million) Forecast, by Application 2020 & 2033
- Table 23: Argentina Unmanned Sea Systems Industry Revenue (Million) Forecast, by Application 2020 & 2033
- Table 24: Rest of South America Unmanned Sea Systems Industry Revenue (Million) Forecast, by Application 2020 & 2033
- Table 25: Global Unmanned Sea Systems Industry Revenue Million Forecast, by Production Analysis 2020 & 2033
- Table 26: Global Unmanned Sea Systems Industry Revenue Million Forecast, by Consumption Analysis 2020 & 2033
- Table 27: Global Unmanned Sea Systems Industry Revenue Million Forecast, by Import Market Analysis (Value & Volume) 2020 & 2033
- Table 28: Global Unmanned Sea Systems Industry Revenue Million Forecast, by Export Market Analysis (Value & Volume) 2020 & 2033
- Table 29: Global Unmanned Sea Systems Industry Revenue Million Forecast, by Price Trend Analysis 2020 & 2033
- Table 30: Global Unmanned Sea Systems Industry Revenue Million Forecast, by Country 2020 & 2033
- Table 31: United Kingdom Unmanned Sea Systems Industry Revenue (Million) Forecast, by Application 2020 & 2033
- Table 32: Germany Unmanned Sea Systems Industry Revenue (Million) Forecast, by Application 2020 & 2033
- Table 33: France Unmanned Sea Systems Industry Revenue (Million) Forecast, by Application 2020 & 2033
- Table 34: Italy Unmanned Sea Systems Industry Revenue (Million) Forecast, by Application 2020 & 2033
- Table 35: Spain Unmanned Sea Systems Industry Revenue (Million) Forecast, by Application 2020 & 2033
- Table 36: Russia Unmanned Sea Systems Industry Revenue (Million) Forecast, by Application 2020 & 2033
- Table 37: Benelux Unmanned Sea Systems Industry Revenue (Million) Forecast, by Application 2020 & 2033
- Table 38: Nordics Unmanned Sea Systems Industry Revenue (Million) Forecast, by Application 2020 & 2033
- Table 39: Rest of Europe Unmanned Sea Systems Industry Revenue (Million) Forecast, by Application 2020 & 2033
- Table 40: Global Unmanned Sea Systems Industry Revenue Million Forecast, by Production Analysis 2020 & 2033
- Table 41: Global Unmanned Sea Systems Industry Revenue Million Forecast, by Consumption Analysis 2020 & 2033
- Table 42: Global Unmanned Sea Systems Industry Revenue Million Forecast, by Import Market Analysis (Value & Volume) 2020 & 2033
- Table 43: Global Unmanned Sea Systems Industry Revenue Million Forecast, by Export Market Analysis (Value & Volume) 2020 & 2033
- Table 44: Global Unmanned Sea Systems Industry Revenue Million Forecast, by Price Trend Analysis 2020 & 2033
- Table 45: Global Unmanned Sea Systems Industry Revenue Million Forecast, by Country 2020 & 2033
- Table 46: Turkey Unmanned Sea Systems Industry Revenue (Million) Forecast, by Application 2020 & 2033
- Table 47: Israel Unmanned Sea Systems Industry Revenue (Million) Forecast, by Application 2020 & 2033
- Table 48: GCC Unmanned Sea Systems Industry Revenue (Million) Forecast, by Application 2020 & 2033
- Table 49: North Africa Unmanned Sea Systems Industry Revenue (Million) Forecast, by Application 2020 & 2033
- Table 50: South Africa Unmanned Sea Systems Industry Revenue (Million) Forecast, by Application 2020 & 2033
- Table 51: Rest of Middle East & Africa Unmanned Sea Systems Industry Revenue (Million) Forecast, by Application 2020 & 2033
- Table 52: Global Unmanned Sea Systems Industry Revenue Million Forecast, by Production Analysis 2020 & 2033
- Table 53: Global Unmanned Sea Systems Industry Revenue Million Forecast, by Consumption Analysis 2020 & 2033
- Table 54: Global Unmanned Sea Systems Industry Revenue Million Forecast, by Import Market Analysis (Value & Volume) 2020 & 2033
- Table 55: Global Unmanned Sea Systems Industry Revenue Million Forecast, by Export Market Analysis (Value & Volume) 2020 & 2033
- Table 56: Global Unmanned Sea Systems Industry Revenue Million Forecast, by Price Trend Analysis 2020 & 2033
- Table 57: Global Unmanned Sea Systems Industry Revenue Million Forecast, by Country 2020 & 2033
- Table 58: China Unmanned Sea Systems Industry Revenue (Million) Forecast, by Application 2020 & 2033
- Table 59: India Unmanned Sea Systems Industry Revenue (Million) Forecast, by Application 2020 & 2033
- Table 60: Japan Unmanned Sea Systems Industry Revenue (Million) Forecast, by Application 2020 & 2033
- Table 61: South Korea Unmanned Sea Systems Industry Revenue (Million) Forecast, by Application 2020 & 2033
- Table 62: ASEAN Unmanned Sea Systems Industry Revenue (Million) Forecast, by Application 2020 & 2033
- Table 63: Oceania Unmanned Sea Systems Industry Revenue (Million) Forecast, by Application 2020 & 2033
- Table 64: Rest of Asia Pacific Unmanned Sea Systems Industry Revenue (Million) Forecast, by Application 2020 & 2033
Frequently Asked Questions
1. What is the projected Compound Annual Growth Rate (CAGR) of the Unmanned Sea Systems Industry?
The projected CAGR is approximately 13.78%.
2. Which companies are prominent players in the Unmanned Sea Systems Industry?
Key companies in the market include L3Harris Technologies Inc, Groupe Gorge SA, General Dynamics Corporation, Elbit Systems Ltd, Kongsberg Gruppen ASA, Lockheed Martin Corporation, Maritime Robotics AS, Teledyne Technologies Incorporated, thyssenkrupp AG, BAE Systems plc, Saab AB, The Boeing Company.
3. What are the main segments of the Unmanned Sea Systems Industry?
The market segments include Production Analysis, Consumption Analysis, Import Market Analysis (Value & Volume), Export Market Analysis (Value & Volume), Price Trend Analysis.
4. Can you provide details about the market size?
The market size is estimated to be USD 2.30 Million as of 2022.
5. What are some drivers contributing to market growth?
Increase in Internet of Things (IoT) and Autonomous Systems; Rise in Demand for Military and Defense Satellite Communication Solutions.
6. What are the notable trends driving market growth?
Remotely Operated Vehicles (ROVs) Segment Will Showcase Significant Growth During the Forecast Period.
7. Are there any restraints impacting market growth?
Cybersecurity Threats to Satellite Communication; Interference in Transmission of Data.
8. Can you provide examples of recent developments in the market?
October 2023: The Naval Sea Systems Command, Washington, DC, signed a modification contract with Lockheed Martin Corporation to provide engineering support for Extra Large Unmanned Undersea Vehicle (UUV). The value of the contract was USD 11 million, and it will be completed by September 2024.
9. What pricing options are available for accessing the report?
Pricing options include single-user, multi-user, and enterprise licenses priced at USD 4750, USD 5250, and USD 8750 respectively.
10. Is the market size provided in terms of value or volume?
The market size is provided in terms of value, measured in Million.
11. Are there any specific market keywords associated with the report?
Yes, the market keyword associated with the report is "Unmanned Sea Systems Industry," which aids in identifying and referencing the specific market segment covered.
12. How do I determine which pricing option suits my needs best?
The pricing options vary based on user requirements and access needs. Individual users may opt for single-user licenses, while businesses requiring broader access may choose multi-user or enterprise licenses for cost-effective access to the report.
13. Are there any additional resources or data provided in the Unmanned Sea Systems Industry report?
While the report offers comprehensive insights, it's advisable to review the specific contents or supplementary materials provided to ascertain if additional resources or data are available.
14. How can I stay updated on further developments or reports in the Unmanned Sea Systems Industry?
To stay informed about further developments, trends, and reports in the Unmanned Sea Systems Industry, consider subscribing to industry newsletters, following relevant companies and organizations, or regularly checking reputable industry news sources and publications.
Methodology
Step 1 - Identification of Relevant Samples Size from Population Database


Step 2 - Approaches for Defining Global Market Size (Value, Volume* & Price*)

Note*: In applicable scenarios
Step 3 - Data Sources
Primary Research
- Web Analytics
- Survey Reports
- Research Institute
- Latest Research Reports
- Opinion Leaders
Secondary Research
- Annual Reports
- White Paper
- Latest Press Release
- Industry Association
- Paid Database
- Investor Presentations

Step 4 - Data Triangulation
Involves using different sources of information in order to increase the validity of a study
These sources are likely to be stakeholders in a program - participants, other researchers, program staff, other community members, and so on.
Then we put all data in single framework & apply various statistical tools to find out the dynamic on the market.
During the analysis stage, feedback from the stakeholder groups would be compared to determine areas of agreement as well as areas of divergence