
Key Insights
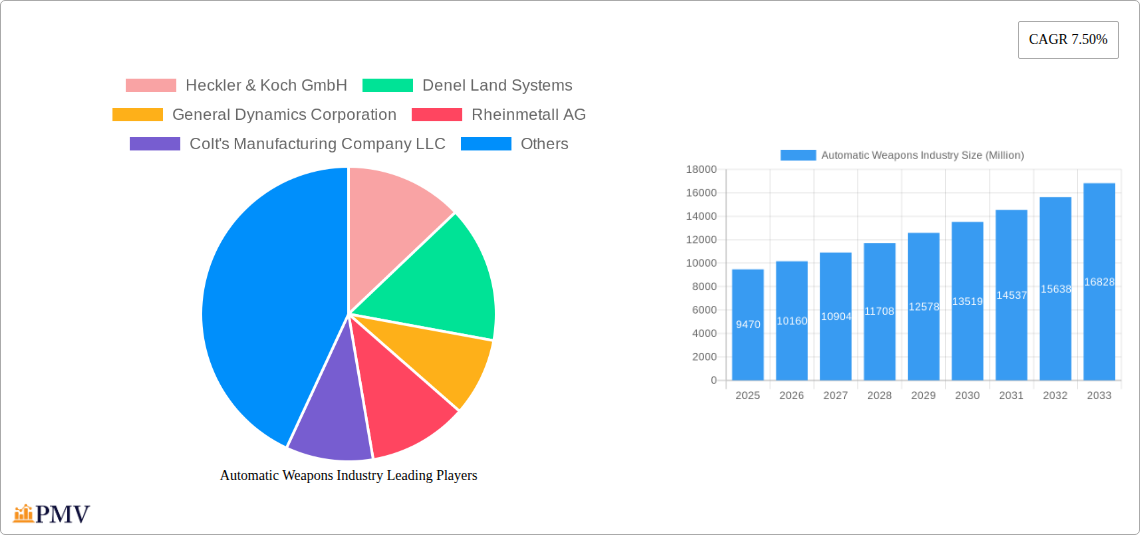
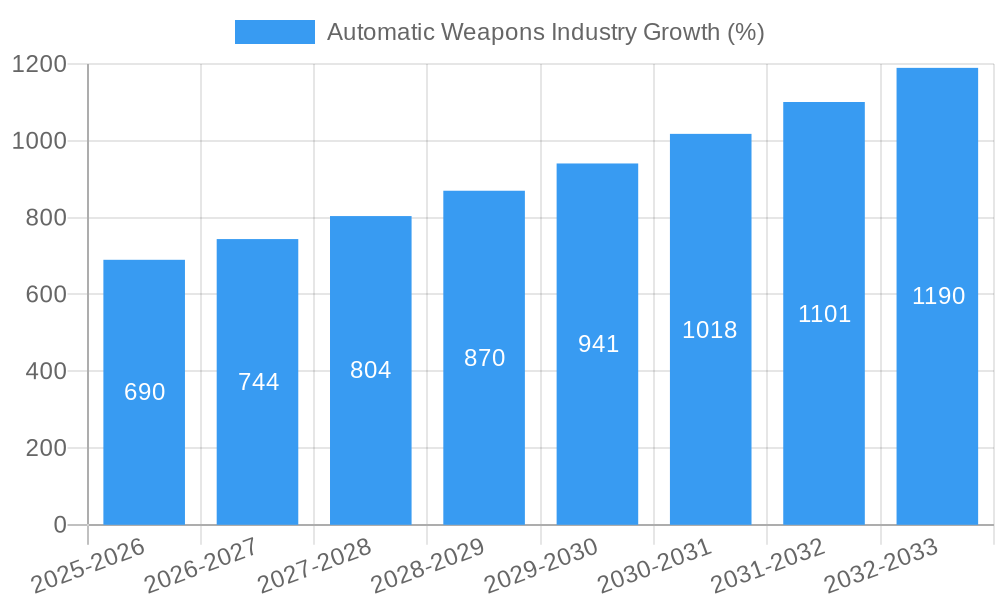
The automatic weapons industry, valued at $9.47 billion in 2025, is projected to experience robust growth, driven by escalating geopolitical instability, modernization of military arsenals, and increasing demand for advanced weaponry from both government and private sectors. The compound annual growth rate (CAGR) of 7.50% from 2025 to 2033 indicates a significant expansion of this market, reaching an estimated value of $18.1 billion by 2033. Key drivers include technological advancements in areas such as precision-guided munitions, lighter weight materials, and improved ergonomics, all contributing to enhanced weapon effectiveness and soldier survivability. The market is segmented by weapon type (Automatic Rifles, Machine Guns, Automatic Launchers, Automatic Cannons, Gatling Guns) and platform (Land, Airborne, Naval), with the land-based segment currently dominating due to extensive ground forces deployments globally. Emerging trends, such as the integration of smart technologies and the development of unmanned weapon systems, are expected to further reshape the landscape in the coming years. However, restrictive regulations on arms trade and increasing concerns regarding civilian casualties can act as restraints on market expansion.
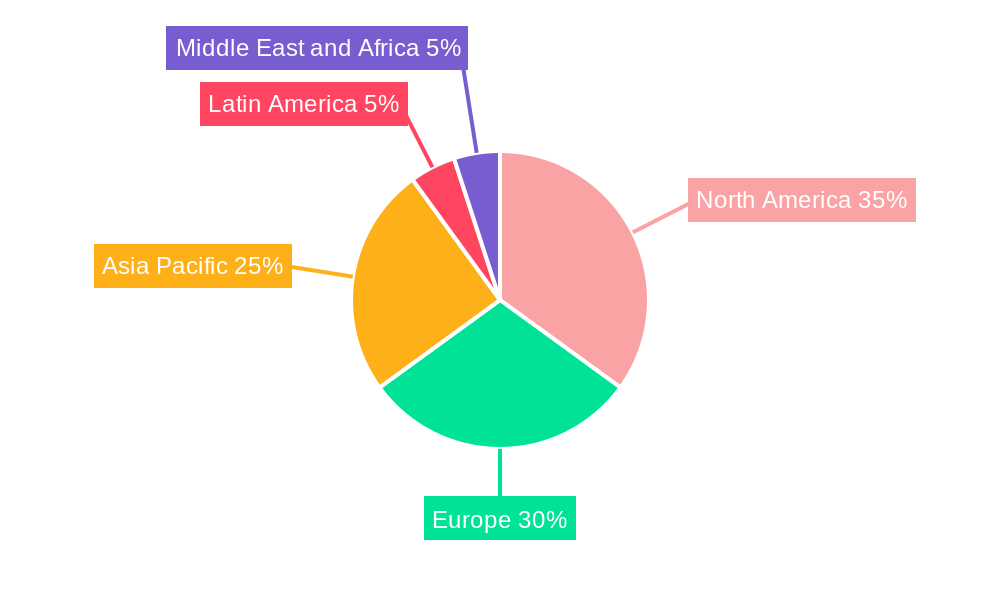
The regional market is diverse, with North America and Europe currently holding significant shares, driven by strong defense budgets and established military infrastructures. However, the Asia-Pacific region is poised for substantial growth due to rising defense spending in countries like China and India. Major players like Heckler & Koch, General Dynamics, Rheinmetall, and others are continuously investing in research and development, striving to maintain competitive edges through innovation and technological superiority. The competitive landscape is characterized by intense rivalry, with companies focusing on strategic partnerships, mergers, and acquisitions to consolidate their positions and expand their market reach. This dynamic interplay between technological advancements, geopolitical factors, and regulatory frameworks will be critical in shaping the future trajectory of the automatic weapons industry.
Automatic Weapons Industry: A Comprehensive Market Report (2019-2033)
This in-depth report provides a comprehensive analysis of the global automatic weapons industry, covering market size, growth projections, competitive landscape, technological advancements, and key market trends from 2019 to 2033. The study period spans 2019-2024 (Historical Period), with 2025 as the Base Year and Estimated Year, and a forecast period extending to 2033 (Forecast Period: 2025-2033). The report offers actionable insights for industry stakeholders, including manufacturers, suppliers, and government agencies. With a projected market value exceeding xx Million by 2033, this report is essential for understanding the dynamic nature of this critical sector.
Automatic Weapons Industry Market Structure & Competitive Dynamics
The global automatic weapons market is characterized by a moderately concentrated structure, with a few dominant players and several smaller niche manufacturers. Market share is largely determined by technological innovation, production capacity, established customer relationships (often with governments), and the ability to adapt to evolving military and security needs. The industry’s innovation ecosystem is driven by continuous advancements in materials science, aiming for lighter, more durable, and precise weaponry, as well as technological integration such as smart targeting systems.
Regulatory frameworks, which vary significantly across countries, play a crucial role in shaping market dynamics. Stringent export controls, licensing requirements, and end-user restrictions influence market access and growth potential. Product substitutes are limited, with the primary competition being between different types of automatic weapons (e.g., machine guns vs. automatic rifles) rather than alternative weapon systems. End-user trends favor increased demand for lightweight, modular designs adaptable to various operational environments.
Mergers and acquisitions (M&A) activity has been relatively moderate but strategically important, with larger companies seeking to expand their product portfolios and market reach through acquisitions of smaller, specialized firms. While precise M&A deal values are confidential in many cases, the overall value of such transactions is estimated to have exceeded xx Million in the past five years.
- Market Concentration: Moderately concentrated, with top 5 players holding approximately xx% market share.
- M&A Activity: xx Million in total deal value in the last five years.
- Key Innovation Areas: Lightweight materials, smart targeting, modular design.
- Regulatory Impact: Significant variation in export controls and licensing across regions.
Automatic Weapons Industry Industry Trends & Insights
The automatic weapons market exhibits robust growth, driven primarily by increasing global defense budgets, ongoing conflicts, and the growing demand for advanced security solutions. Technological advancements, including the integration of smart technologies and improved materials, are further enhancing the performance and effectiveness of automatic weapons. The adoption of lightweight materials, such as titanium and advanced polymers, is a prominent trend aimed at reducing the weight burden on soldiers without compromising durability or performance. A key driver is the increasing focus on precision-guided munitions. The industry is also witnessing a shift towards modular designs that allow for easy customization and adaptability to different mission requirements.
Consumer preferences lean towards increased accuracy, improved ergonomics, and enhanced reliability. Competitive dynamics are intense, with leading players continuously striving to improve product offerings, reduce costs, and expand their global market presence. The CAGR (Compound Annual Growth Rate) for the automatic weapons market is estimated to be xx% during the forecast period (2025-2033). Market penetration is steadily increasing, with greater adoption in both developed and developing nations.
Dominant Markets & Segments in Automatic Weapons Industry
The North American and European regions continue to dominate the automatic weapons market, driven by robust defense budgets and ongoing technological advancements. However, the Asia-Pacific region is experiencing significant growth, fueled by increasing defense spending and modernization efforts in several countries.
- Dominant Region: North America
- Key Drivers:
- North America: Strong defense budgets, technological innovation, well-established industry base.
- Europe: Similar to North America.
- Asia-Pacific: Rising defense spending, modernization programs.
Segment Dominance:
- Type: Machine guns currently hold the largest market share, driven by their versatility and established role in military and security operations. Automatic rifles also maintain significant market share due to their widespread use across various sectors.
- Platform: The land segment dominates the market, reflecting the enduring importance of ground combat operations. However, the airborne and naval segments are also witnessing significant growth, primarily due to the demand for lightweight and adaptable weaponry suitable for air and maritime applications.
Automatic Weapons Industry Product Innovations
Recent product innovations focus on enhanced accuracy, reduced weight, improved ergonomics, and enhanced modularity. Lightweight materials, advanced fire control systems, and improved ammunition technologies are key areas of development. The market is seeing increasing integration of smart technologies, such as improved targeting systems, enhancing the effectiveness and lethality of these weapons. These innovations directly address the needs of modern warfare, providing soldiers with superior capabilities in the battlefield.
Report Segmentation & Scope
This report segments the automatic weapons market by type (Automatic Rifle, Machine Gun, Automatic launchers, Automatic Cannon, Gatling Gun) and platform (Land, Airborne, Naval). Growth projections vary by segment, with the machine gun segment anticipated to experience the highest growth rate due to its versatile nature. Market sizes are provided for each segment, with detailed analysis of competitive dynamics. The report also includes a detailed regional breakdown.
Key Drivers of Automatic Weapons Industry Growth
Key growth drivers include increasing defense spending globally, technological advancements, ongoing conflicts and security threats, and the adoption of advanced technologies such as smart targeting systems and lightweight materials. Government modernization initiatives and the demand for increased precision are also significant catalysts for market growth.
Challenges in the Automatic Weapons Industry Sector
Challenges include stringent regulatory frameworks, particularly regarding export controls, supply chain disruptions that impact the availability of crucial components, and intense competition among leading manufacturers. These factors can affect production costs, timelines, and overall market accessibility.
Leading Players in the Automatic Weapons Industry Market
- Heckler & Koch GmbH
- Denel Land Systems
- General Dynamics Corporation
- Rheinmetall AG
- Colt's Manufacturing Company LLC
- UkrOboronProm
- Sig Sauer Inc
- Israel Weapon Industries (IWI) Ltd
- Singapore Technologies Engineering Ltd
- BAE Systems plc
- Northrop Grumman Corporation
- FN HERSTAL (Herstal Group)
Key Developments in Automatic Weapons Industry Sector
- March 2023: Israel's IWI received a contract from Estonia for 1,000 NG7 "Negev" light machine guns, replacing older models. This highlights the ongoing demand for modern, reliable light machine guns.
- February 2022: FN America secured a USD 49 Million contract from the US Army for M240L medium machine guns. This underscores the continued preference for lightweight, high-performance machine guns in military applications.
Strategic Automatic Weapons Industry Market Outlook
The automatic weapons market is poised for sustained growth, driven by technological advancements, geopolitical instability, and increasing defense budgets worldwide. Strategic opportunities lie in developing innovative, lightweight, and technologically advanced weaponry that meets the evolving needs of military and security forces. The focus will remain on modularity, precision, and reduced weight to enhance effectiveness and soldier survivability. Companies with strong R&D capabilities and established supply chains will be best positioned for success in this dynamic market.
Automatic Weapons Industry Segmentation
-
1. Type
- 1.1. Automatic Rifle
- 1.2. Machine Gun
- 1.3. Automatic launchers
- 1.4. Automatic Cannon
- 1.5. Gatling Gun
-
2. Platform
- 2.1. Land
- 2.2. Airborne
- 2.3. Naval
Automatic Weapons Industry Segmentation By Geography
-
1. North America
- 1.1. United States
- 1.2. Canada
-
2. Europe
- 2.1. United Kingdom
- 2.2. Germany
- 2.3. France
- 2.4. Russia
- 2.5. Rest of Europe
-
3. Asia Pacific
- 3.1. China
- 3.2. India
- 3.3. Japan
- 3.4. South Korea
- 3.5. Rest of Asia Pacific
-
4. Latin America
- 4.1. Brazil
- 4.2. Rest of Latin America
-
5. Middle East and Africa
- 5.1. United Arab Emirates
- 5.2. Saudi Arabia
- 5.3. South Africa
- 5.4. Rest of Middle East and Africa
Automatic Weapons Industry REPORT HIGHLIGHTS
| Aspects | Details |
|---|---|
| Study Period | 2019-2033 |
| Base Year | 2024 |
| Estimated Year | 2025 |
| Forecast Period | 2025-2033 |
| Historical Period | 2019-2024 |
| Growth Rate | CAGR of 7.50% from 2019-2033 |
| Segmentation |
|
Table of Contents
- 1. Introduction
- 1.1. Research Scope
- 1.2. Market Segmentation
- 1.3. Research Methodology
- 1.4. Definitions and Assumptions
- 2. Executive Summary
- 2.1. Introduction
- 3. Market Dynamics
- 3.1. Introduction
- 3.2. Market Drivers
- 3.3. Market Restrains
- 3.4. Market Trends
- 3.4.1. Land Segment to Witness Highest Growth During the Forecast Period
- 4. Market Factor Analysis
- 4.1. Porters Five Forces
- 4.2. Supply/Value Chain
- 4.3. PESTEL analysis
- 4.4. Market Entropy
- 4.5. Patent/Trademark Analysis
- 5. Global Automatic Weapons Industry Analysis, Insights and Forecast, 2019-2031
- 5.1. Market Analysis, Insights and Forecast - by Type
- 5.1.1. Automatic Rifle
- 5.1.2. Machine Gun
- 5.1.3. Automatic launchers
- 5.1.4. Automatic Cannon
- 5.1.5. Gatling Gun
- 5.2. Market Analysis, Insights and Forecast - by Platform
- 5.2.1. Land
- 5.2.2. Airborne
- 5.2.3. Naval
- 5.3. Market Analysis, Insights and Forecast - by Region
- 5.3.1. North America
- 5.3.2. Europe
- 5.3.3. Asia Pacific
- 5.3.4. Latin America
- 5.3.5. Middle East and Africa
- 5.1. Market Analysis, Insights and Forecast - by Type
- 6. North America Automatic Weapons Industry Analysis, Insights and Forecast, 2019-2031
- 6.1. Market Analysis, Insights and Forecast - by Type
- 6.1.1. Automatic Rifle
- 6.1.2. Machine Gun
- 6.1.3. Automatic launchers
- 6.1.4. Automatic Cannon
- 6.1.5. Gatling Gun
- 6.2. Market Analysis, Insights and Forecast - by Platform
- 6.2.1. Land
- 6.2.2. Airborne
- 6.2.3. Naval
- 6.1. Market Analysis, Insights and Forecast - by Type
- 7. Europe Automatic Weapons Industry Analysis, Insights and Forecast, 2019-2031
- 7.1. Market Analysis, Insights and Forecast - by Type
- 7.1.1. Automatic Rifle
- 7.1.2. Machine Gun
- 7.1.3. Automatic launchers
- 7.1.4. Automatic Cannon
- 7.1.5. Gatling Gun
- 7.2. Market Analysis, Insights and Forecast - by Platform
- 7.2.1. Land
- 7.2.2. Airborne
- 7.2.3. Naval
- 7.1. Market Analysis, Insights and Forecast - by Type
- 8. Asia Pacific Automatic Weapons Industry Analysis, Insights and Forecast, 2019-2031
- 8.1. Market Analysis, Insights and Forecast - by Type
- 8.1.1. Automatic Rifle
- 8.1.2. Machine Gun
- 8.1.3. Automatic launchers
- 8.1.4. Automatic Cannon
- 8.1.5. Gatling Gun
- 8.2. Market Analysis, Insights and Forecast - by Platform
- 8.2.1. Land
- 8.2.2. Airborne
- 8.2.3. Naval
- 8.1. Market Analysis, Insights and Forecast - by Type
- 9. Latin America Automatic Weapons Industry Analysis, Insights and Forecast, 2019-2031
- 9.1. Market Analysis, Insights and Forecast - by Type
- 9.1.1. Automatic Rifle
- 9.1.2. Machine Gun
- 9.1.3. Automatic launchers
- 9.1.4. Automatic Cannon
- 9.1.5. Gatling Gun
- 9.2. Market Analysis, Insights and Forecast - by Platform
- 9.2.1. Land
- 9.2.2. Airborne
- 9.2.3. Naval
- 9.1. Market Analysis, Insights and Forecast - by Type
- 10. Middle East and Africa Automatic Weapons Industry Analysis, Insights and Forecast, 2019-2031
- 10.1. Market Analysis, Insights and Forecast - by Type
- 10.1.1. Automatic Rifle
- 10.1.2. Machine Gun
- 10.1.3. Automatic launchers
- 10.1.4. Automatic Cannon
- 10.1.5. Gatling Gun
- 10.2. Market Analysis, Insights and Forecast - by Platform
- 10.2.1. Land
- 10.2.2. Airborne
- 10.2.3. Naval
- 10.1. Market Analysis, Insights and Forecast - by Type
- 11. North America Automatic Weapons Industry Analysis, Insights and Forecast, 2019-2031
- 11.1. Market Analysis, Insights and Forecast - By Country/Sub-region
- 11.1.1 United States
- 11.1.2 Canada
- 12. Europe Automatic Weapons Industry Analysis, Insights and Forecast, 2019-2031
- 12.1. Market Analysis, Insights and Forecast - By Country/Sub-region
- 12.1.1 United Kingdom
- 12.1.2 Germany
- 12.1.3 France
- 12.1.4 Russia
- 12.1.5 Rest of Europe
- 13. Asia Pacific Automatic Weapons Industry Analysis, Insights and Forecast, 2019-2031
- 13.1. Market Analysis, Insights and Forecast - By Country/Sub-region
- 13.1.1 China
- 13.1.2 India
- 13.1.3 Japan
- 13.1.4 South Korea
- 13.1.5 Rest of Asia Pacific
- 14. Latin America Automatic Weapons Industry Analysis, Insights and Forecast, 2019-2031
- 14.1. Market Analysis, Insights and Forecast - By Country/Sub-region
- 14.1.1 Brazil
- 14.1.2 Rest of Latin America
- 15. Middle East and Africa Automatic Weapons Industry Analysis, Insights and Forecast, 2019-2031
- 15.1. Market Analysis, Insights and Forecast - By Country/Sub-region
- 15.1.1 United Arab Emirates
- 15.1.2 Saudi Arabia
- 15.1.3 South Africa
- 15.1.4 Rest of Middle East and Africa
- 16. Competitive Analysis
- 16.1. Global Market Share Analysis 2024
- 16.2. Company Profiles
- 16.2.1 Heckler & Koch GmbH
- 16.2.1.1. Overview
- 16.2.1.2. Products
- 16.2.1.3. SWOT Analysis
- 16.2.1.4. Recent Developments
- 16.2.1.5. Financials (Based on Availability)
- 16.2.2 Denel Land Systems
- 16.2.2.1. Overview
- 16.2.2.2. Products
- 16.2.2.3. SWOT Analysis
- 16.2.2.4. Recent Developments
- 16.2.2.5. Financials (Based on Availability)
- 16.2.3 General Dynamics Corporation
- 16.2.3.1. Overview
- 16.2.3.2. Products
- 16.2.3.3. SWOT Analysis
- 16.2.3.4. Recent Developments
- 16.2.3.5. Financials (Based on Availability)
- 16.2.4 Rheinmetall AG
- 16.2.4.1. Overview
- 16.2.4.2. Products
- 16.2.4.3. SWOT Analysis
- 16.2.4.4. Recent Developments
- 16.2.4.5. Financials (Based on Availability)
- 16.2.5 Colt's Manufacturing Company LLC
- 16.2.5.1. Overview
- 16.2.5.2. Products
- 16.2.5.3. SWOT Analysis
- 16.2.5.4. Recent Developments
- 16.2.5.5. Financials (Based on Availability)
- 16.2.6 UkrOboronProm
- 16.2.6.1. Overview
- 16.2.6.2. Products
- 16.2.6.3. SWOT Analysis
- 16.2.6.4. Recent Developments
- 16.2.6.5. Financials (Based on Availability)
- 16.2.7 Sig Sauer Inc
- 16.2.7.1. Overview
- 16.2.7.2. Products
- 16.2.7.3. SWOT Analysis
- 16.2.7.4. Recent Developments
- 16.2.7.5. Financials (Based on Availability)
- 16.2.8 Israel Weapon Industries (IWI) Ltd
- 16.2.8.1. Overview
- 16.2.8.2. Products
- 16.2.8.3. SWOT Analysis
- 16.2.8.4. Recent Developments
- 16.2.8.5. Financials (Based on Availability)
- 16.2.9 Singapore Technologies Engineering Ltd
- 16.2.9.1. Overview
- 16.2.9.2. Products
- 16.2.9.3. SWOT Analysis
- 16.2.9.4. Recent Developments
- 16.2.9.5. Financials (Based on Availability)
- 16.2.10 BAE Systems plc
- 16.2.10.1. Overview
- 16.2.10.2. Products
- 16.2.10.3. SWOT Analysis
- 16.2.10.4. Recent Developments
- 16.2.10.5. Financials (Based on Availability)
- 16.2.11 Northrop Grumman Corporation
- 16.2.11.1. Overview
- 16.2.11.2. Products
- 16.2.11.3. SWOT Analysis
- 16.2.11.4. Recent Developments
- 16.2.11.5. Financials (Based on Availability)
- 16.2.12 FN HERSTAL (Herstal Group)
- 16.2.12.1. Overview
- 16.2.12.2. Products
- 16.2.12.3. SWOT Analysis
- 16.2.12.4. Recent Developments
- 16.2.12.5. Financials (Based on Availability)
- 16.2.1 Heckler & Koch GmbH
List of Figures
- Figure 1: Global Automatic Weapons Industry Revenue Breakdown (Million, %) by Region 2024 & 2032
- Figure 2: North America Automatic Weapons Industry Revenue (Million), by Country 2024 & 2032
- Figure 3: North America Automatic Weapons Industry Revenue Share (%), by Country 2024 & 2032
- Figure 4: Europe Automatic Weapons Industry Revenue (Million), by Country 2024 & 2032
- Figure 5: Europe Automatic Weapons Industry Revenue Share (%), by Country 2024 & 2032
- Figure 6: Asia Pacific Automatic Weapons Industry Revenue (Million), by Country 2024 & 2032
- Figure 7: Asia Pacific Automatic Weapons Industry Revenue Share (%), by Country 2024 & 2032
- Figure 8: Latin America Automatic Weapons Industry Revenue (Million), by Country 2024 & 2032
- Figure 9: Latin America Automatic Weapons Industry Revenue Share (%), by Country 2024 & 2032
- Figure 10: Middle East and Africa Automatic Weapons Industry Revenue (Million), by Country 2024 & 2032
- Figure 11: Middle East and Africa Automatic Weapons Industry Revenue Share (%), by Country 2024 & 2032
- Figure 12: North America Automatic Weapons Industry Revenue (Million), by Type 2024 & 2032
- Figure 13: North America Automatic Weapons Industry Revenue Share (%), by Type 2024 & 2032
- Figure 14: North America Automatic Weapons Industry Revenue (Million), by Platform 2024 & 2032
- Figure 15: North America Automatic Weapons Industry Revenue Share (%), by Platform 2024 & 2032
- Figure 16: North America Automatic Weapons Industry Revenue (Million), by Country 2024 & 2032
- Figure 17: North America Automatic Weapons Industry Revenue Share (%), by Country 2024 & 2032
- Figure 18: Europe Automatic Weapons Industry Revenue (Million), by Type 2024 & 2032
- Figure 19: Europe Automatic Weapons Industry Revenue Share (%), by Type 2024 & 2032
- Figure 20: Europe Automatic Weapons Industry Revenue (Million), by Platform 2024 & 2032
- Figure 21: Europe Automatic Weapons Industry Revenue Share (%), by Platform 2024 & 2032
- Figure 22: Europe Automatic Weapons Industry Revenue (Million), by Country 2024 & 2032
- Figure 23: Europe Automatic Weapons Industry Revenue Share (%), by Country 2024 & 2032
- Figure 24: Asia Pacific Automatic Weapons Industry Revenue (Million), by Type 2024 & 2032
- Figure 25: Asia Pacific Automatic Weapons Industry Revenue Share (%), by Type 2024 & 2032
- Figure 26: Asia Pacific Automatic Weapons Industry Revenue (Million), by Platform 2024 & 2032
- Figure 27: Asia Pacific Automatic Weapons Industry Revenue Share (%), by Platform 2024 & 2032
- Figure 28: Asia Pacific Automatic Weapons Industry Revenue (Million), by Country 2024 & 2032
- Figure 29: Asia Pacific Automatic Weapons Industry Revenue Share (%), by Country 2024 & 2032
- Figure 30: Latin America Automatic Weapons Industry Revenue (Million), by Type 2024 & 2032
- Figure 31: Latin America Automatic Weapons Industry Revenue Share (%), by Type 2024 & 2032
- Figure 32: Latin America Automatic Weapons Industry Revenue (Million), by Platform 2024 & 2032
- Figure 33: Latin America Automatic Weapons Industry Revenue Share (%), by Platform 2024 & 2032
- Figure 34: Latin America Automatic Weapons Industry Revenue (Million), by Country 2024 & 2032
- Figure 35: Latin America Automatic Weapons Industry Revenue Share (%), by Country 2024 & 2032
- Figure 36: Middle East and Africa Automatic Weapons Industry Revenue (Million), by Type 2024 & 2032
- Figure 37: Middle East and Africa Automatic Weapons Industry Revenue Share (%), by Type 2024 & 2032
- Figure 38: Middle East and Africa Automatic Weapons Industry Revenue (Million), by Platform 2024 & 2032
- Figure 39: Middle East and Africa Automatic Weapons Industry Revenue Share (%), by Platform 2024 & 2032
- Figure 40: Middle East and Africa Automatic Weapons Industry Revenue (Million), by Country 2024 & 2032
- Figure 41: Middle East and Africa Automatic Weapons Industry Revenue Share (%), by Country 2024 & 2032
List of Tables
- Table 1: Global Automatic Weapons Industry Revenue Million Forecast, by Region 2019 & 2032
- Table 2: Global Automatic Weapons Industry Revenue Million Forecast, by Type 2019 & 2032
- Table 3: Global Automatic Weapons Industry Revenue Million Forecast, by Platform 2019 & 2032
- Table 4: Global Automatic Weapons Industry Revenue Million Forecast, by Region 2019 & 2032
- Table 5: Global Automatic Weapons Industry Revenue Million Forecast, by Country 2019 & 2032
- Table 6: United States Automatic Weapons Industry Revenue (Million) Forecast, by Application 2019 & 2032
- Table 7: Canada Automatic Weapons Industry Revenue (Million) Forecast, by Application 2019 & 2032
- Table 8: Global Automatic Weapons Industry Revenue Million Forecast, by Country 2019 & 2032
- Table 9: United Kingdom Automatic Weapons Industry Revenue (Million) Forecast, by Application 2019 & 2032
- Table 10: Germany Automatic Weapons Industry Revenue (Million) Forecast, by Application 2019 & 2032
- Table 11: France Automatic Weapons Industry Revenue (Million) Forecast, by Application 2019 & 2032
- Table 12: Russia Automatic Weapons Industry Revenue (Million) Forecast, by Application 2019 & 2032
- Table 13: Rest of Europe Automatic Weapons Industry Revenue (Million) Forecast, by Application 2019 & 2032
- Table 14: Global Automatic Weapons Industry Revenue Million Forecast, by Country 2019 & 2032
- Table 15: China Automatic Weapons Industry Revenue (Million) Forecast, by Application 2019 & 2032
- Table 16: India Automatic Weapons Industry Revenue (Million) Forecast, by Application 2019 & 2032
- Table 17: Japan Automatic Weapons Industry Revenue (Million) Forecast, by Application 2019 & 2032
- Table 18: South Korea Automatic Weapons Industry Revenue (Million) Forecast, by Application 2019 & 2032
- Table 19: Rest of Asia Pacific Automatic Weapons Industry Revenue (Million) Forecast, by Application 2019 & 2032
- Table 20: Global Automatic Weapons Industry Revenue Million Forecast, by Country 2019 & 2032
- Table 21: Brazil Automatic Weapons Industry Revenue (Million) Forecast, by Application 2019 & 2032
- Table 22: Rest of Latin America Automatic Weapons Industry Revenue (Million) Forecast, by Application 2019 & 2032
- Table 23: Global Automatic Weapons Industry Revenue Million Forecast, by Country 2019 & 2032
- Table 24: United Arab Emirates Automatic Weapons Industry Revenue (Million) Forecast, by Application 2019 & 2032
- Table 25: Saudi Arabia Automatic Weapons Industry Revenue (Million) Forecast, by Application 2019 & 2032
- Table 26: South Africa Automatic Weapons Industry Revenue (Million) Forecast, by Application 2019 & 2032
- Table 27: Rest of Middle East and Africa Automatic Weapons Industry Revenue (Million) Forecast, by Application 2019 & 2032
- Table 28: Global Automatic Weapons Industry Revenue Million Forecast, by Type 2019 & 2032
- Table 29: Global Automatic Weapons Industry Revenue Million Forecast, by Platform 2019 & 2032
- Table 30: Global Automatic Weapons Industry Revenue Million Forecast, by Country 2019 & 2032
- Table 31: United States Automatic Weapons Industry Revenue (Million) Forecast, by Application 2019 & 2032
- Table 32: Canada Automatic Weapons Industry Revenue (Million) Forecast, by Application 2019 & 2032
- Table 33: Global Automatic Weapons Industry Revenue Million Forecast, by Type 2019 & 2032
- Table 34: Global Automatic Weapons Industry Revenue Million Forecast, by Platform 2019 & 2032
- Table 35: Global Automatic Weapons Industry Revenue Million Forecast, by Country 2019 & 2032
- Table 36: United Kingdom Automatic Weapons Industry Revenue (Million) Forecast, by Application 2019 & 2032
- Table 37: Germany Automatic Weapons Industry Revenue (Million) Forecast, by Application 2019 & 2032
- Table 38: France Automatic Weapons Industry Revenue (Million) Forecast, by Application 2019 & 2032
- Table 39: Russia Automatic Weapons Industry Revenue (Million) Forecast, by Application 2019 & 2032
- Table 40: Rest of Europe Automatic Weapons Industry Revenue (Million) Forecast, by Application 2019 & 2032
- Table 41: Global Automatic Weapons Industry Revenue Million Forecast, by Type 2019 & 2032
- Table 42: Global Automatic Weapons Industry Revenue Million Forecast, by Platform 2019 & 2032
- Table 43: Global Automatic Weapons Industry Revenue Million Forecast, by Country 2019 & 2032
- Table 44: China Automatic Weapons Industry Revenue (Million) Forecast, by Application 2019 & 2032
- Table 45: India Automatic Weapons Industry Revenue (Million) Forecast, by Application 2019 & 2032
- Table 46: Japan Automatic Weapons Industry Revenue (Million) Forecast, by Application 2019 & 2032
- Table 47: South Korea Automatic Weapons Industry Revenue (Million) Forecast, by Application 2019 & 2032
- Table 48: Rest of Asia Pacific Automatic Weapons Industry Revenue (Million) Forecast, by Application 2019 & 2032
- Table 49: Global Automatic Weapons Industry Revenue Million Forecast, by Type 2019 & 2032
- Table 50: Global Automatic Weapons Industry Revenue Million Forecast, by Platform 2019 & 2032
- Table 51: Global Automatic Weapons Industry Revenue Million Forecast, by Country 2019 & 2032
- Table 52: Brazil Automatic Weapons Industry Revenue (Million) Forecast, by Application 2019 & 2032
- Table 53: Rest of Latin America Automatic Weapons Industry Revenue (Million) Forecast, by Application 2019 & 2032
- Table 54: Global Automatic Weapons Industry Revenue Million Forecast, by Type 2019 & 2032
- Table 55: Global Automatic Weapons Industry Revenue Million Forecast, by Platform 2019 & 2032
- Table 56: Global Automatic Weapons Industry Revenue Million Forecast, by Country 2019 & 2032
- Table 57: United Arab Emirates Automatic Weapons Industry Revenue (Million) Forecast, by Application 2019 & 2032
- Table 58: Saudi Arabia Automatic Weapons Industry Revenue (Million) Forecast, by Application 2019 & 2032
- Table 59: South Africa Automatic Weapons Industry Revenue (Million) Forecast, by Application 2019 & 2032
- Table 60: Rest of Middle East and Africa Automatic Weapons Industry Revenue (Million) Forecast, by Application 2019 & 2032
Frequently Asked Questions
1. What is the projected Compound Annual Growth Rate (CAGR) of the Automatic Weapons Industry?
The projected CAGR is approximately 7.50%.
2. Which companies are prominent players in the Automatic Weapons Industry?
Key companies in the market include Heckler & Koch GmbH, Denel Land Systems, General Dynamics Corporation, Rheinmetall AG, Colt's Manufacturing Company LLC, UkrOboronProm, Sig Sauer Inc, Israel Weapon Industries (IWI) Ltd, Singapore Technologies Engineering Ltd, BAE Systems plc, Northrop Grumman Corporation, FN HERSTAL (Herstal Group).
3. What are the main segments of the Automatic Weapons Industry?
The market segments include Type, Platform.
4. Can you provide details about the market size?
The market size is estimated to be USD 9.47 Million as of 2022.
5. What are some drivers contributing to market growth?
N/A
6. What are the notable trends driving market growth?
Land Segment to Witness Highest Growth During the Forecast Period.
7. Are there any restraints impacting market growth?
N/A
8. Can you provide examples of recent developments in the market?
March 2023: the Estonian Defense Investment Centre awarded an order to Israel's IWI for the supply of 1,000 NG7 "Negev" light machine weapon systems to the Estonian Army. The "Negevv" machine guns, which are expected to be delivered towards the end of 2023, will take over from MG3 and KSP-58 machines that are already in use. NEGEV 7.62 LMG is a NATO 7.62x51mm Light machine gun, which is used by many countries worldwide.
9. What pricing options are available for accessing the report?
Pricing options include single-user, multi-user, and enterprise licenses priced at USD 4750, USD 5250, and USD 8750 respectively.
10. Is the market size provided in terms of value or volume?
The market size is provided in terms of value, measured in Million.
11. Are there any specific market keywords associated with the report?
Yes, the market keyword associated with the report is "Automatic Weapons Industry," which aids in identifying and referencing the specific market segment covered.
12. How do I determine which pricing option suits my needs best?
The pricing options vary based on user requirements and access needs. Individual users may opt for single-user licenses, while businesses requiring broader access may choose multi-user or enterprise licenses for cost-effective access to the report.
13. Are there any additional resources or data provided in the Automatic Weapons Industry report?
While the report offers comprehensive insights, it's advisable to review the specific contents or supplementary materials provided to ascertain if additional resources or data are available.
14. How can I stay updated on further developments or reports in the Automatic Weapons Industry?
To stay informed about further developments, trends, and reports in the Automatic Weapons Industry, consider subscribing to industry newsletters, following relevant companies and organizations, or regularly checking reputable industry news sources and publications.
Methodology
Step 1 - Identification of Relevant Samples Size from Population Database


Step 2 - Approaches for Defining Global Market Size (Value, Volume* & Price*)

Note*: In applicable scenarios
Step 3 - Data Sources
Primary Research
- Web Analytics
- Survey Reports
- Research Institute
- Latest Research Reports
- Opinion Leaders
Secondary Research
- Annual Reports
- White Paper
- Latest Press Release
- Industry Association
- Paid Database
- Investor Presentations

Step 4 - Data Triangulation
Involves using different sources of information in order to increase the validity of a study
These sources are likely to be stakeholders in a program - participants, other researchers, program staff, other community members, and so on.
Then we put all data in single framework & apply various statistical tools to find out the dynamic on the market.
During the analysis stage, feedback from the stakeholder groups would be compared to determine areas of agreement as well as areas of divergence


