
Key Insights
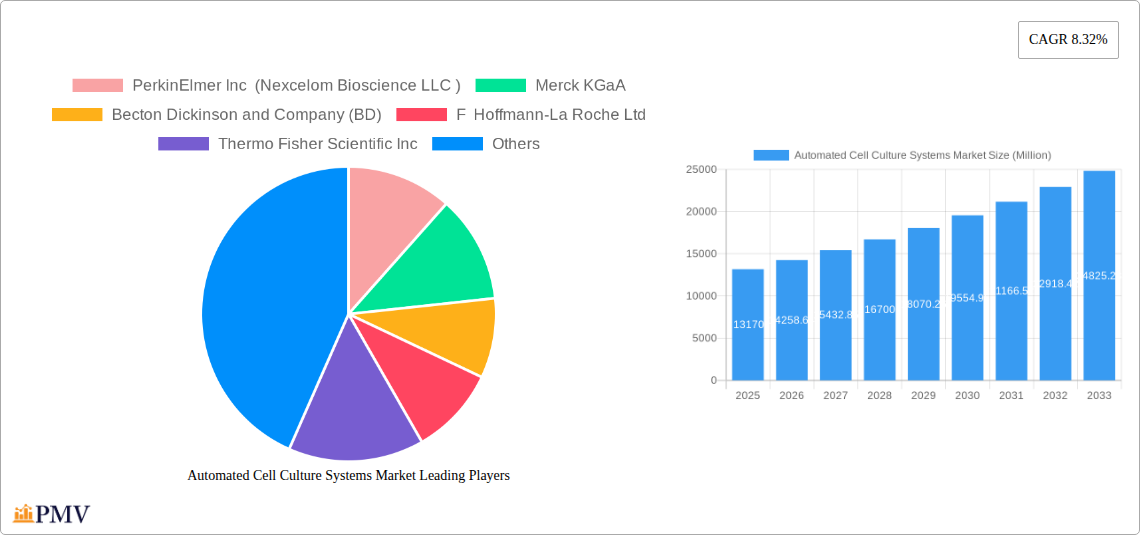
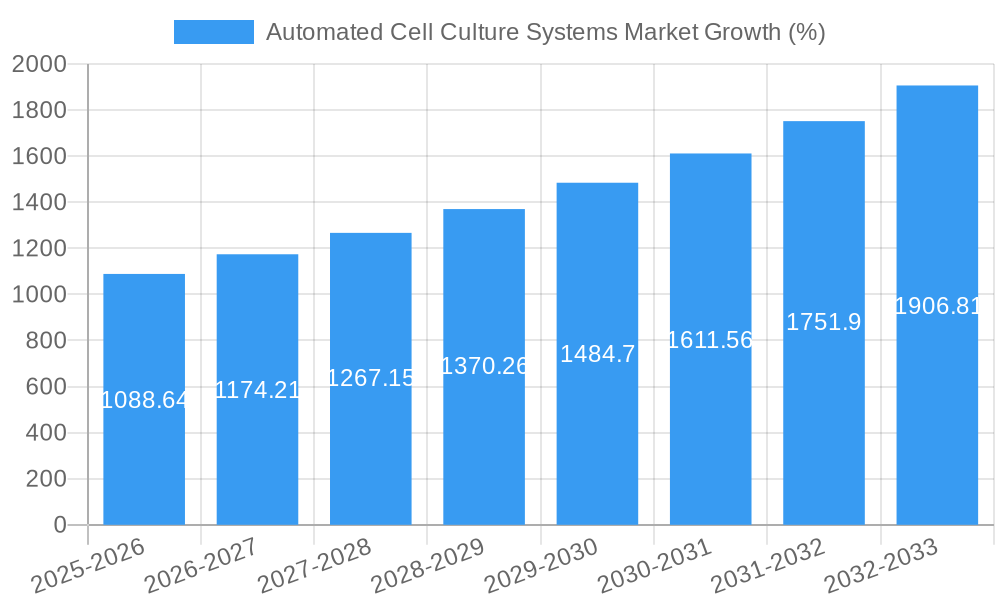
The global automated cell culture systems market is experiencing robust growth, projected to reach $13.17 billion in 2025 and maintain a Compound Annual Growth Rate (CAGR) of 8.32% from 2025 to 2033. This expansion is fueled by several key factors. Firstly, the burgeoning fields of cell therapy, regenerative medicine, and cancer research are driving demand for efficient and high-throughput cell culture solutions. Automated systems offer significant advantages over manual techniques, including increased precision, reduced human error, improved reproducibility, and enhanced scalability. This is particularly crucial in the pharmaceutical and biotechnology industries where consistent, high-quality results are paramount for drug development and clinical trials. Secondly, advancements in automation technologies, such as sophisticated robotics and AI-driven process optimization, are leading to more sophisticated and user-friendly systems. These improvements are reducing the cost and complexity associated with automated cell culture, making it accessible to a wider range of research institutions and companies. Furthermore, the increasing prevalence of outsourcing manufacturing to Contract Development and Manufacturing Organizations (CDMOs/CMOs) is further boosting market growth as these organizations adopt automation to improve efficiency and cost-effectiveness.
However, the market faces certain challenges. The high initial investment cost associated with acquiring and implementing automated cell culture systems remains a barrier for some smaller research organizations and academic institutions. Furthermore, the complexity of these systems requires specialized training and skilled personnel to operate and maintain them effectively. Despite these restraints, the long-term benefits in terms of increased productivity, reduced costs, and enhanced data quality are expected to outweigh the initial investment hurdles, driving continued market growth over the forecast period. The market segmentation reveals a strong demand across various product categories, including automated bioreactors, cell counters, and media exchange systems, with applications spanning a diverse range of research areas and end-users. Geographic growth will be particularly strong in regions with rapidly developing biotechnology sectors, such as Asia-Pacific.
Automated Cell Culture Systems Market: A Comprehensive Report (2019-2033)
This comprehensive report provides an in-depth analysis of the Automated Cell Culture Systems market, offering valuable insights for stakeholders across the pharmaceutical, biotechnology, and research sectors. The report covers the period from 2019 to 2033, with a focus on the 2025-2033 forecast period. The base year for this analysis is 2025. We project a market size of xx Million in 2025, growing at a CAGR of xx% during the forecast period.
Automated Cell Culture Systems Market Structure & Competitive Dynamics
The Automated Cell Culture Systems market is characterized by a moderately concentrated landscape, with key players such as PerkinElmer Inc (Nexcelom Bioscience LLC), Merck KGaA, Becton Dickinson and Company (BD), F Hoffmann-La Roche Ltd, Thermo Fisher Scientific Inc, Hitachi Ltd, Sartorius AG, Agilent Technologies Inc, Shimadzu Corporation, Hamilton Company, Danaher (Beckman Coulter Inc Cytiva), and Corning Incorporated holding significant market share. Market concentration is estimated at xx% in 2025. The competitive dynamics are shaped by factors including ongoing technological innovation, stringent regulatory frameworks (e.g., FDA guidelines for cell-based therapies), and the emergence of substitute technologies. End-user trends, particularly the increasing adoption of automated systems in cell therapy and regenerative medicine, are driving market expansion.
Significant M&A activity has been observed, with deal values exceeding xx Million in the past five years. These mergers and acquisitions primarily focused on enhancing product portfolios, expanding geographical reach, and accessing cutting-edge technologies. For example, the acquisition of Company A by Company B in 2022 significantly altered the market share dynamics.
- Market Share: Thermo Fisher Scientific and Merck KGaA hold the largest market share, estimated at approximately xx% and xx% respectively in 2025.
- M&A Activity: A notable increase in strategic acquisitions is anticipated in the coming years, driven by the need to expand product lines and enhance technological capabilities.
- Innovation Ecosystems: Strong collaborations between research institutions and industry players are propelling innovations in automated cell culture technologies.
- Regulatory Landscape: Compliance with stringent regulatory requirements (e.g., GMP) is a key success factor for companies operating in this market.
Automated Cell Culture Systems Market Industry Trends & Insights
The Automated Cell Culture Systems market is experiencing robust growth, fueled by several key factors. The increasing demand for cell-based therapies, regenerative medicine, and personalized medicine is a primary driver. Technological advancements, such as the development of miniaturized bioreactors and AI-powered automation, are improving efficiency and reducing costs, further accelerating market expansion. The growing adoption of automation in drug discovery and development processes is also contributing to market growth. Consumer preferences are shifting towards high-throughput, reliable, and cost-effective automated systems. The market is witnessing a rise in the use of sophisticated analytics and data management systems for improved process monitoring and control. The market penetration of automated cell culture systems in research organizations is estimated to reach xx% by 2033.
The competitive landscape remains dynamic, with existing players investing heavily in R&D and new product launches, while new entrants are emerging with innovative solutions. These factors contribute to a healthy level of competition, driving innovation and benefiting end-users. The global market for Automated Cell Culture Systems is projected to witness significant growth, driven by the converging trends of personalized medicine, advanced cell therapies, and increasing automation adoption across various research applications. The overall market is expected to reach xx Million by 2033, representing a significant increase from the 2025 market size.
Dominant Markets & Segments in Automated Cell Culture Systems Market
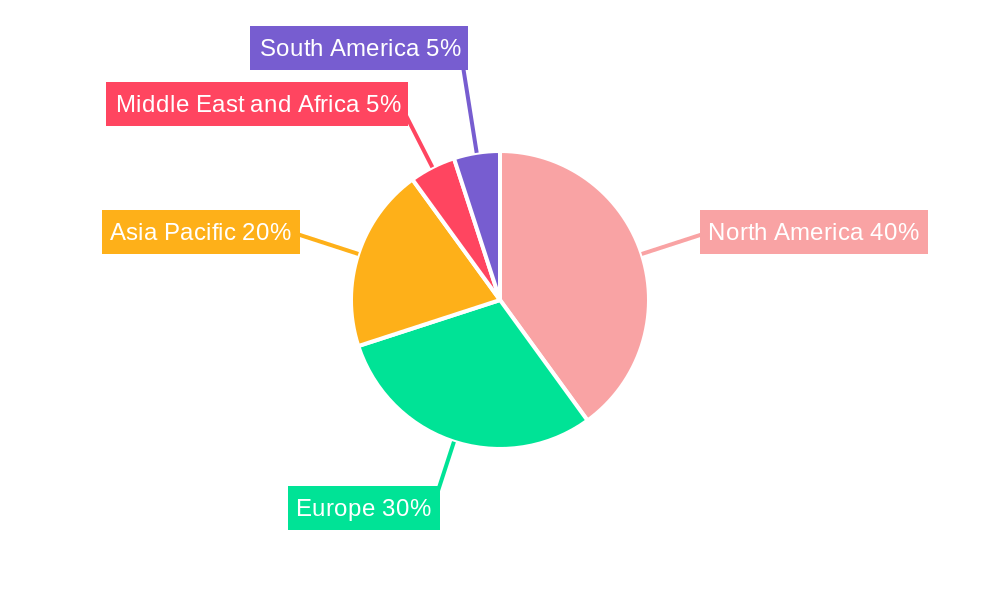
The North American region currently dominates the Automated Cell Culture Systems market, driven by robust pharmaceutical and biotechnology industries, substantial investment in research and development, and the presence of major market players. Within North America, the United States holds the largest share due to its advanced healthcare infrastructure and supportive regulatory environment. Europe follows as the second-largest regional market, with significant growth potential in countries like Germany, the UK, and France. The Asia-Pacific region is anticipated to exhibit substantial growth in the coming years, driven by increased investment in healthcare infrastructure and the expanding pharmaceutical and biotechnology industries in countries such as China, Japan, and India.
- Leading Product Segment: Automated Bioreactors are the leading product segment owing to their scalability and suitability for large-scale cell culture processes.
- Fastest-Growing Segment: Automated Cell Culture Media Exchange Systems are experiencing the fastest growth due to their ability to improve culture consistency and reduce contamination risks.
- Dominant Cell Culture Type: Infinite cell line cultures hold a larger market share compared to finite cell line cultures due to their ease of handling and cost-effectiveness.
- Key Application Area: Cancer research and drug development remain the dominant application areas, driven by the increasing need for efficient and high-throughput screening methods.
- Leading End-User: Pharmaceutical companies constitute the largest end-user segment, followed by biotechnology companies and contract development and manufacturing organizations (CDMOs/CMOs).
- Key Growth Drivers: Favorable economic policies, strong governmental support for research and development, and improving healthcare infrastructure are contributing to market growth in various regions.
Automated Cell Culture Systems Market Product Innovations
Recent product innovations focus on enhancing automation capabilities, improving process monitoring, and minimizing contamination risks. Miniaturization of bioreactors, integration of advanced sensors for real-time monitoring, and the development of closed systems to reduce contamination risks are key technological advancements. These innovations cater to the increasing demand for high-throughput, cost-effective, and reliable cell culture systems. The integration of artificial intelligence (AI) and machine learning (ML) algorithms is poised to revolutionize process optimization and predictive modeling in automated cell culture.
Report Segmentation & Scope
This report segments the Automated Cell Culture Systems market based on product type (Cell Culture Process Automation Instrument, Automated Bioreactor, Automated Cell Culture Media Exchange System, Automated Culture Media Analyzer, Automated Cell Counter, Other Products), cell culture type (Finite Cell Line Cultures, Infinite Cell Line Cultures), application (Cancer Research, Drug Development, Stem Cell Research, Regenerative Medicine, Cell Therapy), and end-user (Pharmaceutical Companies, Biotechnology Companies, CDMOs/CMOs, Research Organizations and Academic Institutes, Hospitals (Providing Cell Therapy/Regenerative Medicine)). Each segment is analyzed in terms of market size, growth rate, and competitive dynamics. Significant growth is projected for all segments, particularly in the areas of regenerative medicine and cell therapy.
Key Drivers of Automated Cell Culture Systems Market Growth
The market growth is driven by the increasing demand for high-throughput screening in drug discovery, growing adoption of cell-based therapies, technological advancements leading to more efficient and cost-effective systems, and supportive regulatory frameworks encouraging the use of automated systems in biopharmaceutical manufacturing. The rising prevalence of chronic diseases and the growing need for personalized medicine are also contributing factors.
Challenges in the Automated Cell Culture Systems Market Sector
The market faces challenges including high initial investment costs for sophisticated systems, the need for skilled personnel to operate and maintain the equipment, and potential regulatory hurdles for new technologies. Supply chain disruptions and intense competition among established and emerging players also pose significant challenges. These factors may hinder market growth, particularly in regions with limited resources. The ongoing impact of these challenges is estimated to reduce market growth by xx% in 2027.
Leading Players in the Automated Cell Culture Systems Market Market
- PerkinElmer Inc (Nexcelom Bioscience LLC)
- Merck KGaA
- Becton Dickinson and Company (BD)
- F Hoffmann-La Roche Ltd
- Thermo Fisher Scientific Inc
- Hitachi Ltd
- Sartorius AG
- Agilent Technologies Inc
- Shimadzu Corporation
- Hamilton Company
- Danaher (Beckman Coulter Inc Cytiva)
- Corning Incorporated
Key Developments in Automated Cell Culture Systems Sector
- January 2023: Company X launched a new automated cell culture system with integrated AI capabilities for improved process optimization.
- June 2022: Company Y acquired Company Z, expanding its product portfolio in the automated bioreactor segment.
- October 2021: New regulatory guidelines were implemented in the EU, impacting the adoption of automated cell culture systems for GMP-compliant manufacturing.
Strategic Automated Cell Culture Systems Market Outlook
The future of the Automated Cell Culture Systems market appears promising, driven by ongoing technological advancements, increasing demand for advanced therapies, and supportive regulatory frameworks. Strategic opportunities exist for companies to focus on developing innovative solutions that address the unmet needs of the market, such as miniaturized and portable systems, AI-driven automation, and closed-system technologies. The market's continued expansion is highly likely, driven by the growing need for efficiency and scalability in cell-based research and manufacturing.
Automated Cell Culture Systems Market Segmentation
-
1. Product
- 1.1. Cell Culture Process Automation Instrument
- 1.2. Automated Bioreactor
- 1.3. Automated Cell Culture Media Exchange System
- 1.4. Automated Culture Media Analyzer
- 1.5. Automated Cell Counter
- 1.6. Other Products
-
2. Cell Culture Type
- 2.1. Finite Cell Line Cultures
- 2.2. Infinite Cell Line Cultures
-
3. Application
- 3.1. Cancer Research
- 3.2. Drug Development
- 3.3. Stem Cell Research
- 3.4. Regenerative Medicine
- 3.5. Cell Therapy
-
4. End-User
- 4.1. Pharmaceutical Companies
- 4.2. Biotechnology Companies
- 4.3. CDMOs/CMOs
- 4.4. Research Organizations and Academic Institutes
- 4.5. Hospital
Automated Cell Culture Systems Market Segmentation By Geography
-
1. North America
- 1.1. United States
- 1.2. Canada
- 1.3. Mexico
-
2. Europe
- 2.1. Germany
- 2.2. United Kingdom
- 2.3. France
- 2.4. Italy
- 2.5. Spain
- 2.6. Rest of Europe
-
3. Asia Pacific
- 3.1. China
- 3.2. Japan
- 3.3. India
- 3.4. Australia
- 3.5. South Korea
- 3.6. Rest of Asia Pacific
-
4. Middle East and Africa
- 4.1. GCC
- 4.2. South Africa
- 4.3. Rest of Middle East and Africa
-
5. South America
- 5.1. Brazil
- 5.2. Argentina
- 5.3. Rest of South America
Automated Cell Culture Systems Market REPORT HIGHLIGHTS
| Aspects | Details |
|---|---|
| Study Period | 2019-2033 |
| Base Year | 2024 |
| Estimated Year | 2025 |
| Forecast Period | 2025-2033 |
| Historical Period | 2019-2024 |
| Growth Rate | CAGR of 8.32% from 2019-2033 |
| Segmentation |
|
Table of Contents
- 1. Introduction
- 1.1. Research Scope
- 1.2. Market Segmentation
- 1.3. Research Methodology
- 1.4. Definitions and Assumptions
- 2. Executive Summary
- 2.1. Introduction
- 3. Market Dynamics
- 3.1. Introduction
- 3.2. Market Drivers
- 3.2.1. Increased Demand for Biopharmaceuticals and Rising Incidence of Chronic Diseases; Rise in the Research Funding in Life Sciences Research and Advancements in Cell-Based Research
- 3.3. Market Restrains
- 3.3.1. High Investment Costs for the Automated Cell Culture Systems; Regulatory Compliance Challenges
- 3.4. Market Trends
- 3.4.1. The Drug Development Segment is Expected to Hold a Significant Market Share Over the Forecast Period
- 4. Market Factor Analysis
- 4.1. Porters Five Forces
- 4.2. Supply/Value Chain
- 4.3. PESTEL analysis
- 4.4. Market Entropy
- 4.5. Patent/Trademark Analysis
- 5. Global Automated Cell Culture Systems Market Analysis, Insights and Forecast, 2019-2031
- 5.1. Market Analysis, Insights and Forecast - by Product
- 5.1.1. Cell Culture Process Automation Instrument
- 5.1.2. Automated Bioreactor
- 5.1.3. Automated Cell Culture Media Exchange System
- 5.1.4. Automated Culture Media Analyzer
- 5.1.5. Automated Cell Counter
- 5.1.6. Other Products
- 5.2. Market Analysis, Insights and Forecast - by Cell Culture Type
- 5.2.1. Finite Cell Line Cultures
- 5.2.2. Infinite Cell Line Cultures
- 5.3. Market Analysis, Insights and Forecast - by Application
- 5.3.1. Cancer Research
- 5.3.2. Drug Development
- 5.3.3. Stem Cell Research
- 5.3.4. Regenerative Medicine
- 5.3.5. Cell Therapy
- 5.4. Market Analysis, Insights and Forecast - by End-User
- 5.4.1. Pharmaceutical Companies
- 5.4.2. Biotechnology Companies
- 5.4.3. CDMOs/CMOs
- 5.4.4. Research Organizations and Academic Institutes
- 5.4.5. Hospital
- 5.5. Market Analysis, Insights and Forecast - by Region
- 5.5.1. North America
- 5.5.2. Europe
- 5.5.3. Asia Pacific
- 5.5.4. Middle East and Africa
- 5.5.5. South America
- 5.1. Market Analysis, Insights and Forecast - by Product
- 6. North America Automated Cell Culture Systems Market Analysis, Insights and Forecast, 2019-2031
- 6.1. Market Analysis, Insights and Forecast - by Product
- 6.1.1. Cell Culture Process Automation Instrument
- 6.1.2. Automated Bioreactor
- 6.1.3. Automated Cell Culture Media Exchange System
- 6.1.4. Automated Culture Media Analyzer
- 6.1.5. Automated Cell Counter
- 6.1.6. Other Products
- 6.2. Market Analysis, Insights and Forecast - by Cell Culture Type
- 6.2.1. Finite Cell Line Cultures
- 6.2.2. Infinite Cell Line Cultures
- 6.3. Market Analysis, Insights and Forecast - by Application
- 6.3.1. Cancer Research
- 6.3.2. Drug Development
- 6.3.3. Stem Cell Research
- 6.3.4. Regenerative Medicine
- 6.3.5. Cell Therapy
- 6.4. Market Analysis, Insights and Forecast - by End-User
- 6.4.1. Pharmaceutical Companies
- 6.4.2. Biotechnology Companies
- 6.4.3. CDMOs/CMOs
- 6.4.4. Research Organizations and Academic Institutes
- 6.4.5. Hospital
- 6.1. Market Analysis, Insights and Forecast - by Product
- 7. Europe Automated Cell Culture Systems Market Analysis, Insights and Forecast, 2019-2031
- 7.1. Market Analysis, Insights and Forecast - by Product
- 7.1.1. Cell Culture Process Automation Instrument
- 7.1.2. Automated Bioreactor
- 7.1.3. Automated Cell Culture Media Exchange System
- 7.1.4. Automated Culture Media Analyzer
- 7.1.5. Automated Cell Counter
- 7.1.6. Other Products
- 7.2. Market Analysis, Insights and Forecast - by Cell Culture Type
- 7.2.1. Finite Cell Line Cultures
- 7.2.2. Infinite Cell Line Cultures
- 7.3. Market Analysis, Insights and Forecast - by Application
- 7.3.1. Cancer Research
- 7.3.2. Drug Development
- 7.3.3. Stem Cell Research
- 7.3.4. Regenerative Medicine
- 7.3.5. Cell Therapy
- 7.4. Market Analysis, Insights and Forecast - by End-User
- 7.4.1. Pharmaceutical Companies
- 7.4.2. Biotechnology Companies
- 7.4.3. CDMOs/CMOs
- 7.4.4. Research Organizations and Academic Institutes
- 7.4.5. Hospital
- 7.1. Market Analysis, Insights and Forecast - by Product
- 8. Asia Pacific Automated Cell Culture Systems Market Analysis, Insights and Forecast, 2019-2031
- 8.1. Market Analysis, Insights and Forecast - by Product
- 8.1.1. Cell Culture Process Automation Instrument
- 8.1.2. Automated Bioreactor
- 8.1.3. Automated Cell Culture Media Exchange System
- 8.1.4. Automated Culture Media Analyzer
- 8.1.5. Automated Cell Counter
- 8.1.6. Other Products
- 8.2. Market Analysis, Insights and Forecast - by Cell Culture Type
- 8.2.1. Finite Cell Line Cultures
- 8.2.2. Infinite Cell Line Cultures
- 8.3. Market Analysis, Insights and Forecast - by Application
- 8.3.1. Cancer Research
- 8.3.2. Drug Development
- 8.3.3. Stem Cell Research
- 8.3.4. Regenerative Medicine
- 8.3.5. Cell Therapy
- 8.4. Market Analysis, Insights and Forecast - by End-User
- 8.4.1. Pharmaceutical Companies
- 8.4.2. Biotechnology Companies
- 8.4.3. CDMOs/CMOs
- 8.4.4. Research Organizations and Academic Institutes
- 8.4.5. Hospital
- 8.1. Market Analysis, Insights and Forecast - by Product
- 9. Middle East and Africa Automated Cell Culture Systems Market Analysis, Insights and Forecast, 2019-2031
- 9.1. Market Analysis, Insights and Forecast - by Product
- 9.1.1. Cell Culture Process Automation Instrument
- 9.1.2. Automated Bioreactor
- 9.1.3. Automated Cell Culture Media Exchange System
- 9.1.4. Automated Culture Media Analyzer
- 9.1.5. Automated Cell Counter
- 9.1.6. Other Products
- 9.2. Market Analysis, Insights and Forecast - by Cell Culture Type
- 9.2.1. Finite Cell Line Cultures
- 9.2.2. Infinite Cell Line Cultures
- 9.3. Market Analysis, Insights and Forecast - by Application
- 9.3.1. Cancer Research
- 9.3.2. Drug Development
- 9.3.3. Stem Cell Research
- 9.3.4. Regenerative Medicine
- 9.3.5. Cell Therapy
- 9.4. Market Analysis, Insights and Forecast - by End-User
- 9.4.1. Pharmaceutical Companies
- 9.4.2. Biotechnology Companies
- 9.4.3. CDMOs/CMOs
- 9.4.4. Research Organizations and Academic Institutes
- 9.4.5. Hospital
- 9.1. Market Analysis, Insights and Forecast - by Product
- 10. South America Automated Cell Culture Systems Market Analysis, Insights and Forecast, 2019-2031
- 10.1. Market Analysis, Insights and Forecast - by Product
- 10.1.1. Cell Culture Process Automation Instrument
- 10.1.2. Automated Bioreactor
- 10.1.3. Automated Cell Culture Media Exchange System
- 10.1.4. Automated Culture Media Analyzer
- 10.1.5. Automated Cell Counter
- 10.1.6. Other Products
- 10.2. Market Analysis, Insights and Forecast - by Cell Culture Type
- 10.2.1. Finite Cell Line Cultures
- 10.2.2. Infinite Cell Line Cultures
- 10.3. Market Analysis, Insights and Forecast - by Application
- 10.3.1. Cancer Research
- 10.3.2. Drug Development
- 10.3.3. Stem Cell Research
- 10.3.4. Regenerative Medicine
- 10.3.5. Cell Therapy
- 10.4. Market Analysis, Insights and Forecast - by End-User
- 10.4.1. Pharmaceutical Companies
- 10.4.2. Biotechnology Companies
- 10.4.3. CDMOs/CMOs
- 10.4.4. Research Organizations and Academic Institutes
- 10.4.5. Hospital
- 10.1. Market Analysis, Insights and Forecast - by Product
- 11. North America Automated Cell Culture Systems Market Analysis, Insights and Forecast, 2019-2031
- 11.1. Market Analysis, Insights and Forecast - By Country/Sub-region
- 11.1.1 United States
- 11.1.2 Canada
- 11.1.3 Mexico
- 12. Europe Automated Cell Culture Systems Market Analysis, Insights and Forecast, 2019-2031
- 12.1. Market Analysis, Insights and Forecast - By Country/Sub-region
- 12.1.1 Germany
- 12.1.2 United Kingdom
- 12.1.3 France
- 12.1.4 Italy
- 12.1.5 Spain
- 12.1.6 Rest of Europe
- 13. Asia Pacific Automated Cell Culture Systems Market Analysis, Insights and Forecast, 2019-2031
- 13.1. Market Analysis, Insights and Forecast - By Country/Sub-region
- 13.1.1 China
- 13.1.2 Japan
- 13.1.3 India
- 13.1.4 Australia
- 13.1.5 South Korea
- 13.1.6 Rest of Asia Pacific
- 14. Middle East and Africa Automated Cell Culture Systems Market Analysis, Insights and Forecast, 2019-2031
- 14.1. Market Analysis, Insights and Forecast - By Country/Sub-region
- 14.1.1 GCC
- 14.1.2 South Africa
- 14.1.3 Rest of Middle East and Africa
- 15. South America Automated Cell Culture Systems Market Analysis, Insights and Forecast, 2019-2031
- 15.1. Market Analysis, Insights and Forecast - By Country/Sub-region
- 15.1.1 Brazil
- 15.1.2 Argentina
- 15.1.3 Rest of South America
- 16. Competitive Analysis
- 16.1. Global Market Share Analysis 2024
- 16.2. Company Profiles
- 16.2.1 PerkinElmer Inc (Nexcelom Bioscience LLC )
- 16.2.1.1. Overview
- 16.2.1.2. Products
- 16.2.1.3. SWOT Analysis
- 16.2.1.4. Recent Developments
- 16.2.1.5. Financials (Based on Availability)
- 16.2.2 Merck KGaA
- 16.2.2.1. Overview
- 16.2.2.2. Products
- 16.2.2.3. SWOT Analysis
- 16.2.2.4. Recent Developments
- 16.2.2.5. Financials (Based on Availability)
- 16.2.3 Becton Dickinson and Company (BD)
- 16.2.3.1. Overview
- 16.2.3.2. Products
- 16.2.3.3. SWOT Analysis
- 16.2.3.4. Recent Developments
- 16.2.3.5. Financials (Based on Availability)
- 16.2.4 F Hoffmann-La Roche Ltd
- 16.2.4.1. Overview
- 16.2.4.2. Products
- 16.2.4.3. SWOT Analysis
- 16.2.4.4. Recent Developments
- 16.2.4.5. Financials (Based on Availability)
- 16.2.5 Thermo Fisher Scientific Inc
- 16.2.5.1. Overview
- 16.2.5.2. Products
- 16.2.5.3. SWOT Analysis
- 16.2.5.4. Recent Developments
- 16.2.5.5. Financials (Based on Availability)
- 16.2.6 Hitachi Ltd
- 16.2.6.1. Overview
- 16.2.6.2. Products
- 16.2.6.3. SWOT Analysis
- 16.2.6.4. Recent Developments
- 16.2.6.5. Financials (Based on Availability)
- 16.2.7 Sartorius AG
- 16.2.7.1. Overview
- 16.2.7.2. Products
- 16.2.7.3. SWOT Analysis
- 16.2.7.4. Recent Developments
- 16.2.7.5. Financials (Based on Availability)
- 16.2.8 Agilent Technologies Inc
- 16.2.8.1. Overview
- 16.2.8.2. Products
- 16.2.8.3. SWOT Analysis
- 16.2.8.4. Recent Developments
- 16.2.8.5. Financials (Based on Availability)
- 16.2.9 Shimadzu Corporation
- 16.2.9.1. Overview
- 16.2.9.2. Products
- 16.2.9.3. SWOT Analysis
- 16.2.9.4. Recent Developments
- 16.2.9.5. Financials (Based on Availability)
- 16.2.10 Hamilton Company
- 16.2.10.1. Overview
- 16.2.10.2. Products
- 16.2.10.3. SWOT Analysis
- 16.2.10.4. Recent Developments
- 16.2.10.5. Financials (Based on Availability)
- 16.2.11 Danaher (Beckman Coulter Inc Cytiva)
- 16.2.11.1. Overview
- 16.2.11.2. Products
- 16.2.11.3. SWOT Analysis
- 16.2.11.4. Recent Developments
- 16.2.11.5. Financials (Based on Availability)
- 16.2.12 Corning Incorporated
- 16.2.12.1. Overview
- 16.2.12.2. Products
- 16.2.12.3. SWOT Analysis
- 16.2.12.4. Recent Developments
- 16.2.12.5. Financials (Based on Availability)
- 16.2.1 PerkinElmer Inc (Nexcelom Bioscience LLC )
List of Figures
- Figure 1: Global Automated Cell Culture Systems Market Revenue Breakdown (Million, %) by Region 2024 & 2032
- Figure 2: North America Automated Cell Culture Systems Market Revenue (Million), by Country 2024 & 2032
- Figure 3: North America Automated Cell Culture Systems Market Revenue Share (%), by Country 2024 & 2032
- Figure 4: Europe Automated Cell Culture Systems Market Revenue (Million), by Country 2024 & 2032
- Figure 5: Europe Automated Cell Culture Systems Market Revenue Share (%), by Country 2024 & 2032
- Figure 6: Asia Pacific Automated Cell Culture Systems Market Revenue (Million), by Country 2024 & 2032
- Figure 7: Asia Pacific Automated Cell Culture Systems Market Revenue Share (%), by Country 2024 & 2032
- Figure 8: Middle East and Africa Automated Cell Culture Systems Market Revenue (Million), by Country 2024 & 2032
- Figure 9: Middle East and Africa Automated Cell Culture Systems Market Revenue Share (%), by Country 2024 & 2032
- Figure 10: South America Automated Cell Culture Systems Market Revenue (Million), by Country 2024 & 2032
- Figure 11: South America Automated Cell Culture Systems Market Revenue Share (%), by Country 2024 & 2032
- Figure 12: North America Automated Cell Culture Systems Market Revenue (Million), by Product 2024 & 2032
- Figure 13: North America Automated Cell Culture Systems Market Revenue Share (%), by Product 2024 & 2032
- Figure 14: North America Automated Cell Culture Systems Market Revenue (Million), by Cell Culture Type 2024 & 2032
- Figure 15: North America Automated Cell Culture Systems Market Revenue Share (%), by Cell Culture Type 2024 & 2032
- Figure 16: North America Automated Cell Culture Systems Market Revenue (Million), by Application 2024 & 2032
- Figure 17: North America Automated Cell Culture Systems Market Revenue Share (%), by Application 2024 & 2032
- Figure 18: North America Automated Cell Culture Systems Market Revenue (Million), by End-User 2024 & 2032
- Figure 19: North America Automated Cell Culture Systems Market Revenue Share (%), by End-User 2024 & 2032
- Figure 20: North America Automated Cell Culture Systems Market Revenue (Million), by Country 2024 & 2032
- Figure 21: North America Automated Cell Culture Systems Market Revenue Share (%), by Country 2024 & 2032
- Figure 22: Europe Automated Cell Culture Systems Market Revenue (Million), by Product 2024 & 2032
- Figure 23: Europe Automated Cell Culture Systems Market Revenue Share (%), by Product 2024 & 2032
- Figure 24: Europe Automated Cell Culture Systems Market Revenue (Million), by Cell Culture Type 2024 & 2032
- Figure 25: Europe Automated Cell Culture Systems Market Revenue Share (%), by Cell Culture Type 2024 & 2032
- Figure 26: Europe Automated Cell Culture Systems Market Revenue (Million), by Application 2024 & 2032
- Figure 27: Europe Automated Cell Culture Systems Market Revenue Share (%), by Application 2024 & 2032
- Figure 28: Europe Automated Cell Culture Systems Market Revenue (Million), by End-User 2024 & 2032
- Figure 29: Europe Automated Cell Culture Systems Market Revenue Share (%), by End-User 2024 & 2032
- Figure 30: Europe Automated Cell Culture Systems Market Revenue (Million), by Country 2024 & 2032
- Figure 31: Europe Automated Cell Culture Systems Market Revenue Share (%), by Country 2024 & 2032
- Figure 32: Asia Pacific Automated Cell Culture Systems Market Revenue (Million), by Product 2024 & 2032
- Figure 33: Asia Pacific Automated Cell Culture Systems Market Revenue Share (%), by Product 2024 & 2032
- Figure 34: Asia Pacific Automated Cell Culture Systems Market Revenue (Million), by Cell Culture Type 2024 & 2032
- Figure 35: Asia Pacific Automated Cell Culture Systems Market Revenue Share (%), by Cell Culture Type 2024 & 2032
- Figure 36: Asia Pacific Automated Cell Culture Systems Market Revenue (Million), by Application 2024 & 2032
- Figure 37: Asia Pacific Automated Cell Culture Systems Market Revenue Share (%), by Application 2024 & 2032
- Figure 38: Asia Pacific Automated Cell Culture Systems Market Revenue (Million), by End-User 2024 & 2032
- Figure 39: Asia Pacific Automated Cell Culture Systems Market Revenue Share (%), by End-User 2024 & 2032
- Figure 40: Asia Pacific Automated Cell Culture Systems Market Revenue (Million), by Country 2024 & 2032
- Figure 41: Asia Pacific Automated Cell Culture Systems Market Revenue Share (%), by Country 2024 & 2032
- Figure 42: Middle East and Africa Automated Cell Culture Systems Market Revenue (Million), by Product 2024 & 2032
- Figure 43: Middle East and Africa Automated Cell Culture Systems Market Revenue Share (%), by Product 2024 & 2032
- Figure 44: Middle East and Africa Automated Cell Culture Systems Market Revenue (Million), by Cell Culture Type 2024 & 2032
- Figure 45: Middle East and Africa Automated Cell Culture Systems Market Revenue Share (%), by Cell Culture Type 2024 & 2032
- Figure 46: Middle East and Africa Automated Cell Culture Systems Market Revenue (Million), by Application 2024 & 2032
- Figure 47: Middle East and Africa Automated Cell Culture Systems Market Revenue Share (%), by Application 2024 & 2032
- Figure 48: Middle East and Africa Automated Cell Culture Systems Market Revenue (Million), by End-User 2024 & 2032
- Figure 49: Middle East and Africa Automated Cell Culture Systems Market Revenue Share (%), by End-User 2024 & 2032
- Figure 50: Middle East and Africa Automated Cell Culture Systems Market Revenue (Million), by Country 2024 & 2032
- Figure 51: Middle East and Africa Automated Cell Culture Systems Market Revenue Share (%), by Country 2024 & 2032
- Figure 52: South America Automated Cell Culture Systems Market Revenue (Million), by Product 2024 & 2032
- Figure 53: South America Automated Cell Culture Systems Market Revenue Share (%), by Product 2024 & 2032
- Figure 54: South America Automated Cell Culture Systems Market Revenue (Million), by Cell Culture Type 2024 & 2032
- Figure 55: South America Automated Cell Culture Systems Market Revenue Share (%), by Cell Culture Type 2024 & 2032
- Figure 56: South America Automated Cell Culture Systems Market Revenue (Million), by Application 2024 & 2032
- Figure 57: South America Automated Cell Culture Systems Market Revenue Share (%), by Application 2024 & 2032
- Figure 58: South America Automated Cell Culture Systems Market Revenue (Million), by End-User 2024 & 2032
- Figure 59: South America Automated Cell Culture Systems Market Revenue Share (%), by End-User 2024 & 2032
- Figure 60: South America Automated Cell Culture Systems Market Revenue (Million), by Country 2024 & 2032
- Figure 61: South America Automated Cell Culture Systems Market Revenue Share (%), by Country 2024 & 2032
List of Tables
- Table 1: Global Automated Cell Culture Systems Market Revenue Million Forecast, by Region 2019 & 2032
- Table 2: Global Automated Cell Culture Systems Market Revenue Million Forecast, by Product 2019 & 2032
- Table 3: Global Automated Cell Culture Systems Market Revenue Million Forecast, by Cell Culture Type 2019 & 2032
- Table 4: Global Automated Cell Culture Systems Market Revenue Million Forecast, by Application 2019 & 2032
- Table 5: Global Automated Cell Culture Systems Market Revenue Million Forecast, by End-User 2019 & 2032
- Table 6: Global Automated Cell Culture Systems Market Revenue Million Forecast, by Region 2019 & 2032
- Table 7: Global Automated Cell Culture Systems Market Revenue Million Forecast, by Country 2019 & 2032
- Table 8: United States Automated Cell Culture Systems Market Revenue (Million) Forecast, by Application 2019 & 2032
- Table 9: Canada Automated Cell Culture Systems Market Revenue (Million) Forecast, by Application 2019 & 2032
- Table 10: Mexico Automated Cell Culture Systems Market Revenue (Million) Forecast, by Application 2019 & 2032
- Table 11: Global Automated Cell Culture Systems Market Revenue Million Forecast, by Country 2019 & 2032
- Table 12: Germany Automated Cell Culture Systems Market Revenue (Million) Forecast, by Application 2019 & 2032
- Table 13: United Kingdom Automated Cell Culture Systems Market Revenue (Million) Forecast, by Application 2019 & 2032
- Table 14: France Automated Cell Culture Systems Market Revenue (Million) Forecast, by Application 2019 & 2032
- Table 15: Italy Automated Cell Culture Systems Market Revenue (Million) Forecast, by Application 2019 & 2032
- Table 16: Spain Automated Cell Culture Systems Market Revenue (Million) Forecast, by Application 2019 & 2032
- Table 17: Rest of Europe Automated Cell Culture Systems Market Revenue (Million) Forecast, by Application 2019 & 2032
- Table 18: Global Automated Cell Culture Systems Market Revenue Million Forecast, by Country 2019 & 2032
- Table 19: China Automated Cell Culture Systems Market Revenue (Million) Forecast, by Application 2019 & 2032
- Table 20: Japan Automated Cell Culture Systems Market Revenue (Million) Forecast, by Application 2019 & 2032
- Table 21: India Automated Cell Culture Systems Market Revenue (Million) Forecast, by Application 2019 & 2032
- Table 22: Australia Automated Cell Culture Systems Market Revenue (Million) Forecast, by Application 2019 & 2032
- Table 23: South Korea Automated Cell Culture Systems Market Revenue (Million) Forecast, by Application 2019 & 2032
- Table 24: Rest of Asia Pacific Automated Cell Culture Systems Market Revenue (Million) Forecast, by Application 2019 & 2032
- Table 25: Global Automated Cell Culture Systems Market Revenue Million Forecast, by Country 2019 & 2032
- Table 26: GCC Automated Cell Culture Systems Market Revenue (Million) Forecast, by Application 2019 & 2032
- Table 27: South Africa Automated Cell Culture Systems Market Revenue (Million) Forecast, by Application 2019 & 2032
- Table 28: Rest of Middle East and Africa Automated Cell Culture Systems Market Revenue (Million) Forecast, by Application 2019 & 2032
- Table 29: Global Automated Cell Culture Systems Market Revenue Million Forecast, by Country 2019 & 2032
- Table 30: Brazil Automated Cell Culture Systems Market Revenue (Million) Forecast, by Application 2019 & 2032
- Table 31: Argentina Automated Cell Culture Systems Market Revenue (Million) Forecast, by Application 2019 & 2032
- Table 32: Rest of South America Automated Cell Culture Systems Market Revenue (Million) Forecast, by Application 2019 & 2032
- Table 33: Global Automated Cell Culture Systems Market Revenue Million Forecast, by Product 2019 & 2032
- Table 34: Global Automated Cell Culture Systems Market Revenue Million Forecast, by Cell Culture Type 2019 & 2032
- Table 35: Global Automated Cell Culture Systems Market Revenue Million Forecast, by Application 2019 & 2032
- Table 36: Global Automated Cell Culture Systems Market Revenue Million Forecast, by End-User 2019 & 2032
- Table 37: Global Automated Cell Culture Systems Market Revenue Million Forecast, by Country 2019 & 2032
- Table 38: United States Automated Cell Culture Systems Market Revenue (Million) Forecast, by Application 2019 & 2032
- Table 39: Canada Automated Cell Culture Systems Market Revenue (Million) Forecast, by Application 2019 & 2032
- Table 40: Mexico Automated Cell Culture Systems Market Revenue (Million) Forecast, by Application 2019 & 2032
- Table 41: Global Automated Cell Culture Systems Market Revenue Million Forecast, by Product 2019 & 2032
- Table 42: Global Automated Cell Culture Systems Market Revenue Million Forecast, by Cell Culture Type 2019 & 2032
- Table 43: Global Automated Cell Culture Systems Market Revenue Million Forecast, by Application 2019 & 2032
- Table 44: Global Automated Cell Culture Systems Market Revenue Million Forecast, by End-User 2019 & 2032
- Table 45: Global Automated Cell Culture Systems Market Revenue Million Forecast, by Country 2019 & 2032
- Table 46: Germany Automated Cell Culture Systems Market Revenue (Million) Forecast, by Application 2019 & 2032
- Table 47: United Kingdom Automated Cell Culture Systems Market Revenue (Million) Forecast, by Application 2019 & 2032
- Table 48: France Automated Cell Culture Systems Market Revenue (Million) Forecast, by Application 2019 & 2032
- Table 49: Italy Automated Cell Culture Systems Market Revenue (Million) Forecast, by Application 2019 & 2032
- Table 50: Spain Automated Cell Culture Systems Market Revenue (Million) Forecast, by Application 2019 & 2032
- Table 51: Rest of Europe Automated Cell Culture Systems Market Revenue (Million) Forecast, by Application 2019 & 2032
- Table 52: Global Automated Cell Culture Systems Market Revenue Million Forecast, by Product 2019 & 2032
- Table 53: Global Automated Cell Culture Systems Market Revenue Million Forecast, by Cell Culture Type 2019 & 2032
- Table 54: Global Automated Cell Culture Systems Market Revenue Million Forecast, by Application 2019 & 2032
- Table 55: Global Automated Cell Culture Systems Market Revenue Million Forecast, by End-User 2019 & 2032
- Table 56: Global Automated Cell Culture Systems Market Revenue Million Forecast, by Country 2019 & 2032
- Table 57: China Automated Cell Culture Systems Market Revenue (Million) Forecast, by Application 2019 & 2032
- Table 58: Japan Automated Cell Culture Systems Market Revenue (Million) Forecast, by Application 2019 & 2032
- Table 59: India Automated Cell Culture Systems Market Revenue (Million) Forecast, by Application 2019 & 2032
- Table 60: Australia Automated Cell Culture Systems Market Revenue (Million) Forecast, by Application 2019 & 2032
- Table 61: South Korea Automated Cell Culture Systems Market Revenue (Million) Forecast, by Application 2019 & 2032
- Table 62: Rest of Asia Pacific Automated Cell Culture Systems Market Revenue (Million) Forecast, by Application 2019 & 2032
- Table 63: Global Automated Cell Culture Systems Market Revenue Million Forecast, by Product 2019 & 2032
- Table 64: Global Automated Cell Culture Systems Market Revenue Million Forecast, by Cell Culture Type 2019 & 2032
- Table 65: Global Automated Cell Culture Systems Market Revenue Million Forecast, by Application 2019 & 2032
- Table 66: Global Automated Cell Culture Systems Market Revenue Million Forecast, by End-User 2019 & 2032
- Table 67: Global Automated Cell Culture Systems Market Revenue Million Forecast, by Country 2019 & 2032
- Table 68: GCC Automated Cell Culture Systems Market Revenue (Million) Forecast, by Application 2019 & 2032
- Table 69: South Africa Automated Cell Culture Systems Market Revenue (Million) Forecast, by Application 2019 & 2032
- Table 70: Rest of Middle East and Africa Automated Cell Culture Systems Market Revenue (Million) Forecast, by Application 2019 & 2032
- Table 71: Global Automated Cell Culture Systems Market Revenue Million Forecast, by Product 2019 & 2032
- Table 72: Global Automated Cell Culture Systems Market Revenue Million Forecast, by Cell Culture Type 2019 & 2032
- Table 73: Global Automated Cell Culture Systems Market Revenue Million Forecast, by Application 2019 & 2032
- Table 74: Global Automated Cell Culture Systems Market Revenue Million Forecast, by End-User 2019 & 2032
- Table 75: Global Automated Cell Culture Systems Market Revenue Million Forecast, by Country 2019 & 2032
- Table 76: Brazil Automated Cell Culture Systems Market Revenue (Million) Forecast, by Application 2019 & 2032
- Table 77: Argentina Automated Cell Culture Systems Market Revenue (Million) Forecast, by Application 2019 & 2032
- Table 78: Rest of South America Automated Cell Culture Systems Market Revenue (Million) Forecast, by Application 2019 & 2032
Frequently Asked Questions
1. What is the projected Compound Annual Growth Rate (CAGR) of the Automated Cell Culture Systems Market?
The projected CAGR is approximately 8.32%.
2. Which companies are prominent players in the Automated Cell Culture Systems Market?
Key companies in the market include PerkinElmer Inc (Nexcelom Bioscience LLC ), Merck KGaA, Becton Dickinson and Company (BD), F Hoffmann-La Roche Ltd, Thermo Fisher Scientific Inc, Hitachi Ltd, Sartorius AG, Agilent Technologies Inc, Shimadzu Corporation, Hamilton Company, Danaher (Beckman Coulter Inc Cytiva), Corning Incorporated.
3. What are the main segments of the Automated Cell Culture Systems Market?
The market segments include Product, Cell Culture Type, Application, End-User.
4. Can you provide details about the market size?
The market size is estimated to be USD 13.17 Million as of 2022.
5. What are some drivers contributing to market growth?
Increased Demand for Biopharmaceuticals and Rising Incidence of Chronic Diseases; Rise in the Research Funding in Life Sciences Research and Advancements in Cell-Based Research.
6. What are the notable trends driving market growth?
The Drug Development Segment is Expected to Hold a Significant Market Share Over the Forecast Period.
7. Are there any restraints impacting market growth?
High Investment Costs for the Automated Cell Culture Systems; Regulatory Compliance Challenges.
8. Can you provide examples of recent developments in the market?
N/A
9. What pricing options are available for accessing the report?
Pricing options include single-user, multi-user, and enterprise licenses priced at USD 4750, USD 5250, and USD 8750 respectively.
10. Is the market size provided in terms of value or volume?
The market size is provided in terms of value, measured in Million.
11. Are there any specific market keywords associated with the report?
Yes, the market keyword associated with the report is "Automated Cell Culture Systems Market," which aids in identifying and referencing the specific market segment covered.
12. How do I determine which pricing option suits my needs best?
The pricing options vary based on user requirements and access needs. Individual users may opt for single-user licenses, while businesses requiring broader access may choose multi-user or enterprise licenses for cost-effective access to the report.
13. Are there any additional resources or data provided in the Automated Cell Culture Systems Market report?
While the report offers comprehensive insights, it's advisable to review the specific contents or supplementary materials provided to ascertain if additional resources or data are available.
14. How can I stay updated on further developments or reports in the Automated Cell Culture Systems Market?
To stay informed about further developments, trends, and reports in the Automated Cell Culture Systems Market, consider subscribing to industry newsletters, following relevant companies and organizations, or regularly checking reputable industry news sources and publications.
Methodology
Step 1 - Identification of Relevant Samples Size from Population Database


Step 2 - Approaches for Defining Global Market Size (Value, Volume* & Price*)

Note*: In applicable scenarios
Step 3 - Data Sources
Primary Research
- Web Analytics
- Survey Reports
- Research Institute
- Latest Research Reports
- Opinion Leaders
Secondary Research
- Annual Reports
- White Paper
- Latest Press Release
- Industry Association
- Paid Database
- Investor Presentations

Step 4 - Data Triangulation
Involves using different sources of information in order to increase the validity of a study
These sources are likely to be stakeholders in a program - participants, other researchers, program staff, other community members, and so on.
Then we put all data in single framework & apply various statistical tools to find out the dynamic on the market.
During the analysis stage, feedback from the stakeholder groups would be compared to determine areas of agreement as well as areas of divergence


