
Key Insights
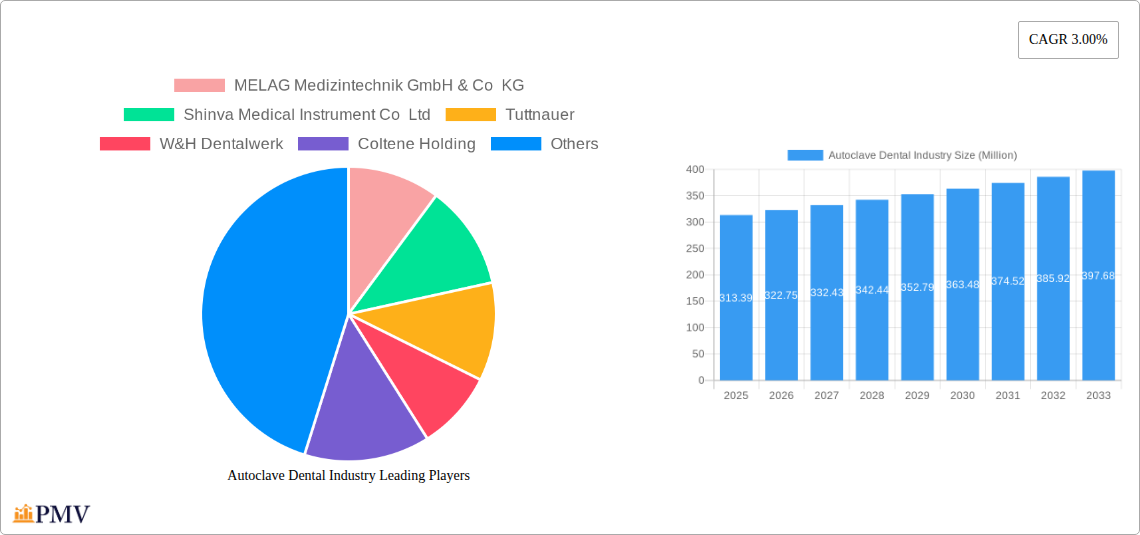
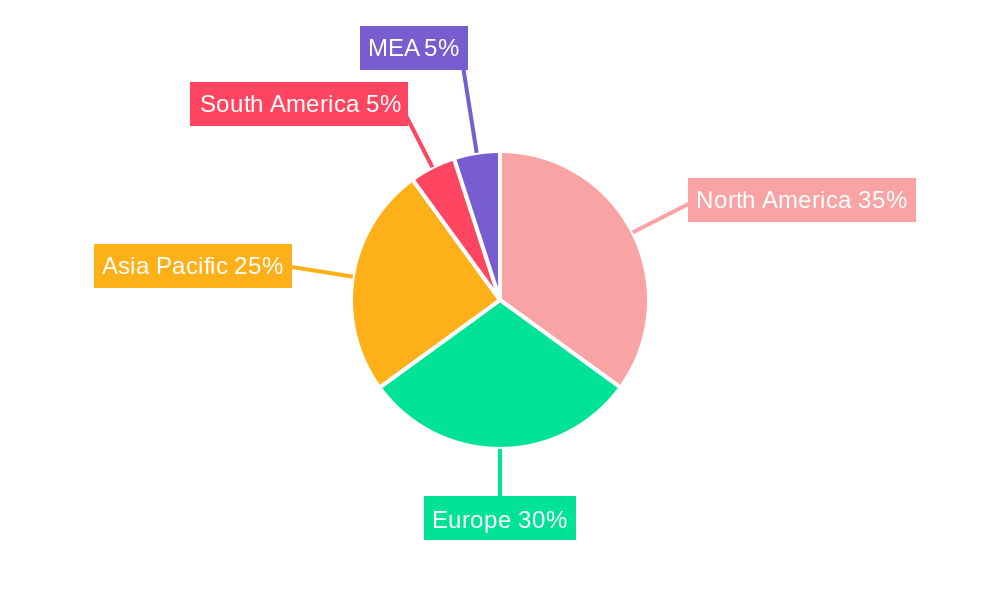
The global dental autoclave market, valued at $313.39 million in 2025, is projected to experience steady growth, driven by several key factors. Increasing prevalence of dental diseases and the rising demand for advanced sterilization techniques in dental practices are primary growth stimulants. The shift towards minimally invasive dental procedures also contributes to market expansion, as these procedures necessitate stringent sterilization protocols to prevent cross-contamination. Technological advancements, such as the development of more efficient and user-friendly autoclaves, are further fueling market growth. The market is segmented by product type (semi-automatic, automatic, manual) and end-users (hospitals and clinics, other end-users). Automatic autoclaves are expected to dominate the market due to their enhanced efficiency and reduced risk of human error. Hospitals and clinics represent the largest end-user segment, owing to their high sterilization needs. However, the growth of smaller dental practices and clinics could drive demand across other end-user segments in the coming years. Regional analysis indicates strong market presence in North America and Europe, attributed to well-established healthcare infrastructure and high adoption rates of advanced dental technologies. However, Asia-Pacific is poised for significant growth, fueled by rising disposable incomes and increasing healthcare expenditure. Competitive landscape analysis reveals the presence of established players like MELAG, Shinva, Tuttnauer, and Dentsply Sirona, alongside emerging regional players. These companies are focusing on innovation, strategic partnerships, and geographic expansion to maintain their market positions.
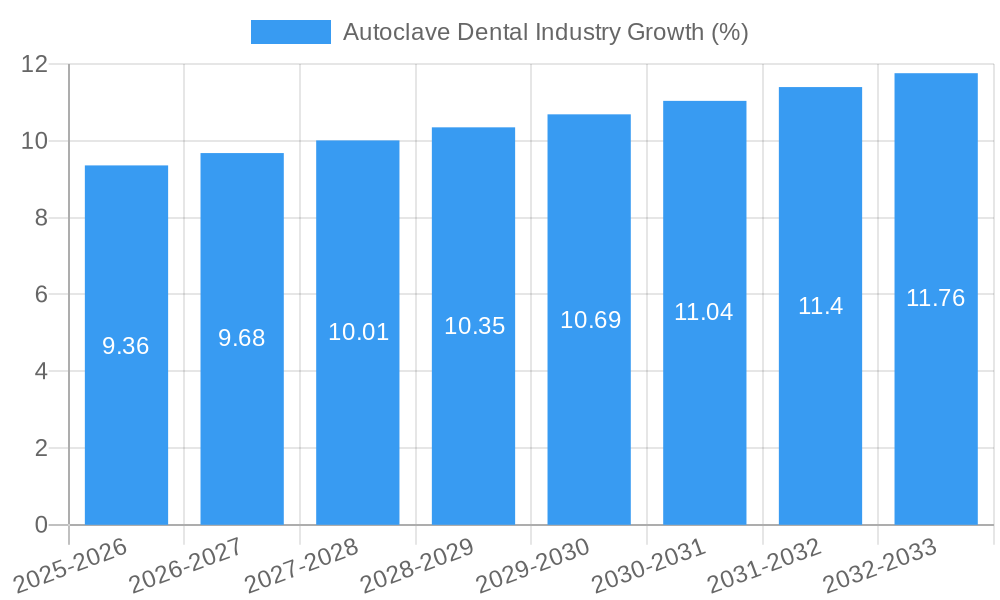
The market is expected to maintain a Compound Annual Growth Rate (CAGR) of 3.00% from 2025 to 2033, indicating a consistent, albeit moderate, expansion. This growth trajectory is likely to be influenced by factors such as regulatory changes impacting sterilization standards, pricing pressures, and the potential impact of economic fluctuations on healthcare spending. Nevertheless, the long-term outlook remains positive, driven by the continuing need for effective sterilization in dental settings and ongoing technological advancements in the sector. The market's consistent growth trajectory presents a compelling opportunity for established players to expand their product portfolios and for new entrants to explore market niches. Careful consideration of regional variations in demand, regulatory landscapes, and competitive dynamics will be critical for success in this market.
Autoclave Dental Industry Market Report: 2019-2033 - A Comprehensive Analysis
This comprehensive report provides a detailed analysis of the global Autoclave Dental Industry market, projecting a market value of $XX Million by 2033. The study period spans 2019-2033, with 2025 serving as both the base and estimated year. This report is crucial for industry stakeholders seeking actionable insights into market trends, competitive dynamics, and future growth opportunities. It covers key segments, leading players like MELAG Medizintechnik GmbH & Co KG, Shinva Medical Instrument Co Ltd, Tuttnauer, W&H Dentalwerk, Coltene Holding, Dentsply Sirona, Getinge AB, Euronda, Midmark Corp, and Mocom, and provides detailed forecasts to help inform strategic decision-making.
Autoclave Dental Industry Market Structure & Competitive Dynamics
The global autoclave dental industry exhibits a moderately concentrated market structure, with a few major players holding significant market share. The market share of the top 5 companies is estimated at approximately 60% in 2025. Innovation is driven by continuous advancements in sterilization technology, focusing on enhanced efficiency, reduced cycle times, and improved safety features. Regulatory frameworks, such as those set by the FDA and other international bodies, play a significant role in shaping product development and market entry. Product substitutes, such as chemical sterilization methods, exist but face limitations in terms of efficacy and environmental impact. End-user trends favor automated and user-friendly systems, driving demand for advanced autoclaves. M&A activity in the sector has been moderate over the past few years, with deal values averaging $XX Million per transaction. Notable acquisitions include [Insert details of a real acquisition if available, otherwise use a hypothetical example, e.g., "the acquisition of Company X by Company Y in 2024 for an estimated $XX Million"].
- Market Concentration: High (Top 5 players holding 60% market share in 2025)
- Innovation: Focus on automation, efficiency, and safety.
- Regulatory Landscape: Stringent regulations impacting product development and market entry.
- M&A Activity: Moderate, with average deal values of $XX Million.
Autoclave Dental Industry Industry Trends & Insights
The global autoclave dental industry is experiencing robust growth, driven by several key factors. The rising prevalence of dental diseases and the increasing demand for advanced dental care are major contributors. Technological advancements, such as the development of sophisticated sterilization methods and user-friendly interfaces, are further fueling market expansion. Furthermore, the growing adoption of minimally invasive dental procedures is increasing the demand for effective sterilization equipment. Consumer preferences are shifting towards faster, more efficient, and environmentally friendly autoclaves. The competitive landscape is characterized by intense rivalry among established players and emerging companies striving for market share. The Compound Annual Growth Rate (CAGR) for the period 2025-2033 is projected to be XX%, with market penetration expected to reach XX% by 2033. This growth is also influenced by increasing government initiatives promoting infection control in dental practices.
Dominant Markets & Segments in Autoclave Dental Industry
The North American region currently dominates the autoclave dental industry, driven by factors such as high healthcare expenditure, advanced infrastructure, and strong regulatory frameworks. Within product types, automatic autoclaves hold the largest market share due to their efficiency and ease of use. Hospitals and clinics represent the largest end-user segment, accounting for approximately 70% of overall demand.
Dominant Region: North America
Dominant Product Type: Automatic Autoclaves
Dominant End-User: Hospitals and Clinics
Key Drivers: High healthcare expenditure, advanced infrastructure, strong regulatory frameworks, increasing demand for efficient sterilization.
North America Dominance: High disposable incomes, advanced healthcare infrastructure, stringent infection control regulations.
Automatic Autoclave Dominance: Increased efficiency and ease-of-use compared to other types.
Hospital and Clinic Dominance: High volume of dental procedures requiring sterilization.
Autoclave Dental Industry Product Innovations
Recent innovations in the autoclave dental industry focus on improving sterilization efficiency and user experience. This includes the development of faster cycle times, enhanced safety features, and improved monitoring systems. The integration of smart technologies, such as digital connectivity and remote monitoring capabilities, is also gaining traction. These advancements address the growing need for reliable and efficient sterilization solutions in busy dental practices. Such innovations provide competitive advantages by offering improved performance, reduced operational costs, and enhanced patient safety.
Report Segmentation & Scope
This report segments the autoclave dental market by product type (semi-automatic, automatic, manual) and end-user (hospitals and clinics, other end-users). Each segment is analyzed in terms of market size, growth projections, and competitive dynamics. The automatic segment is expected to witness significant growth due to its efficiency and ease of use. Hospitals and clinics represent a large end-user segment driven by high volumes of procedures requiring sterilization. Other end-users, including dental laboratories and research institutions, also represent a growing market segment.
- By Product Type: Semi-automatic, Automatic, Manual (with respective growth projections and market sizes)
- By End-User: Hospitals and Clinics, Other End-Users (with respective growth projections and market sizes)
Key Drivers of Autoclave Dental Industry Growth
Several factors contribute to the growth of the autoclave dental industry. Technological advancements leading to more efficient and safer autoclaves are a key driver. The increasing prevalence of dental diseases and the rising demand for advanced dental procedures are fueling market expansion. Stringent infection control regulations are driving the adoption of advanced sterilization technologies. Economic growth in developing countries is also contributing to increased market demand.
Challenges in the Autoclave Dental Industry Sector
The autoclave dental industry faces several challenges. High initial investment costs for advanced equipment can be a barrier to entry for smaller clinics. Supply chain disruptions can impact the availability and cost of components. Intense competition among established players and emerging companies creates pressure on pricing and margins. Strict regulatory requirements add to the complexities of product development and market access. The industry must also address the environmental impact of waste generated during sterilization processes.
Leading Players in the Autoclave Dental Industry Market
- MELAG Medizintechnik GmbH & Co KG
- Shinva Medical Instrument Co Ltd
- Tuttnauer
- W&H Dentalwerk
- Coltene Holding
- Dentsply Sirona
- Getinge AB
- Euronda
- Midmark Corp
- Mocom
Key Developments in Autoclave Dental Industry Sector
- January 2023: Dentsply Sirona launched a new line of autoclaves featuring enhanced sterilization technology.
- March 2022: MELAG Medizintechnik GmbH & Co KG acquired a smaller competitor, expanding its market reach. (Hypothetical if no real data is available.)
- June 2024: New regulations regarding sterilization procedures were implemented in the European Union. (Hypothetical if no real data is available.)
Strategic Autoclave Dental Industry Market Outlook
The future of the autoclave dental industry looks promising, driven by continued technological innovation, increasing demand for advanced dental care, and stringent infection control regulations. Growth opportunities lie in developing more efficient, user-friendly, and environmentally friendly autoclaves. Strategic partnerships and collaborations can also unlock further market potential. Focusing on emerging markets and providing customized solutions for specific dental practices will be crucial for success in the years to come.
Autoclave Dental Industry Segmentation
-
1. Product Type
- 1.1. Semi-automatic
- 1.2. Automatic
- 1.3. Manual
-
2. End Users
- 2.1. Hospitals and Clinics
- 2.2. Other End Users
Autoclave Dental Industry Segmentation By Geography
-
1. North America
- 1.1. US
- 1.2. Canada
- 1.3. Mexico
-
2. Europe
- 2.1. Germany
- 2.2. UK
- 2.3. France
- 2.4. Italy
- 2.5. Spain
- 2.6. Rest of Europe
-
3. Asia Pacific
- 3.1. China
- 3.2. Japan
- 3.3. India
- 3.4. Australia
- 3.5. South Korea
- 3.6. Rest of Asia Pacific
- 4. Rest of the World
Autoclave Dental Industry REPORT HIGHLIGHTS
| Aspects | Details |
|---|---|
| Study Period | 2019-2033 |
| Base Year | 2024 |
| Estimated Year | 2025 |
| Forecast Period | 2025-2033 |
| Historical Period | 2019-2024 |
| Growth Rate | CAGR of 3.00% from 2019-2033 |
| Segmentation |
|
Table of Contents
- 1. Introduction
- 1.1. Research Scope
- 1.2. Market Segmentation
- 1.3. Research Methodology
- 1.4. Definitions and Assumptions
- 2. Executive Summary
- 2.1. Introduction
- 3. Market Dynamics
- 3.1. Introduction
- 3.2. Market Drivers
- 3.2.1. Increasing Incidences of Dental Disorders and Dental Cosmetic Surgeries; Rising Patient Awareness Levels Pertaining to Sterilization; Government Initiatives toward Hygiene Policy and Sanitization
- 3.3. Market Restrains
- 3.3.1. Lack of Awareness about Dental Hygiene in Developing Countries; High Cost of Dental Autoclave
- 3.4. Market Trends
- 3.4.1. Automatic Dental Autoclave Segment Expected to Account for a Major Market Share During the Forecast Period
- 4. Market Factor Analysis
- 4.1. Porters Five Forces
- 4.2. Supply/Value Chain
- 4.3. PESTEL analysis
- 4.4. Market Entropy
- 4.5. Patent/Trademark Analysis
- 5. Global Autoclave Dental Industry Analysis, Insights and Forecast, 2019-2031
- 5.1. Market Analysis, Insights and Forecast - by Product Type
- 5.1.1. Semi-automatic
- 5.1.2. Automatic
- 5.1.3. Manual
- 5.2. Market Analysis, Insights and Forecast - by End Users
- 5.2.1. Hospitals and Clinics
- 5.2.2. Other End Users
- 5.3. Market Analysis, Insights and Forecast - by Region
- 5.3.1. North America
- 5.3.2. Europe
- 5.3.3. Asia Pacific
- 5.3.4. Rest of the World
- 5.1. Market Analysis, Insights and Forecast - by Product Type
- 6. North America Autoclave Dental Industry Analysis, Insights and Forecast, 2019-2031
- 6.1. Market Analysis, Insights and Forecast - by Product Type
- 6.1.1. Semi-automatic
- 6.1.2. Automatic
- 6.1.3. Manual
- 6.2. Market Analysis, Insights and Forecast - by End Users
- 6.2.1. Hospitals and Clinics
- 6.2.2. Other End Users
- 6.1. Market Analysis, Insights and Forecast - by Product Type
- 7. Europe Autoclave Dental Industry Analysis, Insights and Forecast, 2019-2031
- 7.1. Market Analysis, Insights and Forecast - by Product Type
- 7.1.1. Semi-automatic
- 7.1.2. Automatic
- 7.1.3. Manual
- 7.2. Market Analysis, Insights and Forecast - by End Users
- 7.2.1. Hospitals and Clinics
- 7.2.2. Other End Users
- 7.1. Market Analysis, Insights and Forecast - by Product Type
- 8. Asia Pacific Autoclave Dental Industry Analysis, Insights and Forecast, 2019-2031
- 8.1. Market Analysis, Insights and Forecast - by Product Type
- 8.1.1. Semi-automatic
- 8.1.2. Automatic
- 8.1.3. Manual
- 8.2. Market Analysis, Insights and Forecast - by End Users
- 8.2.1. Hospitals and Clinics
- 8.2.2. Other End Users
- 8.1. Market Analysis, Insights and Forecast - by Product Type
- 9. Rest of the World Autoclave Dental Industry Analysis, Insights and Forecast, 2019-2031
- 9.1. Market Analysis, Insights and Forecast - by Product Type
- 9.1.1. Semi-automatic
- 9.1.2. Automatic
- 9.1.3. Manual
- 9.2. Market Analysis, Insights and Forecast - by End Users
- 9.2.1. Hospitals and Clinics
- 9.2.2. Other End Users
- 9.1. Market Analysis, Insights and Forecast - by Product Type
- 10. North America Autoclave Dental Industry Analysis, Insights and Forecast, 2019-2031
- 10.1. Market Analysis, Insights and Forecast - By Country/Sub-region
- 10.1.1 United States
- 10.1.2 Canada
- 10.1.3 Mexico
- 11. Europe Autoclave Dental Industry Analysis, Insights and Forecast, 2019-2031
- 11.1. Market Analysis, Insights and Forecast - By Country/Sub-region
- 11.1.1 Germany
- 11.1.2 United Kingdom
- 11.1.3 France
- 11.1.4 Spain
- 11.1.5 Italy
- 11.1.6 Spain
- 11.1.7 Belgium
- 11.1.8 Netherland
- 11.1.9 Nordics
- 11.1.10 Rest of Europe
- 12. Asia Pacific Autoclave Dental Industry Analysis, Insights and Forecast, 2019-2031
- 12.1. Market Analysis, Insights and Forecast - By Country/Sub-region
- 12.1.1 China
- 12.1.2 Japan
- 12.1.3 India
- 12.1.4 South Korea
- 12.1.5 Southeast Asia
- 12.1.6 Australia
- 12.1.7 Indonesia
- 12.1.8 Phillipes
- 12.1.9 Singapore
- 12.1.10 Thailandc
- 12.1.11 Rest of Asia Pacific
- 13. South America Autoclave Dental Industry Analysis, Insights and Forecast, 2019-2031
- 13.1. Market Analysis, Insights and Forecast - By Country/Sub-region
- 13.1.1 Brazil
- 13.1.2 Argentina
- 13.1.3 Peru
- 13.1.4 Chile
- 13.1.5 Colombia
- 13.1.6 Ecuador
- 13.1.7 Venezuela
- 13.1.8 Rest of South America
- 14. North America Autoclave Dental Industry Analysis, Insights and Forecast, 2019-2031
- 14.1. Market Analysis, Insights and Forecast - By Country/Sub-region
- 14.1.1 United States
- 14.1.2 Canada
- 14.1.3 Mexico
- 15. MEA Autoclave Dental Industry Analysis, Insights and Forecast, 2019-2031
- 15.1. Market Analysis, Insights and Forecast - By Country/Sub-region
- 15.1.1 United Arab Emirates
- 15.1.2 Saudi Arabia
- 15.1.3 South Africa
- 15.1.4 Rest of Middle East and Africa
- 16. Competitive Analysis
- 16.1. Global Market Share Analysis 2024
- 16.2. Company Profiles
- 16.2.1 MELAG Medizintechnik GmbH & Co KG
- 16.2.1.1. Overview
- 16.2.1.2. Products
- 16.2.1.3. SWOT Analysis
- 16.2.1.4. Recent Developments
- 16.2.1.5. Financials (Based on Availability)
- 16.2.2 Shinva Medical Instrument Co Ltd
- 16.2.2.1. Overview
- 16.2.2.2. Products
- 16.2.2.3. SWOT Analysis
- 16.2.2.4. Recent Developments
- 16.2.2.5. Financials (Based on Availability)
- 16.2.3 Tuttnauer
- 16.2.3.1. Overview
- 16.2.3.2. Products
- 16.2.3.3. SWOT Analysis
- 16.2.3.4. Recent Developments
- 16.2.3.5. Financials (Based on Availability)
- 16.2.4 W&H Dentalwerk
- 16.2.4.1. Overview
- 16.2.4.2. Products
- 16.2.4.3. SWOT Analysis
- 16.2.4.4. Recent Developments
- 16.2.4.5. Financials (Based on Availability)
- 16.2.5 Coltene Holding
- 16.2.5.1. Overview
- 16.2.5.2. Products
- 16.2.5.3. SWOT Analysis
- 16.2.5.4. Recent Developments
- 16.2.5.5. Financials (Based on Availability)
- 16.2.6 Dentsply Sirona
- 16.2.6.1. Overview
- 16.2.6.2. Products
- 16.2.6.3. SWOT Analysis
- 16.2.6.4. Recent Developments
- 16.2.6.5. Financials (Based on Availability)
- 16.2.7 Getinge AB
- 16.2.7.1. Overview
- 16.2.7.2. Products
- 16.2.7.3. SWOT Analysis
- 16.2.7.4. Recent Developments
- 16.2.7.5. Financials (Based on Availability)
- 16.2.8 Euronda
- 16.2.8.1. Overview
- 16.2.8.2. Products
- 16.2.8.3. SWOT Analysis
- 16.2.8.4. Recent Developments
- 16.2.8.5. Financials (Based on Availability)
- 16.2.9 Midmark Corp
- 16.2.9.1. Overview
- 16.2.9.2. Products
- 16.2.9.3. SWOT Analysis
- 16.2.9.4. Recent Developments
- 16.2.9.5. Financials (Based on Availability)
- 16.2.10 Mocom
- 16.2.10.1. Overview
- 16.2.10.2. Products
- 16.2.10.3. SWOT Analysis
- 16.2.10.4. Recent Developments
- 16.2.10.5. Financials (Based on Availability)
- 16.2.1 MELAG Medizintechnik GmbH & Co KG
List of Figures
- Figure 1: Global Autoclave Dental Industry Revenue Breakdown (Million, %) by Region 2024 & 2032
- Figure 2: Global Autoclave Dental Industry Volume Breakdown (K Unit, %) by Region 2024 & 2032
- Figure 3: North America Autoclave Dental Industry Revenue (Million), by Country 2024 & 2032
- Figure 4: North America Autoclave Dental Industry Volume (K Unit), by Country 2024 & 2032
- Figure 5: North America Autoclave Dental Industry Revenue Share (%), by Country 2024 & 2032
- Figure 6: North America Autoclave Dental Industry Volume Share (%), by Country 2024 & 2032
- Figure 7: Europe Autoclave Dental Industry Revenue (Million), by Country 2024 & 2032
- Figure 8: Europe Autoclave Dental Industry Volume (K Unit), by Country 2024 & 2032
- Figure 9: Europe Autoclave Dental Industry Revenue Share (%), by Country 2024 & 2032
- Figure 10: Europe Autoclave Dental Industry Volume Share (%), by Country 2024 & 2032
- Figure 11: Asia Pacific Autoclave Dental Industry Revenue (Million), by Country 2024 & 2032
- Figure 12: Asia Pacific Autoclave Dental Industry Volume (K Unit), by Country 2024 & 2032
- Figure 13: Asia Pacific Autoclave Dental Industry Revenue Share (%), by Country 2024 & 2032
- Figure 14: Asia Pacific Autoclave Dental Industry Volume Share (%), by Country 2024 & 2032
- Figure 15: South America Autoclave Dental Industry Revenue (Million), by Country 2024 & 2032
- Figure 16: South America Autoclave Dental Industry Volume (K Unit), by Country 2024 & 2032
- Figure 17: South America Autoclave Dental Industry Revenue Share (%), by Country 2024 & 2032
- Figure 18: South America Autoclave Dental Industry Volume Share (%), by Country 2024 & 2032
- Figure 19: North America Autoclave Dental Industry Revenue (Million), by Country 2024 & 2032
- Figure 20: North America Autoclave Dental Industry Volume (K Unit), by Country 2024 & 2032
- Figure 21: North America Autoclave Dental Industry Revenue Share (%), by Country 2024 & 2032
- Figure 22: North America Autoclave Dental Industry Volume Share (%), by Country 2024 & 2032
- Figure 23: MEA Autoclave Dental Industry Revenue (Million), by Country 2024 & 2032
- Figure 24: MEA Autoclave Dental Industry Volume (K Unit), by Country 2024 & 2032
- Figure 25: MEA Autoclave Dental Industry Revenue Share (%), by Country 2024 & 2032
- Figure 26: MEA Autoclave Dental Industry Volume Share (%), by Country 2024 & 2032
- Figure 27: North America Autoclave Dental Industry Revenue (Million), by Product Type 2024 & 2032
- Figure 28: North America Autoclave Dental Industry Volume (K Unit), by Product Type 2024 & 2032
- Figure 29: North America Autoclave Dental Industry Revenue Share (%), by Product Type 2024 & 2032
- Figure 30: North America Autoclave Dental Industry Volume Share (%), by Product Type 2024 & 2032
- Figure 31: North America Autoclave Dental Industry Revenue (Million), by End Users 2024 & 2032
- Figure 32: North America Autoclave Dental Industry Volume (K Unit), by End Users 2024 & 2032
- Figure 33: North America Autoclave Dental Industry Revenue Share (%), by End Users 2024 & 2032
- Figure 34: North America Autoclave Dental Industry Volume Share (%), by End Users 2024 & 2032
- Figure 35: North America Autoclave Dental Industry Revenue (Million), by Country 2024 & 2032
- Figure 36: North America Autoclave Dental Industry Volume (K Unit), by Country 2024 & 2032
- Figure 37: North America Autoclave Dental Industry Revenue Share (%), by Country 2024 & 2032
- Figure 38: North America Autoclave Dental Industry Volume Share (%), by Country 2024 & 2032
- Figure 39: Europe Autoclave Dental Industry Revenue (Million), by Product Type 2024 & 2032
- Figure 40: Europe Autoclave Dental Industry Volume (K Unit), by Product Type 2024 & 2032
- Figure 41: Europe Autoclave Dental Industry Revenue Share (%), by Product Type 2024 & 2032
- Figure 42: Europe Autoclave Dental Industry Volume Share (%), by Product Type 2024 & 2032
- Figure 43: Europe Autoclave Dental Industry Revenue (Million), by End Users 2024 & 2032
- Figure 44: Europe Autoclave Dental Industry Volume (K Unit), by End Users 2024 & 2032
- Figure 45: Europe Autoclave Dental Industry Revenue Share (%), by End Users 2024 & 2032
- Figure 46: Europe Autoclave Dental Industry Volume Share (%), by End Users 2024 & 2032
- Figure 47: Europe Autoclave Dental Industry Revenue (Million), by Country 2024 & 2032
- Figure 48: Europe Autoclave Dental Industry Volume (K Unit), by Country 2024 & 2032
- Figure 49: Europe Autoclave Dental Industry Revenue Share (%), by Country 2024 & 2032
- Figure 50: Europe Autoclave Dental Industry Volume Share (%), by Country 2024 & 2032
- Figure 51: Asia Pacific Autoclave Dental Industry Revenue (Million), by Product Type 2024 & 2032
- Figure 52: Asia Pacific Autoclave Dental Industry Volume (K Unit), by Product Type 2024 & 2032
- Figure 53: Asia Pacific Autoclave Dental Industry Revenue Share (%), by Product Type 2024 & 2032
- Figure 54: Asia Pacific Autoclave Dental Industry Volume Share (%), by Product Type 2024 & 2032
- Figure 55: Asia Pacific Autoclave Dental Industry Revenue (Million), by End Users 2024 & 2032
- Figure 56: Asia Pacific Autoclave Dental Industry Volume (K Unit), by End Users 2024 & 2032
- Figure 57: Asia Pacific Autoclave Dental Industry Revenue Share (%), by End Users 2024 & 2032
- Figure 58: Asia Pacific Autoclave Dental Industry Volume Share (%), by End Users 2024 & 2032
- Figure 59: Asia Pacific Autoclave Dental Industry Revenue (Million), by Country 2024 & 2032
- Figure 60: Asia Pacific Autoclave Dental Industry Volume (K Unit), by Country 2024 & 2032
- Figure 61: Asia Pacific Autoclave Dental Industry Revenue Share (%), by Country 2024 & 2032
- Figure 62: Asia Pacific Autoclave Dental Industry Volume Share (%), by Country 2024 & 2032
- Figure 63: Rest of the World Autoclave Dental Industry Revenue (Million), by Product Type 2024 & 2032
- Figure 64: Rest of the World Autoclave Dental Industry Volume (K Unit), by Product Type 2024 & 2032
- Figure 65: Rest of the World Autoclave Dental Industry Revenue Share (%), by Product Type 2024 & 2032
- Figure 66: Rest of the World Autoclave Dental Industry Volume Share (%), by Product Type 2024 & 2032
- Figure 67: Rest of the World Autoclave Dental Industry Revenue (Million), by End Users 2024 & 2032
- Figure 68: Rest of the World Autoclave Dental Industry Volume (K Unit), by End Users 2024 & 2032
- Figure 69: Rest of the World Autoclave Dental Industry Revenue Share (%), by End Users 2024 & 2032
- Figure 70: Rest of the World Autoclave Dental Industry Volume Share (%), by End Users 2024 & 2032
- Figure 71: Rest of the World Autoclave Dental Industry Revenue (Million), by Country 2024 & 2032
- Figure 72: Rest of the World Autoclave Dental Industry Volume (K Unit), by Country 2024 & 2032
- Figure 73: Rest of the World Autoclave Dental Industry Revenue Share (%), by Country 2024 & 2032
- Figure 74: Rest of the World Autoclave Dental Industry Volume Share (%), by Country 2024 & 2032
List of Tables
- Table 1: Global Autoclave Dental Industry Revenue Million Forecast, by Region 2019 & 2032
- Table 2: Global Autoclave Dental Industry Volume K Unit Forecast, by Region 2019 & 2032
- Table 3: Global Autoclave Dental Industry Revenue Million Forecast, by Product Type 2019 & 2032
- Table 4: Global Autoclave Dental Industry Volume K Unit Forecast, by Product Type 2019 & 2032
- Table 5: Global Autoclave Dental Industry Revenue Million Forecast, by End Users 2019 & 2032
- Table 6: Global Autoclave Dental Industry Volume K Unit Forecast, by End Users 2019 & 2032
- Table 7: Global Autoclave Dental Industry Revenue Million Forecast, by Region 2019 & 2032
- Table 8: Global Autoclave Dental Industry Volume K Unit Forecast, by Region 2019 & 2032
- Table 9: Global Autoclave Dental Industry Revenue Million Forecast, by Country 2019 & 2032
- Table 10: Global Autoclave Dental Industry Volume K Unit Forecast, by Country 2019 & 2032
- Table 11: United States Autoclave Dental Industry Revenue (Million) Forecast, by Application 2019 & 2032
- Table 12: United States Autoclave Dental Industry Volume (K Unit) Forecast, by Application 2019 & 2032
- Table 13: Canada Autoclave Dental Industry Revenue (Million) Forecast, by Application 2019 & 2032
- Table 14: Canada Autoclave Dental Industry Volume (K Unit) Forecast, by Application 2019 & 2032
- Table 15: Mexico Autoclave Dental Industry Revenue (Million) Forecast, by Application 2019 & 2032
- Table 16: Mexico Autoclave Dental Industry Volume (K Unit) Forecast, by Application 2019 & 2032
- Table 17: Global Autoclave Dental Industry Revenue Million Forecast, by Country 2019 & 2032
- Table 18: Global Autoclave Dental Industry Volume K Unit Forecast, by Country 2019 & 2032
- Table 19: Germany Autoclave Dental Industry Revenue (Million) Forecast, by Application 2019 & 2032
- Table 20: Germany Autoclave Dental Industry Volume (K Unit) Forecast, by Application 2019 & 2032
- Table 21: United Kingdom Autoclave Dental Industry Revenue (Million) Forecast, by Application 2019 & 2032
- Table 22: United Kingdom Autoclave Dental Industry Volume (K Unit) Forecast, by Application 2019 & 2032
- Table 23: France Autoclave Dental Industry Revenue (Million) Forecast, by Application 2019 & 2032
- Table 24: France Autoclave Dental Industry Volume (K Unit) Forecast, by Application 2019 & 2032
- Table 25: Spain Autoclave Dental Industry Revenue (Million) Forecast, by Application 2019 & 2032
- Table 26: Spain Autoclave Dental Industry Volume (K Unit) Forecast, by Application 2019 & 2032
- Table 27: Italy Autoclave Dental Industry Revenue (Million) Forecast, by Application 2019 & 2032
- Table 28: Italy Autoclave Dental Industry Volume (K Unit) Forecast, by Application 2019 & 2032
- Table 29: Spain Autoclave Dental Industry Revenue (Million) Forecast, by Application 2019 & 2032
- Table 30: Spain Autoclave Dental Industry Volume (K Unit) Forecast, by Application 2019 & 2032
- Table 31: Belgium Autoclave Dental Industry Revenue (Million) Forecast, by Application 2019 & 2032
- Table 32: Belgium Autoclave Dental Industry Volume (K Unit) Forecast, by Application 2019 & 2032
- Table 33: Netherland Autoclave Dental Industry Revenue (Million) Forecast, by Application 2019 & 2032
- Table 34: Netherland Autoclave Dental Industry Volume (K Unit) Forecast, by Application 2019 & 2032
- Table 35: Nordics Autoclave Dental Industry Revenue (Million) Forecast, by Application 2019 & 2032
- Table 36: Nordics Autoclave Dental Industry Volume (K Unit) Forecast, by Application 2019 & 2032
- Table 37: Rest of Europe Autoclave Dental Industry Revenue (Million) Forecast, by Application 2019 & 2032
- Table 38: Rest of Europe Autoclave Dental Industry Volume (K Unit) Forecast, by Application 2019 & 2032
- Table 39: Global Autoclave Dental Industry Revenue Million Forecast, by Country 2019 & 2032
- Table 40: Global Autoclave Dental Industry Volume K Unit Forecast, by Country 2019 & 2032
- Table 41: China Autoclave Dental Industry Revenue (Million) Forecast, by Application 2019 & 2032
- Table 42: China Autoclave Dental Industry Volume (K Unit) Forecast, by Application 2019 & 2032
- Table 43: Japan Autoclave Dental Industry Revenue (Million) Forecast, by Application 2019 & 2032
- Table 44: Japan Autoclave Dental Industry Volume (K Unit) Forecast, by Application 2019 & 2032
- Table 45: India Autoclave Dental Industry Revenue (Million) Forecast, by Application 2019 & 2032
- Table 46: India Autoclave Dental Industry Volume (K Unit) Forecast, by Application 2019 & 2032
- Table 47: South Korea Autoclave Dental Industry Revenue (Million) Forecast, by Application 2019 & 2032
- Table 48: South Korea Autoclave Dental Industry Volume (K Unit) Forecast, by Application 2019 & 2032
- Table 49: Southeast Asia Autoclave Dental Industry Revenue (Million) Forecast, by Application 2019 & 2032
- Table 50: Southeast Asia Autoclave Dental Industry Volume (K Unit) Forecast, by Application 2019 & 2032
- Table 51: Australia Autoclave Dental Industry Revenue (Million) Forecast, by Application 2019 & 2032
- Table 52: Australia Autoclave Dental Industry Volume (K Unit) Forecast, by Application 2019 & 2032
- Table 53: Indonesia Autoclave Dental Industry Revenue (Million) Forecast, by Application 2019 & 2032
- Table 54: Indonesia Autoclave Dental Industry Volume (K Unit) Forecast, by Application 2019 & 2032
- Table 55: Phillipes Autoclave Dental Industry Revenue (Million) Forecast, by Application 2019 & 2032
- Table 56: Phillipes Autoclave Dental Industry Volume (K Unit) Forecast, by Application 2019 & 2032
- Table 57: Singapore Autoclave Dental Industry Revenue (Million) Forecast, by Application 2019 & 2032
- Table 58: Singapore Autoclave Dental Industry Volume (K Unit) Forecast, by Application 2019 & 2032
- Table 59: Thailandc Autoclave Dental Industry Revenue (Million) Forecast, by Application 2019 & 2032
- Table 60: Thailandc Autoclave Dental Industry Volume (K Unit) Forecast, by Application 2019 & 2032
- Table 61: Rest of Asia Pacific Autoclave Dental Industry Revenue (Million) Forecast, by Application 2019 & 2032
- Table 62: Rest of Asia Pacific Autoclave Dental Industry Volume (K Unit) Forecast, by Application 2019 & 2032
- Table 63: Global Autoclave Dental Industry Revenue Million Forecast, by Country 2019 & 2032
- Table 64: Global Autoclave Dental Industry Volume K Unit Forecast, by Country 2019 & 2032
- Table 65: Brazil Autoclave Dental Industry Revenue (Million) Forecast, by Application 2019 & 2032
- Table 66: Brazil Autoclave Dental Industry Volume (K Unit) Forecast, by Application 2019 & 2032
- Table 67: Argentina Autoclave Dental Industry Revenue (Million) Forecast, by Application 2019 & 2032
- Table 68: Argentina Autoclave Dental Industry Volume (K Unit) Forecast, by Application 2019 & 2032
- Table 69: Peru Autoclave Dental Industry Revenue (Million) Forecast, by Application 2019 & 2032
- Table 70: Peru Autoclave Dental Industry Volume (K Unit) Forecast, by Application 2019 & 2032
- Table 71: Chile Autoclave Dental Industry Revenue (Million) Forecast, by Application 2019 & 2032
- Table 72: Chile Autoclave Dental Industry Volume (K Unit) Forecast, by Application 2019 & 2032
- Table 73: Colombia Autoclave Dental Industry Revenue (Million) Forecast, by Application 2019 & 2032
- Table 74: Colombia Autoclave Dental Industry Volume (K Unit) Forecast, by Application 2019 & 2032
- Table 75: Ecuador Autoclave Dental Industry Revenue (Million) Forecast, by Application 2019 & 2032
- Table 76: Ecuador Autoclave Dental Industry Volume (K Unit) Forecast, by Application 2019 & 2032
- Table 77: Venezuela Autoclave Dental Industry Revenue (Million) Forecast, by Application 2019 & 2032
- Table 78: Venezuela Autoclave Dental Industry Volume (K Unit) Forecast, by Application 2019 & 2032
- Table 79: Rest of South America Autoclave Dental Industry Revenue (Million) Forecast, by Application 2019 & 2032
- Table 80: Rest of South America Autoclave Dental Industry Volume (K Unit) Forecast, by Application 2019 & 2032
- Table 81: Global Autoclave Dental Industry Revenue Million Forecast, by Country 2019 & 2032
- Table 82: Global Autoclave Dental Industry Volume K Unit Forecast, by Country 2019 & 2032
- Table 83: United States Autoclave Dental Industry Revenue (Million) Forecast, by Application 2019 & 2032
- Table 84: United States Autoclave Dental Industry Volume (K Unit) Forecast, by Application 2019 & 2032
- Table 85: Canada Autoclave Dental Industry Revenue (Million) Forecast, by Application 2019 & 2032
- Table 86: Canada Autoclave Dental Industry Volume (K Unit) Forecast, by Application 2019 & 2032
- Table 87: Mexico Autoclave Dental Industry Revenue (Million) Forecast, by Application 2019 & 2032
- Table 88: Mexico Autoclave Dental Industry Volume (K Unit) Forecast, by Application 2019 & 2032
- Table 89: Global Autoclave Dental Industry Revenue Million Forecast, by Country 2019 & 2032
- Table 90: Global Autoclave Dental Industry Volume K Unit Forecast, by Country 2019 & 2032
- Table 91: United Arab Emirates Autoclave Dental Industry Revenue (Million) Forecast, by Application 2019 & 2032
- Table 92: United Arab Emirates Autoclave Dental Industry Volume (K Unit) Forecast, by Application 2019 & 2032
- Table 93: Saudi Arabia Autoclave Dental Industry Revenue (Million) Forecast, by Application 2019 & 2032
- Table 94: Saudi Arabia Autoclave Dental Industry Volume (K Unit) Forecast, by Application 2019 & 2032
- Table 95: South Africa Autoclave Dental Industry Revenue (Million) Forecast, by Application 2019 & 2032
- Table 96: South Africa Autoclave Dental Industry Volume (K Unit) Forecast, by Application 2019 & 2032
- Table 97: Rest of Middle East and Africa Autoclave Dental Industry Revenue (Million) Forecast, by Application 2019 & 2032
- Table 98: Rest of Middle East and Africa Autoclave Dental Industry Volume (K Unit) Forecast, by Application 2019 & 2032
- Table 99: Global Autoclave Dental Industry Revenue Million Forecast, by Product Type 2019 & 2032
- Table 100: Global Autoclave Dental Industry Volume K Unit Forecast, by Product Type 2019 & 2032
- Table 101: Global Autoclave Dental Industry Revenue Million Forecast, by End Users 2019 & 2032
- Table 102: Global Autoclave Dental Industry Volume K Unit Forecast, by End Users 2019 & 2032
- Table 103: Global Autoclave Dental Industry Revenue Million Forecast, by Country 2019 & 2032
- Table 104: Global Autoclave Dental Industry Volume K Unit Forecast, by Country 2019 & 2032
- Table 105: US Autoclave Dental Industry Revenue (Million) Forecast, by Application 2019 & 2032
- Table 106: US Autoclave Dental Industry Volume (K Unit) Forecast, by Application 2019 & 2032
- Table 107: Canada Autoclave Dental Industry Revenue (Million) Forecast, by Application 2019 & 2032
- Table 108: Canada Autoclave Dental Industry Volume (K Unit) Forecast, by Application 2019 & 2032
- Table 109: Mexico Autoclave Dental Industry Revenue (Million) Forecast, by Application 2019 & 2032
- Table 110: Mexico Autoclave Dental Industry Volume (K Unit) Forecast, by Application 2019 & 2032
- Table 111: Global Autoclave Dental Industry Revenue Million Forecast, by Product Type 2019 & 2032
- Table 112: Global Autoclave Dental Industry Volume K Unit Forecast, by Product Type 2019 & 2032
- Table 113: Global Autoclave Dental Industry Revenue Million Forecast, by End Users 2019 & 2032
- Table 114: Global Autoclave Dental Industry Volume K Unit Forecast, by End Users 2019 & 2032
- Table 115: Global Autoclave Dental Industry Revenue Million Forecast, by Country 2019 & 2032
- Table 116: Global Autoclave Dental Industry Volume K Unit Forecast, by Country 2019 & 2032
- Table 117: Germany Autoclave Dental Industry Revenue (Million) Forecast, by Application 2019 & 2032
- Table 118: Germany Autoclave Dental Industry Volume (K Unit) Forecast, by Application 2019 & 2032
- Table 119: UK Autoclave Dental Industry Revenue (Million) Forecast, by Application 2019 & 2032
- Table 120: UK Autoclave Dental Industry Volume (K Unit) Forecast, by Application 2019 & 2032
- Table 121: France Autoclave Dental Industry Revenue (Million) Forecast, by Application 2019 & 2032
- Table 122: France Autoclave Dental Industry Volume (K Unit) Forecast, by Application 2019 & 2032
- Table 123: Italy Autoclave Dental Industry Revenue (Million) Forecast, by Application 2019 & 2032
- Table 124: Italy Autoclave Dental Industry Volume (K Unit) Forecast, by Application 2019 & 2032
- Table 125: Spain Autoclave Dental Industry Revenue (Million) Forecast, by Application 2019 & 2032
- Table 126: Spain Autoclave Dental Industry Volume (K Unit) Forecast, by Application 2019 & 2032
- Table 127: Rest of Europe Autoclave Dental Industry Revenue (Million) Forecast, by Application 2019 & 2032
- Table 128: Rest of Europe Autoclave Dental Industry Volume (K Unit) Forecast, by Application 2019 & 2032
- Table 129: Global Autoclave Dental Industry Revenue Million Forecast, by Product Type 2019 & 2032
- Table 130: Global Autoclave Dental Industry Volume K Unit Forecast, by Product Type 2019 & 2032
- Table 131: Global Autoclave Dental Industry Revenue Million Forecast, by End Users 2019 & 2032
- Table 132: Global Autoclave Dental Industry Volume K Unit Forecast, by End Users 2019 & 2032
- Table 133: Global Autoclave Dental Industry Revenue Million Forecast, by Country 2019 & 2032
- Table 134: Global Autoclave Dental Industry Volume K Unit Forecast, by Country 2019 & 2032
- Table 135: China Autoclave Dental Industry Revenue (Million) Forecast, by Application 2019 & 2032
- Table 136: China Autoclave Dental Industry Volume (K Unit) Forecast, by Application 2019 & 2032
- Table 137: Japan Autoclave Dental Industry Revenue (Million) Forecast, by Application 2019 & 2032
- Table 138: Japan Autoclave Dental Industry Volume (K Unit) Forecast, by Application 2019 & 2032
- Table 139: India Autoclave Dental Industry Revenue (Million) Forecast, by Application 2019 & 2032
- Table 140: India Autoclave Dental Industry Volume (K Unit) Forecast, by Application 2019 & 2032
- Table 141: Australia Autoclave Dental Industry Revenue (Million) Forecast, by Application 2019 & 2032
- Table 142: Australia Autoclave Dental Industry Volume (K Unit) Forecast, by Application 2019 & 2032
- Table 143: South Korea Autoclave Dental Industry Revenue (Million) Forecast, by Application 2019 & 2032
- Table 144: South Korea Autoclave Dental Industry Volume (K Unit) Forecast, by Application 2019 & 2032
- Table 145: Rest of Asia Pacific Autoclave Dental Industry Revenue (Million) Forecast, by Application 2019 & 2032
- Table 146: Rest of Asia Pacific Autoclave Dental Industry Volume (K Unit) Forecast, by Application 2019 & 2032
- Table 147: Global Autoclave Dental Industry Revenue Million Forecast, by Product Type 2019 & 2032
- Table 148: Global Autoclave Dental Industry Volume K Unit Forecast, by Product Type 2019 & 2032
- Table 149: Global Autoclave Dental Industry Revenue Million Forecast, by End Users 2019 & 2032
- Table 150: Global Autoclave Dental Industry Volume K Unit Forecast, by End Users 2019 & 2032
- Table 151: Global Autoclave Dental Industry Revenue Million Forecast, by Country 2019 & 2032
- Table 152: Global Autoclave Dental Industry Volume K Unit Forecast, by Country 2019 & 2032
Frequently Asked Questions
1. What is the projected Compound Annual Growth Rate (CAGR) of the Autoclave Dental Industry?
The projected CAGR is approximately 3.00%.
2. Which companies are prominent players in the Autoclave Dental Industry?
Key companies in the market include MELAG Medizintechnik GmbH & Co KG, Shinva Medical Instrument Co Ltd, Tuttnauer, W&H Dentalwerk, Coltene Holding, Dentsply Sirona, Getinge AB, Euronda, Midmark Corp, Mocom.
3. What are the main segments of the Autoclave Dental Industry?
The market segments include Product Type, End Users.
4. Can you provide details about the market size?
The market size is estimated to be USD 313.39 Million as of 2022.
5. What are some drivers contributing to market growth?
Increasing Incidences of Dental Disorders and Dental Cosmetic Surgeries; Rising Patient Awareness Levels Pertaining to Sterilization; Government Initiatives toward Hygiene Policy and Sanitization.
6. What are the notable trends driving market growth?
Automatic Dental Autoclave Segment Expected to Account for a Major Market Share During the Forecast Period.
7. Are there any restraints impacting market growth?
Lack of Awareness about Dental Hygiene in Developing Countries; High Cost of Dental Autoclave.
8. Can you provide examples of recent developments in the market?
N/A
9. What pricing options are available for accessing the report?
Pricing options include single-user, multi-user, and enterprise licenses priced at USD 4750, USD 5250, and USD 8750 respectively.
10. Is the market size provided in terms of value or volume?
The market size is provided in terms of value, measured in Million and volume, measured in K Unit.
11. Are there any specific market keywords associated with the report?
Yes, the market keyword associated with the report is "Autoclave Dental Industry," which aids in identifying and referencing the specific market segment covered.
12. How do I determine which pricing option suits my needs best?
The pricing options vary based on user requirements and access needs. Individual users may opt for single-user licenses, while businesses requiring broader access may choose multi-user or enterprise licenses for cost-effective access to the report.
13. Are there any additional resources or data provided in the Autoclave Dental Industry report?
While the report offers comprehensive insights, it's advisable to review the specific contents or supplementary materials provided to ascertain if additional resources or data are available.
14. How can I stay updated on further developments or reports in the Autoclave Dental Industry?
To stay informed about further developments, trends, and reports in the Autoclave Dental Industry, consider subscribing to industry newsletters, following relevant companies and organizations, or regularly checking reputable industry news sources and publications.
Methodology
Step 1 - Identification of Relevant Samples Size from Population Database


Step 2 - Approaches for Defining Global Market Size (Value, Volume* & Price*)

Note*: In applicable scenarios
Step 3 - Data Sources
Primary Research
- Web Analytics
- Survey Reports
- Research Institute
- Latest Research Reports
- Opinion Leaders
Secondary Research
- Annual Reports
- White Paper
- Latest Press Release
- Industry Association
- Paid Database
- Investor Presentations

Step 4 - Data Triangulation
Involves using different sources of information in order to increase the validity of a study
These sources are likely to be stakeholders in a program - participants, other researchers, program staff, other community members, and so on.
Then we put all data in single framework & apply various statistical tools to find out the dynamic on the market.
During the analysis stage, feedback from the stakeholder groups would be compared to determine areas of agreement as well as areas of divergence


