

Key Insights
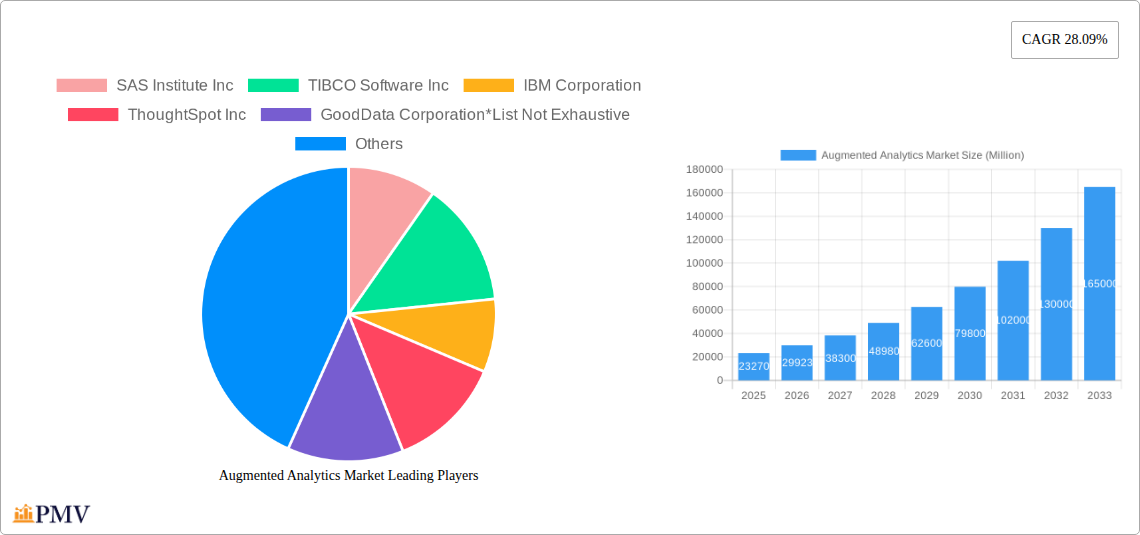
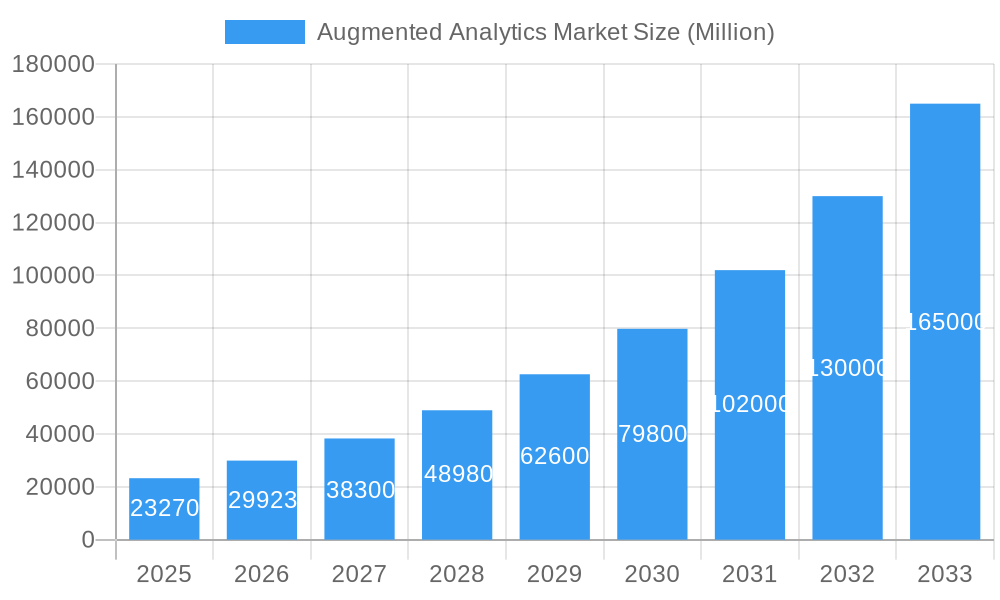
The Augmented Analytics market is experiencing robust growth, projected to reach $23.27 billion in 2025 and exhibiting a Compound Annual Growth Rate (CAGR) of 28.09% from 2025 to 2033. This expansion is fueled by several key drivers. The increasing volume and complexity of data generated across various industries necessitate efficient and insightful data analysis, a capability augmented analytics excels at delivering. Businesses are increasingly adopting cloud-based solutions, contributing to the market's growth, particularly in sectors like BFSI (Banking, Financial Services, and Insurance), Telecom & IT, and Retail, where the need for real-time insights and predictive modeling is paramount. Furthermore, advancements in artificial intelligence (AI) and machine learning (ML) are continuously enhancing the capabilities of augmented analytics platforms, making them more accessible and user-friendly. The shift towards self-service analytics, empowering business users to derive insights without extensive technical expertise, further accelerates market adoption. Competitive pressures are also driving organizations to adopt augmented analytics for improved decision-making and operational efficiency.
Augmented Analytics Market Market Size (In Billion)
While the market exhibits significant promise, challenges remain. The high initial investment costs associated with implementing augmented analytics solutions can be a deterrent for smaller businesses. Data security and privacy concerns, especially with cloud-based deployments, need to be addressed effectively to ensure widespread adoption. Furthermore, the lack of skilled professionals capable of effectively utilizing and managing these sophisticated platforms can hinder growth in certain regions. However, ongoing technological advancements, coupled with the increasing availability of training and support resources, are expected to mitigate these challenges in the coming years. The market segmentation by deployment (on-premise vs. cloud) and end-user industry highlights the varied applications and growth potential across diverse sectors, with North America expected to maintain a significant market share due to early adoption and technological advancements. Key players like SAS Institute, TIBCO, IBM, and others are continuously innovating and expanding their product offerings to capitalize on this burgeoning market.
Augmented Analytics Market Company Market Share
Augmented Analytics Market: A Comprehensive Report (2019-2033)
This detailed report provides a comprehensive analysis of the Augmented Analytics market, offering invaluable insights for businesses, investors, and industry professionals. With a study period spanning 2019-2033, a base year of 2025, and a forecast period of 2025-2033, this report presents a robust overview of market trends, competitive dynamics, and future growth potential. The market is projected to reach xx Million by 2033, exhibiting a CAGR of xx% during the forecast period.
Augmented Analytics Market Structure & Competitive Dynamics
The Augmented Analytics market exhibits a moderately concentrated structure, with key players such as SAS Institute Inc, TIBCO Software Inc, IBM Corporation, ThoughtSpot Inc, and GoodData Corporation holding significant market share. However, the presence of numerous smaller players and continuous innovation fosters a dynamic competitive landscape. The market is characterized by ongoing mergers and acquisitions (M&A) activity, with deal values ranging from xx Million to xx Million in recent years, reflecting the strategic importance of augmented analytics capabilities.
- Market Concentration: Moderately concentrated, with top 5 players holding approximately xx% of the market share in 2024.
- Innovation Ecosystems: Active, with significant investments in AI, machine learning, and data visualization technologies driving product development.
- Regulatory Frameworks: Varying across regions, impacting data privacy and security regulations.
- Product Substitutes: Traditional business intelligence (BI) tools, though augmented analytics offers superior capabilities.
- End-User Trends: Increasing adoption across various industries, driven by demand for data-driven decision-making and automation.
- M&A Activities: Frequent, with strategic acquisitions aimed at expanding product portfolios and market reach.
Augmented Analytics Market Industry Trends & Insights
The Augmented Analytics market is experiencing robust growth, propelled by several key factors. The increasing volume and complexity of data, coupled with the need for faster, more insightful decision-making, are driving the adoption of augmented analytics solutions. Technological advancements in AI and machine learning are further fueling market expansion, enabling more accurate predictions and automated insights. Consumer preferences are shifting towards user-friendly, self-service analytics platforms that empower business users without requiring extensive technical expertise. The competitive landscape is characterized by intense innovation and strategic partnerships, leading to continuous product improvements and market expansion. The market is expected to witness significant growth, driven by the rising demand for data-driven decision-making across diverse sectors. The global Augmented Analytics market size is projected to reach xx Million by 2033, representing a notable increase from xx Million in 2024. This growth reflects a Compound Annual Growth Rate (CAGR) of xx% throughout the forecast period. Market penetration is anticipated to rise significantly, particularly in industries with large data volumes and complex analytical needs.
Dominant Markets & Segments in Augmented Analytics Market
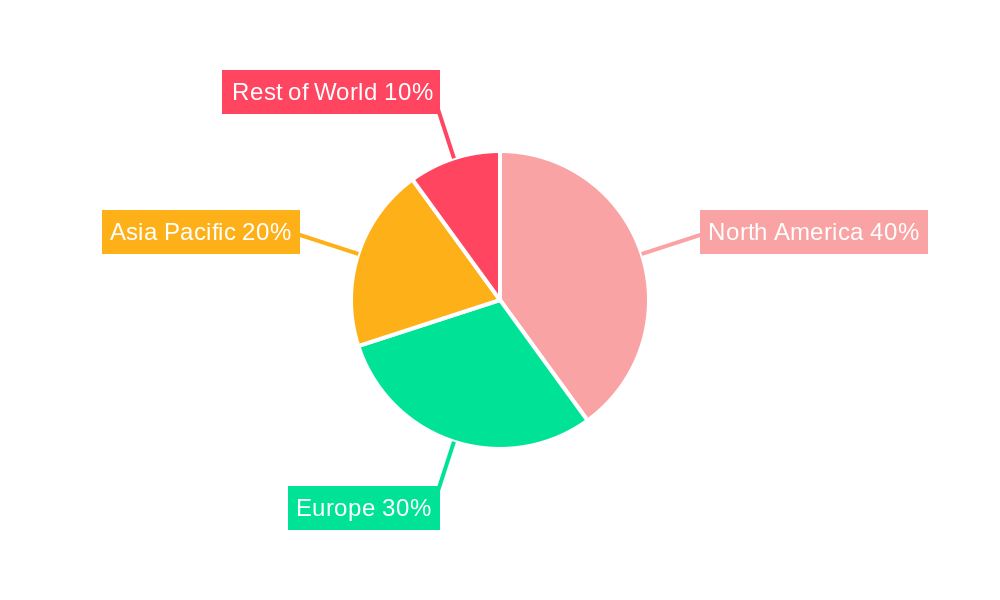
The cloud deployment segment currently dominates the Augmented Analytics market, driven by its scalability, accessibility, and cost-effectiveness. Within end-user industries, the BFSI (Banking, Financial Services, and Insurance) sector exhibits the highest adoption rate, due to its reliance on sophisticated data analysis for risk management, fraud detection, and customer insights. The North American region holds the largest market share, fueled by a robust technological infrastructure and high levels of digital adoption.
Key Drivers for Cloud Deployment:
- Cost-effectiveness
- Scalability and flexibility
- Accessibility and remote access
- Ease of implementation and maintenance
Key Drivers for BFSI Sector Dominance:
- Stringent regulatory compliance needs
- Critical reliance on risk management and fraud detection
- Demand for personalized customer experiences
- Need for advanced data analytics for investment strategies
Key Drivers for North American Market Leadership:
- Strong technological infrastructure
- High levels of digital adoption and technological innovation
- Availability of skilled workforce
- High spending on technology and analytics solutions
Augmented Analytics Market Product Innovations
Recent product innovations in the augmented analytics space focus on enhancing AI capabilities, improving user experience, and expanding integration capabilities with other enterprise systems. New features include advanced natural language processing (NLP) for more intuitive data interaction, automated data preparation and cleaning, and more sophisticated predictive modeling techniques. These innovations cater to growing market needs for simpler, faster, and more accessible data analysis, further driving market growth.
Report Segmentation & Scope
This report segments the Augmented Analytics market based on deployment (on-premise and cloud) and end-user industry (BFSI, Telecom & IT, Retail, Healthcare, Manufacturing, Media & Entertainment, and Other End-user Industries). Each segment is analyzed based on market size, growth projections, and competitive dynamics. The cloud deployment segment is expected to experience the fastest growth, driven by its scalability and accessibility. Within end-user industries, the BFSI sector is projected to remain the dominant segment, driven by high data volumes and the need for sophisticated analytics capabilities.
Key Drivers of Augmented Analytics Market Growth
Several factors are driving the growth of the Augmented Analytics market. These include the increasing availability of large datasets, advances in AI and machine learning, the need for faster decision-making, and the rising adoption of cloud computing. Furthermore, government initiatives promoting data-driven decision-making and digital transformation are also contributing to market growth. The growing demand for improved operational efficiency and competitive advantage across various industries is a major catalyst for augmented analytics adoption.
Challenges in the Augmented Analytics Market Sector
Despite its strong growth potential, the Augmented Analytics market faces some challenges. These include the need for skilled data scientists and analysts, the complexity of integrating augmented analytics solutions with existing systems, and concerns about data security and privacy. Furthermore, the high cost of implementation and the potential for vendor lock-in can hinder adoption. These factors represent obstacles to be overcome to fully realize the market's potential.
Leading Players in the Augmented Analytics Market Market
- SAS Institute Inc
- TIBCO Software Inc
- IBM Corporation
- ThoughtSpot Inc
- GoodData Corporation
- Microsoft Corporation
- QlikTech International AB
- Sisense Inc
- SAP SE
- MicroStrategy Inc
- Salesforce com inc
Key Developments in Augmented Analytics Market Sector
- May 2023: TrinityLife Sciences and WhizAI announced a strategic partnership to integrate AI-powered augmented analytics into life sciences commercialization solutions. This collaboration enhances insights for stakeholders and accelerates market adoption within the healthcare sector.
- January 2023: Seerist Inc. introduced new capabilities to its augmented analytics solution for threat and security professionals, improving contextual intelligence and customization options. This development strengthens the platform's value proposition and expands its market reach.
Strategic Augmented Analytics Market Outlook
The Augmented Analytics market is poised for significant growth, driven by ongoing technological advancements, expanding data volumes, and the increasing demand for data-driven decision-making across various sectors. Strategic opportunities exist for companies to develop innovative solutions that address specific industry needs, enhance user experience, and improve data security. The market's future success depends on continuous innovation and addressing challenges related to data integration, skilled workforce availability, and regulatory compliance.
Augmented Analytics Market Segmentation
-
1. Deployment
- 1.1. On-premise
- 1.2. Cloud
-
2. End-user Industry
- 2.1. BFSI
- 2.2. Telecom & IT
- 2.3. Retail
- 2.4. Healthcare
- 2.5. Manufacturing
- 2.6. Media & Entertainment
- 2.7. Other End-user Industries
Augmented Analytics Market Segmentation By Geography
- 1. North America
- 2. Europe
- 3. Asia Pacific
- 4. Rest of the World
Augmented Analytics Market Regional Market Share
Geographic Coverage of Augmented Analytics Market
Augmented Analytics Market REPORT HIGHLIGHTS
| Aspects | Details |
|---|---|
| Study Period | 2020-2034 |
| Base Year | 2025 |
| Estimated Year | 2026 |
| Forecast Period | 2026-2034 |
| Historical Period | 2020-2025 |
| Growth Rate | CAGR of 28.09% from 2020-2034 |
| Segmentation |
|
Table of Contents
- 1. Introduction
- 1.1. Research Scope
- 1.2. Market Segmentation
- 1.3. Research Methodology
- 1.4. Definitions and Assumptions
- 2. Executive Summary
- 2.1. Introduction
- 3. Market Dynamics
- 3.1. Introduction
- 3.2. Market Drivers
- 3.2.1. Increasing Demand to Cater Complex Business Data; Huge Adoption of Business Intelligence Tools
- 3.3. Market Restrains
- 3.3.1. Resistance Due to Replacement of Human Intelligence
- 3.4. Market Trends
- 3.4.1. Retail Sector is Expected to Have a Significant Growth During the Forecast Period
- 4. Market Factor Analysis
- 4.1. Porters Five Forces
- 4.2. Supply/Value Chain
- 4.3. PESTEL analysis
- 4.4. Market Entropy
- 4.5. Patent/Trademark Analysis
- 5. Global Augmented Analytics Market Analysis, Insights and Forecast, 2020-2032
- 5.1. Market Analysis, Insights and Forecast - by Deployment
- 5.1.1. On-premise
- 5.1.2. Cloud
- 5.2. Market Analysis, Insights and Forecast - by End-user Industry
- 5.2.1. BFSI
- 5.2.2. Telecom & IT
- 5.2.3. Retail
- 5.2.4. Healthcare
- 5.2.5. Manufacturing
- 5.2.6. Media & Entertainment
- 5.2.7. Other End-user Industries
- 5.3. Market Analysis, Insights and Forecast - by Region
- 5.3.1. North America
- 5.3.2. Europe
- 5.3.3. Asia Pacific
- 5.3.4. Rest of the World
- 5.1. Market Analysis, Insights and Forecast - by Deployment
- 6. North America Augmented Analytics Market Analysis, Insights and Forecast, 2020-2032
- 6.1. Market Analysis, Insights and Forecast - by Deployment
- 6.1.1. On-premise
- 6.1.2. Cloud
- 6.2. Market Analysis, Insights and Forecast - by End-user Industry
- 6.2.1. BFSI
- 6.2.2. Telecom & IT
- 6.2.3. Retail
- 6.2.4. Healthcare
- 6.2.5. Manufacturing
- 6.2.6. Media & Entertainment
- 6.2.7. Other End-user Industries
- 6.1. Market Analysis, Insights and Forecast - by Deployment
- 7. Europe Augmented Analytics Market Analysis, Insights and Forecast, 2020-2032
- 7.1. Market Analysis, Insights and Forecast - by Deployment
- 7.1.1. On-premise
- 7.1.2. Cloud
- 7.2. Market Analysis, Insights and Forecast - by End-user Industry
- 7.2.1. BFSI
- 7.2.2. Telecom & IT
- 7.2.3. Retail
- 7.2.4. Healthcare
- 7.2.5. Manufacturing
- 7.2.6. Media & Entertainment
- 7.2.7. Other End-user Industries
- 7.1. Market Analysis, Insights and Forecast - by Deployment
- 8. Asia Pacific Augmented Analytics Market Analysis, Insights and Forecast, 2020-2032
- 8.1. Market Analysis, Insights and Forecast - by Deployment
- 8.1.1. On-premise
- 8.1.2. Cloud
- 8.2. Market Analysis, Insights and Forecast - by End-user Industry
- 8.2.1. BFSI
- 8.2.2. Telecom & IT
- 8.2.3. Retail
- 8.2.4. Healthcare
- 8.2.5. Manufacturing
- 8.2.6. Media & Entertainment
- 8.2.7. Other End-user Industries
- 8.1. Market Analysis, Insights and Forecast - by Deployment
- 9. Rest of the World Augmented Analytics Market Analysis, Insights and Forecast, 2020-2032
- 9.1. Market Analysis, Insights and Forecast - by Deployment
- 9.1.1. On-premise
- 9.1.2. Cloud
- 9.2. Market Analysis, Insights and Forecast - by End-user Industry
- 9.2.1. BFSI
- 9.2.2. Telecom & IT
- 9.2.3. Retail
- 9.2.4. Healthcare
- 9.2.5. Manufacturing
- 9.2.6. Media & Entertainment
- 9.2.7. Other End-user Industries
- 9.1. Market Analysis, Insights and Forecast - by Deployment
- 10. Competitive Analysis
- 10.1. Global Market Share Analysis 2025
- 10.2. Company Profiles
- 10.2.1 SAS Institute Inc
- 10.2.1.1. Overview
- 10.2.1.2. Products
- 10.2.1.3. SWOT Analysis
- 10.2.1.4. Recent Developments
- 10.2.1.5. Financials (Based on Availability)
- 10.2.2 TIBCO Software Inc
- 10.2.2.1. Overview
- 10.2.2.2. Products
- 10.2.2.3. SWOT Analysis
- 10.2.2.4. Recent Developments
- 10.2.2.5. Financials (Based on Availability)
- 10.2.3 IBM Corporation
- 10.2.3.1. Overview
- 10.2.3.2. Products
- 10.2.3.3. SWOT Analysis
- 10.2.3.4. Recent Developments
- 10.2.3.5. Financials (Based on Availability)
- 10.2.4 ThoughtSpot Inc
- 10.2.4.1. Overview
- 10.2.4.2. Products
- 10.2.4.3. SWOT Analysis
- 10.2.4.4. Recent Developments
- 10.2.4.5. Financials (Based on Availability)
- 10.2.5 GoodData Corporation*List Not Exhaustive
- 10.2.5.1. Overview
- 10.2.5.2. Products
- 10.2.5.3. SWOT Analysis
- 10.2.5.4. Recent Developments
- 10.2.5.5. Financials (Based on Availability)
- 10.2.6 Microsoft Corporation
- 10.2.6.1. Overview
- 10.2.6.2. Products
- 10.2.6.3. SWOT Analysis
- 10.2.6.4. Recent Developments
- 10.2.6.5. Financials (Based on Availability)
- 10.2.7 QlikTech International AB
- 10.2.7.1. Overview
- 10.2.7.2. Products
- 10.2.7.3. SWOT Analysis
- 10.2.7.4. Recent Developments
- 10.2.7.5. Financials (Based on Availability)
- 10.2.8 Sisense Inc
- 10.2.8.1. Overview
- 10.2.8.2. Products
- 10.2.8.3. SWOT Analysis
- 10.2.8.4. Recent Developments
- 10.2.8.5. Financials (Based on Availability)
- 10.2.9 SAP SE
- 10.2.9.1. Overview
- 10.2.9.2. Products
- 10.2.9.3. SWOT Analysis
- 10.2.9.4. Recent Developments
- 10.2.9.5. Financials (Based on Availability)
- 10.2.10 MicroStrategy Inc
- 10.2.10.1. Overview
- 10.2.10.2. Products
- 10.2.10.3. SWOT Analysis
- 10.2.10.4. Recent Developments
- 10.2.10.5. Financials (Based on Availability)
- 10.2.11 Salesforce com inc
- 10.2.11.1. Overview
- 10.2.11.2. Products
- 10.2.11.3. SWOT Analysis
- 10.2.11.4. Recent Developments
- 10.2.11.5. Financials (Based on Availability)
- 10.2.1 SAS Institute Inc
List of Figures
- Figure 1: Global Augmented Analytics Market Revenue Breakdown (Million, %) by Region 2025 & 2033
- Figure 2: North America Augmented Analytics Market Revenue (Million), by Deployment 2025 & 2033
- Figure 3: North America Augmented Analytics Market Revenue Share (%), by Deployment 2025 & 2033
- Figure 4: North America Augmented Analytics Market Revenue (Million), by End-user Industry 2025 & 2033
- Figure 5: North America Augmented Analytics Market Revenue Share (%), by End-user Industry 2025 & 2033
- Figure 6: North America Augmented Analytics Market Revenue (Million), by Country 2025 & 2033
- Figure 7: North America Augmented Analytics Market Revenue Share (%), by Country 2025 & 2033
- Figure 8: Europe Augmented Analytics Market Revenue (Million), by Deployment 2025 & 2033
- Figure 9: Europe Augmented Analytics Market Revenue Share (%), by Deployment 2025 & 2033
- Figure 10: Europe Augmented Analytics Market Revenue (Million), by End-user Industry 2025 & 2033
- Figure 11: Europe Augmented Analytics Market Revenue Share (%), by End-user Industry 2025 & 2033
- Figure 12: Europe Augmented Analytics Market Revenue (Million), by Country 2025 & 2033
- Figure 13: Europe Augmented Analytics Market Revenue Share (%), by Country 2025 & 2033
- Figure 14: Asia Pacific Augmented Analytics Market Revenue (Million), by Deployment 2025 & 2033
- Figure 15: Asia Pacific Augmented Analytics Market Revenue Share (%), by Deployment 2025 & 2033
- Figure 16: Asia Pacific Augmented Analytics Market Revenue (Million), by End-user Industry 2025 & 2033
- Figure 17: Asia Pacific Augmented Analytics Market Revenue Share (%), by End-user Industry 2025 & 2033
- Figure 18: Asia Pacific Augmented Analytics Market Revenue (Million), by Country 2025 & 2033
- Figure 19: Asia Pacific Augmented Analytics Market Revenue Share (%), by Country 2025 & 2033
- Figure 20: Rest of the World Augmented Analytics Market Revenue (Million), by Deployment 2025 & 2033
- Figure 21: Rest of the World Augmented Analytics Market Revenue Share (%), by Deployment 2025 & 2033
- Figure 22: Rest of the World Augmented Analytics Market Revenue (Million), by End-user Industry 2025 & 2033
- Figure 23: Rest of the World Augmented Analytics Market Revenue Share (%), by End-user Industry 2025 & 2033
- Figure 24: Rest of the World Augmented Analytics Market Revenue (Million), by Country 2025 & 2033
- Figure 25: Rest of the World Augmented Analytics Market Revenue Share (%), by Country 2025 & 2033
List of Tables
- Table 1: Global Augmented Analytics Market Revenue Million Forecast, by Deployment 2020 & 2033
- Table 2: Global Augmented Analytics Market Revenue Million Forecast, by End-user Industry 2020 & 2033
- Table 3: Global Augmented Analytics Market Revenue Million Forecast, by Region 2020 & 2033
- Table 4: Global Augmented Analytics Market Revenue Million Forecast, by Deployment 2020 & 2033
- Table 5: Global Augmented Analytics Market Revenue Million Forecast, by End-user Industry 2020 & 2033
- Table 6: Global Augmented Analytics Market Revenue Million Forecast, by Country 2020 & 2033
- Table 7: Global Augmented Analytics Market Revenue Million Forecast, by Deployment 2020 & 2033
- Table 8: Global Augmented Analytics Market Revenue Million Forecast, by End-user Industry 2020 & 2033
- Table 9: Global Augmented Analytics Market Revenue Million Forecast, by Country 2020 & 2033
- Table 10: Global Augmented Analytics Market Revenue Million Forecast, by Deployment 2020 & 2033
- Table 11: Global Augmented Analytics Market Revenue Million Forecast, by End-user Industry 2020 & 2033
- Table 12: Global Augmented Analytics Market Revenue Million Forecast, by Country 2020 & 2033
- Table 13: Global Augmented Analytics Market Revenue Million Forecast, by Deployment 2020 & 2033
- Table 14: Global Augmented Analytics Market Revenue Million Forecast, by End-user Industry 2020 & 2033
- Table 15: Global Augmented Analytics Market Revenue Million Forecast, by Country 2020 & 2033
Frequently Asked Questions
1. What is the projected Compound Annual Growth Rate (CAGR) of the Augmented Analytics Market?
The projected CAGR is approximately 28.09%.
2. Which companies are prominent players in the Augmented Analytics Market?
Key companies in the market include SAS Institute Inc, TIBCO Software Inc, IBM Corporation, ThoughtSpot Inc, GoodData Corporation*List Not Exhaustive, Microsoft Corporation, QlikTech International AB, Sisense Inc, SAP SE, MicroStrategy Inc, Salesforce com inc.
3. What are the main segments of the Augmented Analytics Market?
The market segments include Deployment, End-user Industry.
4. Can you provide details about the market size?
The market size is estimated to be USD 23.27 Million as of 2022.
5. What are some drivers contributing to market growth?
Increasing Demand to Cater Complex Business Data; Huge Adoption of Business Intelligence Tools.
6. What are the notable trends driving market growth?
Retail Sector is Expected to Have a Significant Growth During the Forecast Period.
7. Are there any restraints impacting market growth?
Resistance Due to Replacement of Human Intelligence.
8. Can you provide examples of recent developments in the market?
May 2023: TrinityLife Sciences, a leader in global life sciences commercialization solutions, and WhizAI, a leader in AI-powered analytics for life sciences and healthcare, announced a strategic partnership that allows life sciences companies to quickly and easily generate and share AI-driven insights. WhizAI’s augmented analytics can be layered on Trinity’s enterprise reporting platforms to bring insights to more organizational stakeholders.
9. What pricing options are available for accessing the report?
Pricing options include single-user, multi-user, and enterprise licenses priced at USD 4750, USD 5250, and USD 8750 respectively.
10. Is the market size provided in terms of value or volume?
The market size is provided in terms of value, measured in Million.
11. Are there any specific market keywords associated with the report?
Yes, the market keyword associated with the report is "Augmented Analytics Market," which aids in identifying and referencing the specific market segment covered.
12. How do I determine which pricing option suits my needs best?
The pricing options vary based on user requirements and access needs. Individual users may opt for single-user licenses, while businesses requiring broader access may choose multi-user or enterprise licenses for cost-effective access to the report.
13. Are there any additional resources or data provided in the Augmented Analytics Market report?
While the report offers comprehensive insights, it's advisable to review the specific contents or supplementary materials provided to ascertain if additional resources or data are available.
14. How can I stay updated on further developments or reports in the Augmented Analytics Market?
To stay informed about further developments, trends, and reports in the Augmented Analytics Market, consider subscribing to industry newsletters, following relevant companies and organizations, or regularly checking reputable industry news sources and publications.
Methodology
Step 1 - Identification of Relevant Samples Size from Population Database


Step 2 - Approaches for Defining Global Market Size (Value, Volume* & Price*)

Note*: In applicable scenarios
Step 3 - Data Sources
Primary Research
- Web Analytics
- Survey Reports
- Research Institute
- Latest Research Reports
- Opinion Leaders
Secondary Research
- Annual Reports
- White Paper
- Latest Press Release
- Industry Association
- Paid Database
- Investor Presentations

Step 4 - Data Triangulation
Involves using different sources of information in order to increase the validity of a study
These sources are likely to be stakeholders in a program - participants, other researchers, program staff, other community members, and so on.
Then we put all data in single framework & apply various statistical tools to find out the dynamic on the market.
During the analysis stage, feedback from the stakeholder groups would be compared to determine areas of agreement as well as areas of divergence