
Key Insights
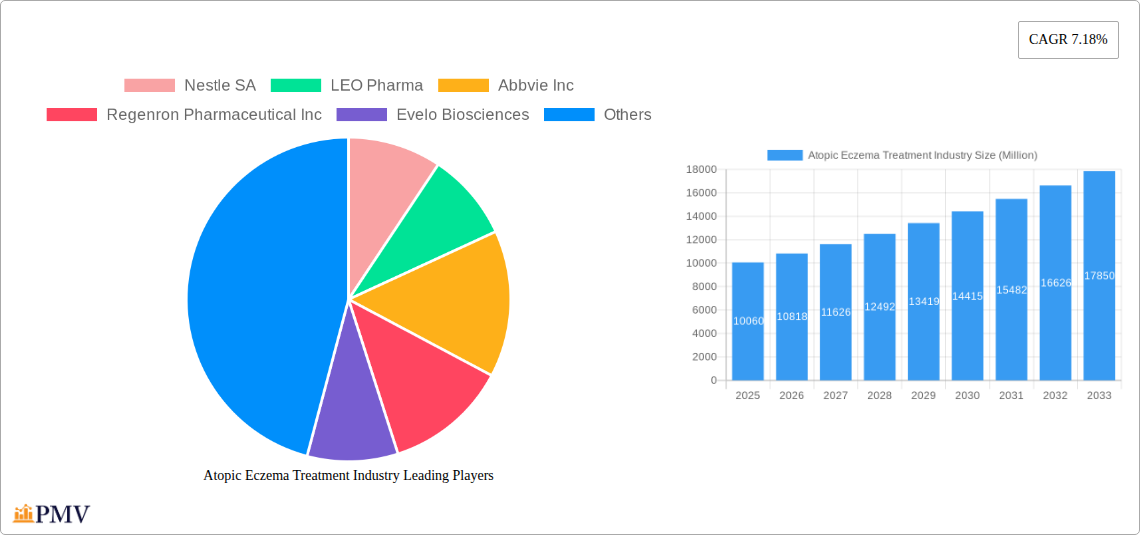
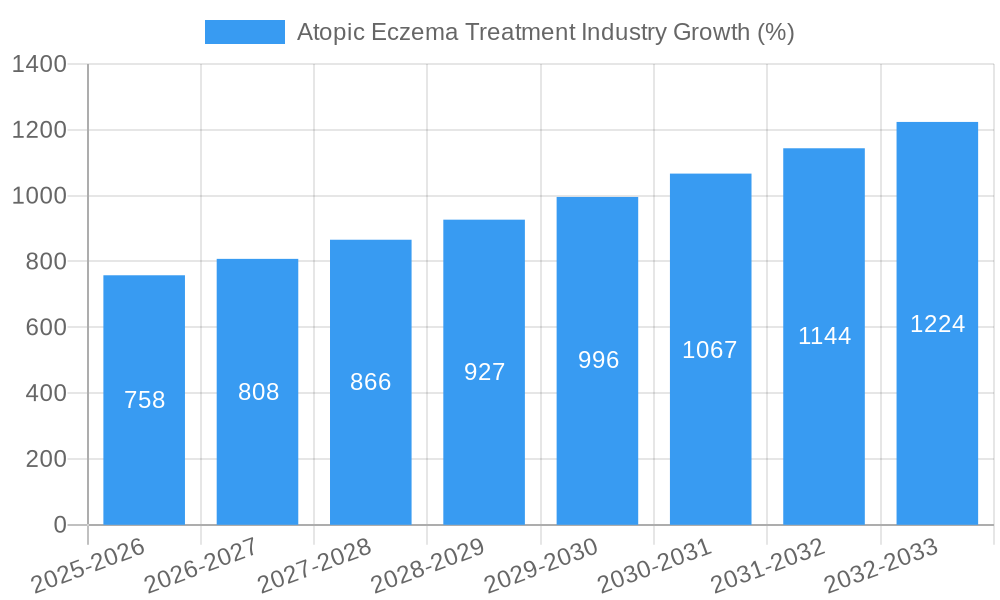
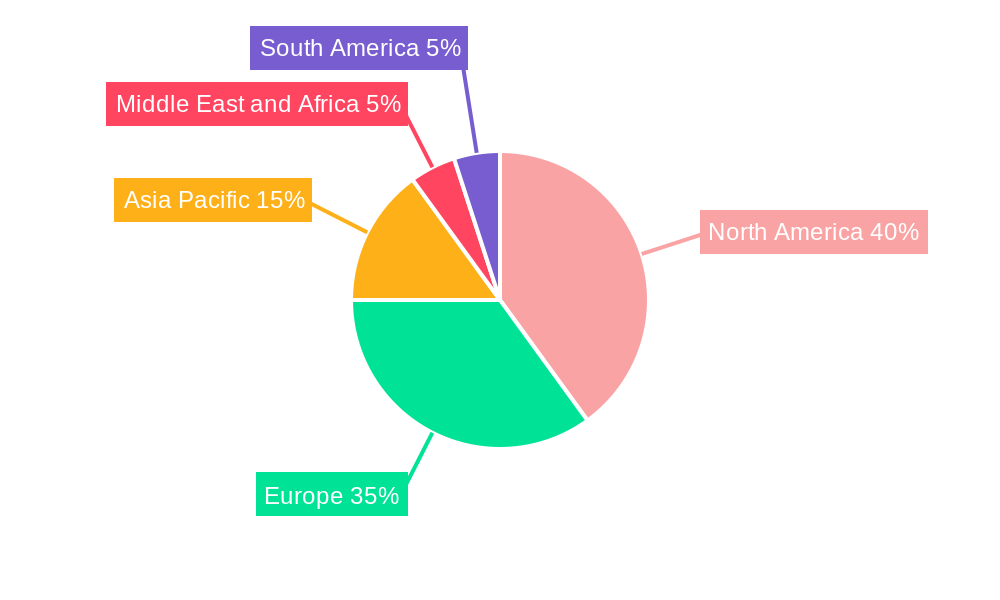
The atopic eczema treatment market, valued at $10.06 billion in 2025, is projected to experience robust growth, driven by rising prevalence of atopic dermatitis, increased healthcare expenditure, and advancements in therapeutic approaches. The market's 7.18% CAGR from 2025 to 2033 signifies significant expansion opportunities. Key growth drivers include the increasing awareness about atopic eczema and its effective management, the launch of novel biologics and targeted therapies offering improved efficacy and safety profiles compared to traditional treatments, and a growing preference for convenient topical formulations. Market segmentation reveals that topical corticosteroids and emollients/moisturizers currently hold a substantial share, while newer drug classes like IL-4 and PDE4 inhibitors are rapidly gaining traction due to their targeted mechanism of action and potential for better long-term disease control. Geographic analysis suggests North America and Europe currently dominate the market due to high prevalence rates and better access to healthcare. However, Asia Pacific is expected to witness significant growth in the coming years due to increasing awareness, rising disposable incomes, and expanding healthcare infrastructure. Challenges include high treatment costs, potential side effects associated with certain therapies, and the need for personalized treatment strategies given the heterogeneity of the disease.
The competitive landscape is highly dynamic, with major pharmaceutical companies such as AbbVie, Regeneron, Pfizer, and Sanofi actively engaged in research and development of innovative therapies. Strategic partnerships, mergers and acquisitions, and robust marketing campaigns play crucial roles in shaping the competitive dynamics. The market is poised for further consolidation as companies strive to expand their product portfolios and geographic reach. Future growth will likely be influenced by the success of new therapies entering the market, evolving treatment guidelines, and the growing focus on personalized medicine approaches tailored to the individual patient's needs and disease severity. The overall prognosis for the atopic eczema treatment market remains optimistic, fueled by continuous innovation and increasing global awareness of this prevalent dermatological condition.
Atopic Eczema Treatment Industry Market Report: 2019-2033
This comprehensive report provides an in-depth analysis of the Atopic Eczema Treatment market, projecting a robust growth trajectory over the forecast period (2025-2033). Valued at $XX Million in 2025 (Estimated Year), the market is poised for significant expansion, driven by factors including increasing prevalence of atopic dermatitis, advancements in treatment modalities, and rising healthcare expenditure. The report covers the period 2019-2033, with 2025 serving as the base year. This detailed analysis offers invaluable insights for industry stakeholders, including pharmaceutical companies, investors, and healthcare professionals.
Atopic Eczema Treatment Industry Market Structure & Competitive Dynamics
The atopic eczema treatment market exhibits a moderately consolidated structure, with several multinational pharmaceutical giants holding significant market share. Nestle SA, LEO Pharma, Abbvie Inc, Regeneron Pharmaceuticals Inc, Evelo Biosciences, Cara Therapeutics, Allergan PLC, Bausch Health Companies Inc, Bristol-Myers Squibb Company, GlaxoSmithKline PLC, Sanofi S.A, and Pfizer Inc are key players, actively engaged in research and development, strategic partnerships, and acquisitions to expand their market footprint. Market share dynamics are influenced by factors such as the launch of innovative therapies, regulatory approvals, and pricing strategies. The industry is characterized by a high level of innovation, with ongoing research focused on developing novel drug classes and delivery mechanisms. Regulatory frameworks, particularly FDA approvals in key markets like the US and Europe, significantly impact market access and growth. The presence of substitute therapies, such as home remedies and alternative medicine, also shapes the competitive landscape. End-user preferences, including patient demand for effective and convenient treatment options, influence market trends. The period 2019-2024 witnessed several M&A activities, with deal values totaling approximately $XX Million, reflecting a consolidation trend within the industry. These mergers and acquisitions are driven by the need to expand product portfolios, enhance R&D capabilities, and gain a competitive edge.
- Market Concentration: Moderately Consolidated
- Innovation Ecosystem: Highly Active
- Regulatory Framework: Stringent, varying by region
- Product Substitutes: Home remedies, alternative medicine
- M&A Activity (2019-2024): $XX Million in deal value
Atopic Eczema Treatment Industry Trends & Insights
The atopic eczema treatment market is witnessing robust growth, projected to achieve a CAGR of XX% during the forecast period (2025-2033). This expansion is fueled by several key factors, including the rising prevalence of atopic dermatitis globally, an increase in the geriatric population, and the growing awareness about the disease among patients and healthcare professionals. Technological advancements in drug development, particularly the emergence of targeted biologics, have significantly enhanced treatment efficacy. The market is further driven by increasing healthcare spending, particularly in developed economies, leading to greater accessibility of advanced treatments. Consumer preferences are shifting toward personalized medicine approaches, with a focus on convenient and less invasive treatment options. Competitive dynamics remain intense, with pharmaceutical companies investing heavily in R&D to develop novel therapies and gain a competitive edge. Market penetration of biologics is rapidly increasing, driven by their superior efficacy compared to traditional treatments. The high cost of biologics, however, remains a significant challenge for wider market adoption. Furthermore, emerging markets offer substantial growth opportunities.
Dominant Markets & Segments in Atopic Eczema Treatment Industry
The North American region currently dominates the atopic eczema treatment market, driven by high healthcare expenditure, advanced healthcare infrastructure, and a relatively high prevalence of atopic dermatitis. However, developing regions are expected to witness significant growth in the coming years.
Drug Class Dominance:
- Topical Corticosteroids: This segment holds a significant market share due to its established efficacy, relatively lower cost, and wide availability. Key drivers include established use in clinical practice and cost-effectiveness.
- Emollients/Moisturizers: This segment is characterized by high volume sales driven by over-the-counter availability and widespread use as a first-line treatment or adjuvant therapy. Key drivers include ease of access and use, and mild nature.
- IL-4 and PDE4 Inhibitors: This segment showcases the fastest growth, fueled by the emergence of highly effective biologics with targeted mechanisms. Key drivers are high efficacy and novel mode of action.
- Calcineurin Inhibitors: This segment holds a stable market share owing to efficacy and a distinct therapeutic profile, but is challenged by side effect profiles. Key drivers include high efficacy in certain patient populations and well-established use.
- Antibiotics: This segment is used for secondary infections and plays a smaller role in overall treatment. Key drivers are management of secondary bacterial infections.
- Other Drug Classes: This segment comprises emerging therapies and newer drug modalities, which demonstrates increasing potential for growth. Key drivers are continuous innovation in drug development and improved efficacy.
Route of Administration Dominance:
- Topical: This segment dominates due to its ease of use, convenience, and reduced systemic side effects. Key drivers include patient preference and minimal invasiveness.
- Oral: This route plays a significant role in certain disease severities and is preferred over topical therapies in some cases. Key drivers are systemic disease management.
- Injectable: This segment, largely composed of biologics, is experiencing rapid growth despite high cost, driven by superior efficacy and targeted action. Key drivers are high efficacy in moderate-to-severe disease.
Atopic Eczema Treatment Industry Product Innovations
The atopic eczema treatment landscape is experiencing significant innovation, driven by advancements in biotechnology and drug delivery systems. The development of targeted biologics, such as IL-4 and IL-13 inhibitors, offers highly effective treatments for moderate-to-severe atopic dermatitis. Furthermore, novel topical formulations are enhancing efficacy and minimizing side effects. These innovations are improving patient outcomes and expanding treatment options, resulting in a better market fit for a broader range of patients.
Report Segmentation & Scope
This report segments the atopic eczema treatment market by drug class (Corticosteroids, Emollients/Moisturizers, IL-4 and PDE4 Inhibitors, Calcineurin Inhibitors, Antibiotics, Other Drug Classes) and route of administration (Topical, Oral, Injectable). Each segment's growth projections, market size (in Millions), and competitive dynamics are analyzed. The report provides a comprehensive overview of the market's landscape and future trajectory.
- Drug Class Segments: Each segment showcases distinct growth rates based on efficacy, safety profiles, and market penetration.
- Route of Administration Segments: Each segment's growth is influenced by patient preference, convenience, and the availability of drugs delivered via that specific route.
Key Drivers of Atopic Eczema Treatment Industry Growth
Several factors contribute to the robust growth of the atopic eczema treatment market. These include the rising prevalence of atopic dermatitis, particularly in developed countries, and the growing awareness among patients and healthcare providers of available treatment options. Advancements in treatment modalities, including the development of highly effective biologics and targeted therapies, are significantly influencing market expansion. Furthermore, increasing healthcare expenditure and the growing demand for personalized medicine approaches are supporting market growth. Favorable regulatory environments in key markets also contribute to the growth.
Challenges in the Atopic Eczema Treatment Industry Sector
Despite the positive growth outlook, the atopic eczema treatment market faces certain challenges. The high cost of biologics limits accessibility for many patients, particularly in low- and middle-income countries. The development of drug resistance and the emergence of adverse effects associated with certain therapies pose further challenges. Competition from generic drugs and the potential for regulatory hurdles can also constrain market growth. The complexity of atopic dermatitis and its varied presentation across patients add to the difficulty in developing universally effective treatments. Supply chain disruptions and manufacturing capacity constraints can impact market supply.
Leading Players in the Atopic Eczema Treatment Industry Market
- Nestle SA
- LEO Pharma
- Abbvie Inc
- Regeneron Pharmaceuticals Inc
- Evelo Biosciences
- Cara Therapeutics
- Allergan PLC
- Bausch Health Companies Inc
- Bristol-Myers Squibb Company
- GlaxoSmithKline PLC
- Sanofi S.A
- Pfizer Inc
Key Developments in Atopic Eczema Treatment Industry Sector
- June 2022: Sanofi received USFDA approval for Dupixent (dupilumab) for children aged 6 months to 5 years with moderate-to-severe atopic dermatitis. This significantly expands the addressable market for Dupixent.
- October 2022: Leo Pharma launched a multi-cultural awareness campaign for atopic dermatitis, raising patient awareness and highlighting the disease's impact. This initiative improves patient understanding and drives demand for treatment.
Strategic Atopic Eczema Treatment Industry Market Outlook
The atopic eczema treatment market is expected to maintain robust growth over the forecast period, driven by continuous innovation in drug development, rising disease prevalence, and increasing healthcare spending. Strategic opportunities lie in developing novel therapies that address unmet needs, such as improving treatment efficacy and minimizing side effects. Focusing on personalized medicine approaches and expanding market access in emerging economies offer significant potential for growth. Companies that invest in R&D, establish strong partnerships, and effectively navigate regulatory landscapes will be well-positioned for success in this dynamic market.
Atopic Eczema Treatment Industry Segmentation
-
1. Drug Class
- 1.1. Corticosteroids
- 1.2. Emollients/Moisturizers
- 1.3. IL-4 and PDE4 Inhibitors
- 1.4. Calcineurin Inhibitors
- 1.5. Antibiotics
- 1.6. Other Drug Classes
-
2. Route of Administration
- 2.1. Topical
- 2.2. Oral
- 2.3. Injectable
Atopic Eczema Treatment Industry Segmentation By Geography
-
1. North America
- 1.1. United States
- 1.2. Canada
- 1.3. Mexico
-
2. Europe
- 2.1. Germany
- 2.2. United Kingdom
- 2.3. France
- 2.4. Italy
- 2.5. Spain
- 2.6. Rest of Europe
-
3. Asia Pacific
- 3.1. China
- 3.2. Japan
- 3.3. India
- 3.4. Australia
- 3.5. South korea
- 3.6. Rest of Asia Pacific
-
4. Middle East and Africa
- 4.1. GCC
- 4.2. South Africa
- 4.3. Rest of Middle East and Africa
-
5. South America
- 5.1. Brazil
- 5.2. Argentina
- 5.3. Rest of South America
Atopic Eczema Treatment Industry REPORT HIGHLIGHTS
| Aspects | Details |
|---|---|
| Study Period | 2019-2033 |
| Base Year | 2024 |
| Estimated Year | 2025 |
| Forecast Period | 2025-2033 |
| Historical Period | 2019-2024 |
| Growth Rate | CAGR of 7.18% from 2019-2033 |
| Segmentation |
|
Table of Contents
- 1. Introduction
- 1.1. Research Scope
- 1.2. Market Segmentation
- 1.3. Research Methodology
- 1.4. Definitions and Assumptions
- 2. Executive Summary
- 2.1. Introduction
- 3. Market Dynamics
- 3.1. Introduction
- 3.2. Market Drivers
- 3.2.1. Increasing Burden of Allergic Reactions with Major Role of Food Allergy; Increasing Environmental Pollution
- 3.3. Market Restrains
- 3.3.1. Serious Adverse Effects Related to Certain Therapeutic Drugs
- 3.4. Market Trends
- 3.4.1. Corticosteroids Segment Dominated the Atopic Dermatitis Market Over the Forecast Period
- 4. Market Factor Analysis
- 4.1. Porters Five Forces
- 4.2. Supply/Value Chain
- 4.3. PESTEL analysis
- 4.4. Market Entropy
- 4.5. Patent/Trademark Analysis
- 5. Global Atopic Eczema Treatment Industry Analysis, Insights and Forecast, 2019-2031
- 5.1. Market Analysis, Insights and Forecast - by Drug Class
- 5.1.1. Corticosteroids
- 5.1.2. Emollients/Moisturizers
- 5.1.3. IL-4 and PDE4 Inhibitors
- 5.1.4. Calcineurin Inhibitors
- 5.1.5. Antibiotics
- 5.1.6. Other Drug Classes
- 5.2. Market Analysis, Insights and Forecast - by Route of Administration
- 5.2.1. Topical
- 5.2.2. Oral
- 5.2.3. Injectable
- 5.3. Market Analysis, Insights and Forecast - by Region
- 5.3.1. North America
- 5.3.2. Europe
- 5.3.3. Asia Pacific
- 5.3.4. Middle East and Africa
- 5.3.5. South America
- 5.1. Market Analysis, Insights and Forecast - by Drug Class
- 6. North America Atopic Eczema Treatment Industry Analysis, Insights and Forecast, 2019-2031
- 6.1. Market Analysis, Insights and Forecast - by Drug Class
- 6.1.1. Corticosteroids
- 6.1.2. Emollients/Moisturizers
- 6.1.3. IL-4 and PDE4 Inhibitors
- 6.1.4. Calcineurin Inhibitors
- 6.1.5. Antibiotics
- 6.1.6. Other Drug Classes
- 6.2. Market Analysis, Insights and Forecast - by Route of Administration
- 6.2.1. Topical
- 6.2.2. Oral
- 6.2.3. Injectable
- 6.1. Market Analysis, Insights and Forecast - by Drug Class
- 7. Europe Atopic Eczema Treatment Industry Analysis, Insights and Forecast, 2019-2031
- 7.1. Market Analysis, Insights and Forecast - by Drug Class
- 7.1.1. Corticosteroids
- 7.1.2. Emollients/Moisturizers
- 7.1.3. IL-4 and PDE4 Inhibitors
- 7.1.4. Calcineurin Inhibitors
- 7.1.5. Antibiotics
- 7.1.6. Other Drug Classes
- 7.2. Market Analysis, Insights and Forecast - by Route of Administration
- 7.2.1. Topical
- 7.2.2. Oral
- 7.2.3. Injectable
- 7.1. Market Analysis, Insights and Forecast - by Drug Class
- 8. Asia Pacific Atopic Eczema Treatment Industry Analysis, Insights and Forecast, 2019-2031
- 8.1. Market Analysis, Insights and Forecast - by Drug Class
- 8.1.1. Corticosteroids
- 8.1.2. Emollients/Moisturizers
- 8.1.3. IL-4 and PDE4 Inhibitors
- 8.1.4. Calcineurin Inhibitors
- 8.1.5. Antibiotics
- 8.1.6. Other Drug Classes
- 8.2. Market Analysis, Insights and Forecast - by Route of Administration
- 8.2.1. Topical
- 8.2.2. Oral
- 8.2.3. Injectable
- 8.1. Market Analysis, Insights and Forecast - by Drug Class
- 9. Middle East and Africa Atopic Eczema Treatment Industry Analysis, Insights and Forecast, 2019-2031
- 9.1. Market Analysis, Insights and Forecast - by Drug Class
- 9.1.1. Corticosteroids
- 9.1.2. Emollients/Moisturizers
- 9.1.3. IL-4 and PDE4 Inhibitors
- 9.1.4. Calcineurin Inhibitors
- 9.1.5. Antibiotics
- 9.1.6. Other Drug Classes
- 9.2. Market Analysis, Insights and Forecast - by Route of Administration
- 9.2.1. Topical
- 9.2.2. Oral
- 9.2.3. Injectable
- 9.1. Market Analysis, Insights and Forecast - by Drug Class
- 10. South America Atopic Eczema Treatment Industry Analysis, Insights and Forecast, 2019-2031
- 10.1. Market Analysis, Insights and Forecast - by Drug Class
- 10.1.1. Corticosteroids
- 10.1.2. Emollients/Moisturizers
- 10.1.3. IL-4 and PDE4 Inhibitors
- 10.1.4. Calcineurin Inhibitors
- 10.1.5. Antibiotics
- 10.1.6. Other Drug Classes
- 10.2. Market Analysis, Insights and Forecast - by Route of Administration
- 10.2.1. Topical
- 10.2.2. Oral
- 10.2.3. Injectable
- 10.1. Market Analysis, Insights and Forecast - by Drug Class
- 11. North America Atopic Eczema Treatment Industry Analysis, Insights and Forecast, 2019-2031
- 11.1. Market Analysis, Insights and Forecast - By Country/Sub-region
- 11.1.1 United States
- 11.1.2 Canada
- 11.1.3 Mexico
- 12. Europe Atopic Eczema Treatment Industry Analysis, Insights and Forecast, 2019-2031
- 12.1. Market Analysis, Insights and Forecast - By Country/Sub-region
- 12.1.1 Germany
- 12.1.2 United Kingdom
- 12.1.3 France
- 12.1.4 Italy
- 12.1.5 Spain
- 12.1.6 Rest of Europe
- 13. Asia Pacific Atopic Eczema Treatment Industry Analysis, Insights and Forecast, 2019-2031
- 13.1. Market Analysis, Insights and Forecast - By Country/Sub-region
- 13.1.1 China
- 13.1.2 Japan
- 13.1.3 India
- 13.1.4 Australia
- 13.1.5 South korea
- 13.1.6 Rest of Asia Pacific
- 14. Middle East and Africa Atopic Eczema Treatment Industry Analysis, Insights and Forecast, 2019-2031
- 14.1. Market Analysis, Insights and Forecast - By Country/Sub-region
- 14.1.1 GCC
- 14.1.2 South Africa
- 14.1.3 Rest of Middle East and Africa
- 15. South America Atopic Eczema Treatment Industry Analysis, Insights and Forecast, 2019-2031
- 15.1. Market Analysis, Insights and Forecast - By Country/Sub-region
- 15.1.1 Brazil
- 15.1.2 Argentina
- 15.1.3 Rest of South America
- 16. Competitive Analysis
- 16.1. Global Market Share Analysis 2024
- 16.2. Company Profiles
- 16.2.1 Nestle SA
- 16.2.1.1. Overview
- 16.2.1.2. Products
- 16.2.1.3. SWOT Analysis
- 16.2.1.4. Recent Developments
- 16.2.1.5. Financials (Based on Availability)
- 16.2.2 LEO Pharma
- 16.2.2.1. Overview
- 16.2.2.2. Products
- 16.2.2.3. SWOT Analysis
- 16.2.2.4. Recent Developments
- 16.2.2.5. Financials (Based on Availability)
- 16.2.3 Abbvie Inc
- 16.2.3.1. Overview
- 16.2.3.2. Products
- 16.2.3.3. SWOT Analysis
- 16.2.3.4. Recent Developments
- 16.2.3.5. Financials (Based on Availability)
- 16.2.4 Regenron Pharmaceutical Inc
- 16.2.4.1. Overview
- 16.2.4.2. Products
- 16.2.4.3. SWOT Analysis
- 16.2.4.4. Recent Developments
- 16.2.4.5. Financials (Based on Availability)
- 16.2.5 Evelo Biosciences
- 16.2.5.1. Overview
- 16.2.5.2. Products
- 16.2.5.3. SWOT Analysis
- 16.2.5.4. Recent Developments
- 16.2.5.5. Financials (Based on Availability)
- 16.2.6 Cara Therapeutics
- 16.2.6.1. Overview
- 16.2.6.2. Products
- 16.2.6.3. SWOT Analysis
- 16.2.6.4. Recent Developments
- 16.2.6.5. Financials (Based on Availability)
- 16.2.7 Allergan PLC
- 16.2.7.1. Overview
- 16.2.7.2. Products
- 16.2.7.3. SWOT Analysis
- 16.2.7.4. Recent Developments
- 16.2.7.5. Financials (Based on Availability)
- 16.2.8 Bausch Health Companies Inc
- 16.2.8.1. Overview
- 16.2.8.2. Products
- 16.2.8.3. SWOT Analysis
- 16.2.8.4. Recent Developments
- 16.2.8.5. Financials (Based on Availability)
- 16.2.9 Bristol-Myers Squibb Company
- 16.2.9.1. Overview
- 16.2.9.2. Products
- 16.2.9.3. SWOT Analysis
- 16.2.9.4. Recent Developments
- 16.2.9.5. Financials (Based on Availability)
- 16.2.10 GlaxoSmithKline PLC
- 16.2.10.1. Overview
- 16.2.10.2. Products
- 16.2.10.3. SWOT Analysis
- 16.2.10.4. Recent Developments
- 16.2.10.5. Financials (Based on Availability)
- 16.2.11 Sanofi S A
- 16.2.11.1. Overview
- 16.2.11.2. Products
- 16.2.11.3. SWOT Analysis
- 16.2.11.4. Recent Developments
- 16.2.11.5. Financials (Based on Availability)
- 16.2.12 Pfizer Inc
- 16.2.12.1. Overview
- 16.2.12.2. Products
- 16.2.12.3. SWOT Analysis
- 16.2.12.4. Recent Developments
- 16.2.12.5. Financials (Based on Availability)
- 16.2.1 Nestle SA
List of Figures
- Figure 1: Global Atopic Eczema Treatment Industry Revenue Breakdown (Million, %) by Region 2024 & 2032
- Figure 2: North America Atopic Eczema Treatment Industry Revenue (Million), by Country 2024 & 2032
- Figure 3: North America Atopic Eczema Treatment Industry Revenue Share (%), by Country 2024 & 2032
- Figure 4: Europe Atopic Eczema Treatment Industry Revenue (Million), by Country 2024 & 2032
- Figure 5: Europe Atopic Eczema Treatment Industry Revenue Share (%), by Country 2024 & 2032
- Figure 6: Asia Pacific Atopic Eczema Treatment Industry Revenue (Million), by Country 2024 & 2032
- Figure 7: Asia Pacific Atopic Eczema Treatment Industry Revenue Share (%), by Country 2024 & 2032
- Figure 8: Middle East and Africa Atopic Eczema Treatment Industry Revenue (Million), by Country 2024 & 2032
- Figure 9: Middle East and Africa Atopic Eczema Treatment Industry Revenue Share (%), by Country 2024 & 2032
- Figure 10: South America Atopic Eczema Treatment Industry Revenue (Million), by Country 2024 & 2032
- Figure 11: South America Atopic Eczema Treatment Industry Revenue Share (%), by Country 2024 & 2032
- Figure 12: North America Atopic Eczema Treatment Industry Revenue (Million), by Drug Class 2024 & 2032
- Figure 13: North America Atopic Eczema Treatment Industry Revenue Share (%), by Drug Class 2024 & 2032
- Figure 14: North America Atopic Eczema Treatment Industry Revenue (Million), by Route of Administration 2024 & 2032
- Figure 15: North America Atopic Eczema Treatment Industry Revenue Share (%), by Route of Administration 2024 & 2032
- Figure 16: North America Atopic Eczema Treatment Industry Revenue (Million), by Country 2024 & 2032
- Figure 17: North America Atopic Eczema Treatment Industry Revenue Share (%), by Country 2024 & 2032
- Figure 18: Europe Atopic Eczema Treatment Industry Revenue (Million), by Drug Class 2024 & 2032
- Figure 19: Europe Atopic Eczema Treatment Industry Revenue Share (%), by Drug Class 2024 & 2032
- Figure 20: Europe Atopic Eczema Treatment Industry Revenue (Million), by Route of Administration 2024 & 2032
- Figure 21: Europe Atopic Eczema Treatment Industry Revenue Share (%), by Route of Administration 2024 & 2032
- Figure 22: Europe Atopic Eczema Treatment Industry Revenue (Million), by Country 2024 & 2032
- Figure 23: Europe Atopic Eczema Treatment Industry Revenue Share (%), by Country 2024 & 2032
- Figure 24: Asia Pacific Atopic Eczema Treatment Industry Revenue (Million), by Drug Class 2024 & 2032
- Figure 25: Asia Pacific Atopic Eczema Treatment Industry Revenue Share (%), by Drug Class 2024 & 2032
- Figure 26: Asia Pacific Atopic Eczema Treatment Industry Revenue (Million), by Route of Administration 2024 & 2032
- Figure 27: Asia Pacific Atopic Eczema Treatment Industry Revenue Share (%), by Route of Administration 2024 & 2032
- Figure 28: Asia Pacific Atopic Eczema Treatment Industry Revenue (Million), by Country 2024 & 2032
- Figure 29: Asia Pacific Atopic Eczema Treatment Industry Revenue Share (%), by Country 2024 & 2032
- Figure 30: Middle East and Africa Atopic Eczema Treatment Industry Revenue (Million), by Drug Class 2024 & 2032
- Figure 31: Middle East and Africa Atopic Eczema Treatment Industry Revenue Share (%), by Drug Class 2024 & 2032
- Figure 32: Middle East and Africa Atopic Eczema Treatment Industry Revenue (Million), by Route of Administration 2024 & 2032
- Figure 33: Middle East and Africa Atopic Eczema Treatment Industry Revenue Share (%), by Route of Administration 2024 & 2032
- Figure 34: Middle East and Africa Atopic Eczema Treatment Industry Revenue (Million), by Country 2024 & 2032
- Figure 35: Middle East and Africa Atopic Eczema Treatment Industry Revenue Share (%), by Country 2024 & 2032
- Figure 36: South America Atopic Eczema Treatment Industry Revenue (Million), by Drug Class 2024 & 2032
- Figure 37: South America Atopic Eczema Treatment Industry Revenue Share (%), by Drug Class 2024 & 2032
- Figure 38: South America Atopic Eczema Treatment Industry Revenue (Million), by Route of Administration 2024 & 2032
- Figure 39: South America Atopic Eczema Treatment Industry Revenue Share (%), by Route of Administration 2024 & 2032
- Figure 40: South America Atopic Eczema Treatment Industry Revenue (Million), by Country 2024 & 2032
- Figure 41: South America Atopic Eczema Treatment Industry Revenue Share (%), by Country 2024 & 2032
List of Tables
- Table 1: Global Atopic Eczema Treatment Industry Revenue Million Forecast, by Region 2019 & 2032
- Table 2: Global Atopic Eczema Treatment Industry Revenue Million Forecast, by Drug Class 2019 & 2032
- Table 3: Global Atopic Eczema Treatment Industry Revenue Million Forecast, by Route of Administration 2019 & 2032
- Table 4: Global Atopic Eczema Treatment Industry Revenue Million Forecast, by Region 2019 & 2032
- Table 5: Global Atopic Eczema Treatment Industry Revenue Million Forecast, by Country 2019 & 2032
- Table 6: United States Atopic Eczema Treatment Industry Revenue (Million) Forecast, by Application 2019 & 2032
- Table 7: Canada Atopic Eczema Treatment Industry Revenue (Million) Forecast, by Application 2019 & 2032
- Table 8: Mexico Atopic Eczema Treatment Industry Revenue (Million) Forecast, by Application 2019 & 2032
- Table 9: Global Atopic Eczema Treatment Industry Revenue Million Forecast, by Country 2019 & 2032
- Table 10: Germany Atopic Eczema Treatment Industry Revenue (Million) Forecast, by Application 2019 & 2032
- Table 11: United Kingdom Atopic Eczema Treatment Industry Revenue (Million) Forecast, by Application 2019 & 2032
- Table 12: France Atopic Eczema Treatment Industry Revenue (Million) Forecast, by Application 2019 & 2032
- Table 13: Italy Atopic Eczema Treatment Industry Revenue (Million) Forecast, by Application 2019 & 2032
- Table 14: Spain Atopic Eczema Treatment Industry Revenue (Million) Forecast, by Application 2019 & 2032
- Table 15: Rest of Europe Atopic Eczema Treatment Industry Revenue (Million) Forecast, by Application 2019 & 2032
- Table 16: Global Atopic Eczema Treatment Industry Revenue Million Forecast, by Country 2019 & 2032
- Table 17: China Atopic Eczema Treatment Industry Revenue (Million) Forecast, by Application 2019 & 2032
- Table 18: Japan Atopic Eczema Treatment Industry Revenue (Million) Forecast, by Application 2019 & 2032
- Table 19: India Atopic Eczema Treatment Industry Revenue (Million) Forecast, by Application 2019 & 2032
- Table 20: Australia Atopic Eczema Treatment Industry Revenue (Million) Forecast, by Application 2019 & 2032
- Table 21: South korea Atopic Eczema Treatment Industry Revenue (Million) Forecast, by Application 2019 & 2032
- Table 22: Rest of Asia Pacific Atopic Eczema Treatment Industry Revenue (Million) Forecast, by Application 2019 & 2032
- Table 23: Global Atopic Eczema Treatment Industry Revenue Million Forecast, by Country 2019 & 2032
- Table 24: GCC Atopic Eczema Treatment Industry Revenue (Million) Forecast, by Application 2019 & 2032
- Table 25: South Africa Atopic Eczema Treatment Industry Revenue (Million) Forecast, by Application 2019 & 2032
- Table 26: Rest of Middle East and Africa Atopic Eczema Treatment Industry Revenue (Million) Forecast, by Application 2019 & 2032
- Table 27: Global Atopic Eczema Treatment Industry Revenue Million Forecast, by Country 2019 & 2032
- Table 28: Brazil Atopic Eczema Treatment Industry Revenue (Million) Forecast, by Application 2019 & 2032
- Table 29: Argentina Atopic Eczema Treatment Industry Revenue (Million) Forecast, by Application 2019 & 2032
- Table 30: Rest of South America Atopic Eczema Treatment Industry Revenue (Million) Forecast, by Application 2019 & 2032
- Table 31: Global Atopic Eczema Treatment Industry Revenue Million Forecast, by Drug Class 2019 & 2032
- Table 32: Global Atopic Eczema Treatment Industry Revenue Million Forecast, by Route of Administration 2019 & 2032
- Table 33: Global Atopic Eczema Treatment Industry Revenue Million Forecast, by Country 2019 & 2032
- Table 34: United States Atopic Eczema Treatment Industry Revenue (Million) Forecast, by Application 2019 & 2032
- Table 35: Canada Atopic Eczema Treatment Industry Revenue (Million) Forecast, by Application 2019 & 2032
- Table 36: Mexico Atopic Eczema Treatment Industry Revenue (Million) Forecast, by Application 2019 & 2032
- Table 37: Global Atopic Eczema Treatment Industry Revenue Million Forecast, by Drug Class 2019 & 2032
- Table 38: Global Atopic Eczema Treatment Industry Revenue Million Forecast, by Route of Administration 2019 & 2032
- Table 39: Global Atopic Eczema Treatment Industry Revenue Million Forecast, by Country 2019 & 2032
- Table 40: Germany Atopic Eczema Treatment Industry Revenue (Million) Forecast, by Application 2019 & 2032
- Table 41: United Kingdom Atopic Eczema Treatment Industry Revenue (Million) Forecast, by Application 2019 & 2032
- Table 42: France Atopic Eczema Treatment Industry Revenue (Million) Forecast, by Application 2019 & 2032
- Table 43: Italy Atopic Eczema Treatment Industry Revenue (Million) Forecast, by Application 2019 & 2032
- Table 44: Spain Atopic Eczema Treatment Industry Revenue (Million) Forecast, by Application 2019 & 2032
- Table 45: Rest of Europe Atopic Eczema Treatment Industry Revenue (Million) Forecast, by Application 2019 & 2032
- Table 46: Global Atopic Eczema Treatment Industry Revenue Million Forecast, by Drug Class 2019 & 2032
- Table 47: Global Atopic Eczema Treatment Industry Revenue Million Forecast, by Route of Administration 2019 & 2032
- Table 48: Global Atopic Eczema Treatment Industry Revenue Million Forecast, by Country 2019 & 2032
- Table 49: China Atopic Eczema Treatment Industry Revenue (Million) Forecast, by Application 2019 & 2032
- Table 50: Japan Atopic Eczema Treatment Industry Revenue (Million) Forecast, by Application 2019 & 2032
- Table 51: India Atopic Eczema Treatment Industry Revenue (Million) Forecast, by Application 2019 & 2032
- Table 52: Australia Atopic Eczema Treatment Industry Revenue (Million) Forecast, by Application 2019 & 2032
- Table 53: South korea Atopic Eczema Treatment Industry Revenue (Million) Forecast, by Application 2019 & 2032
- Table 54: Rest of Asia Pacific Atopic Eczema Treatment Industry Revenue (Million) Forecast, by Application 2019 & 2032
- Table 55: Global Atopic Eczema Treatment Industry Revenue Million Forecast, by Drug Class 2019 & 2032
- Table 56: Global Atopic Eczema Treatment Industry Revenue Million Forecast, by Route of Administration 2019 & 2032
- Table 57: Global Atopic Eczema Treatment Industry Revenue Million Forecast, by Country 2019 & 2032
- Table 58: GCC Atopic Eczema Treatment Industry Revenue (Million) Forecast, by Application 2019 & 2032
- Table 59: South Africa Atopic Eczema Treatment Industry Revenue (Million) Forecast, by Application 2019 & 2032
- Table 60: Rest of Middle East and Africa Atopic Eczema Treatment Industry Revenue (Million) Forecast, by Application 2019 & 2032
- Table 61: Global Atopic Eczema Treatment Industry Revenue Million Forecast, by Drug Class 2019 & 2032
- Table 62: Global Atopic Eczema Treatment Industry Revenue Million Forecast, by Route of Administration 2019 & 2032
- Table 63: Global Atopic Eczema Treatment Industry Revenue Million Forecast, by Country 2019 & 2032
- Table 64: Brazil Atopic Eczema Treatment Industry Revenue (Million) Forecast, by Application 2019 & 2032
- Table 65: Argentina Atopic Eczema Treatment Industry Revenue (Million) Forecast, by Application 2019 & 2032
- Table 66: Rest of South America Atopic Eczema Treatment Industry Revenue (Million) Forecast, by Application 2019 & 2032
Frequently Asked Questions
1. What is the projected Compound Annual Growth Rate (CAGR) of the Atopic Eczema Treatment Industry?
The projected CAGR is approximately 7.18%.
2. Which companies are prominent players in the Atopic Eczema Treatment Industry?
Key companies in the market include Nestle SA, LEO Pharma, Abbvie Inc, Regenron Pharmaceutical Inc, Evelo Biosciences, Cara Therapeutics, Allergan PLC, Bausch Health Companies Inc, Bristol-Myers Squibb Company, GlaxoSmithKline PLC, Sanofi S A, Pfizer Inc.
3. What are the main segments of the Atopic Eczema Treatment Industry?
The market segments include Drug Class, Route of Administration.
4. Can you provide details about the market size?
The market size is estimated to be USD 10.06 Million as of 2022.
5. What are some drivers contributing to market growth?
Increasing Burden of Allergic Reactions with Major Role of Food Allergy; Increasing Environmental Pollution.
6. What are the notable trends driving market growth?
Corticosteroids Segment Dominated the Atopic Dermatitis Market Over the Forecast Period.
7. Are there any restraints impacting market growth?
Serious Adverse Effects Related to Certain Therapeutic Drugs.
8. Can you provide examples of recent developments in the market?
October 2022: Leo Pharma launched a campaign to raise awareness of atopic dermatitis across cultures. This campaign featured the journey of four patients from France, Italy, Germany, and Spain living with chronic skin disease.
9. What pricing options are available for accessing the report?
Pricing options include single-user, multi-user, and enterprise licenses priced at USD 4750, USD 5250, and USD 8750 respectively.
10. Is the market size provided in terms of value or volume?
The market size is provided in terms of value, measured in Million.
11. Are there any specific market keywords associated with the report?
Yes, the market keyword associated with the report is "Atopic Eczema Treatment Industry," which aids in identifying and referencing the specific market segment covered.
12. How do I determine which pricing option suits my needs best?
The pricing options vary based on user requirements and access needs. Individual users may opt for single-user licenses, while businesses requiring broader access may choose multi-user or enterprise licenses for cost-effective access to the report.
13. Are there any additional resources or data provided in the Atopic Eczema Treatment Industry report?
While the report offers comprehensive insights, it's advisable to review the specific contents or supplementary materials provided to ascertain if additional resources or data are available.
14. How can I stay updated on further developments or reports in the Atopic Eczema Treatment Industry?
To stay informed about further developments, trends, and reports in the Atopic Eczema Treatment Industry, consider subscribing to industry newsletters, following relevant companies and organizations, or regularly checking reputable industry news sources and publications.
Methodology
Step 1 - Identification of Relevant Samples Size from Population Database


Step 2 - Approaches for Defining Global Market Size (Value, Volume* & Price*)

Note*: In applicable scenarios
Step 3 - Data Sources
Primary Research
- Web Analytics
- Survey Reports
- Research Institute
- Latest Research Reports
- Opinion Leaders
Secondary Research
- Annual Reports
- White Paper
- Latest Press Release
- Industry Association
- Paid Database
- Investor Presentations

Step 4 - Data Triangulation
Involves using different sources of information in order to increase the validity of a study
These sources are likely to be stakeholders in a program - participants, other researchers, program staff, other community members, and so on.
Then we put all data in single framework & apply various statistical tools to find out the dynamic on the market.
During the analysis stage, feedback from the stakeholder groups would be compared to determine areas of agreement as well as areas of divergence


