
Key Insights
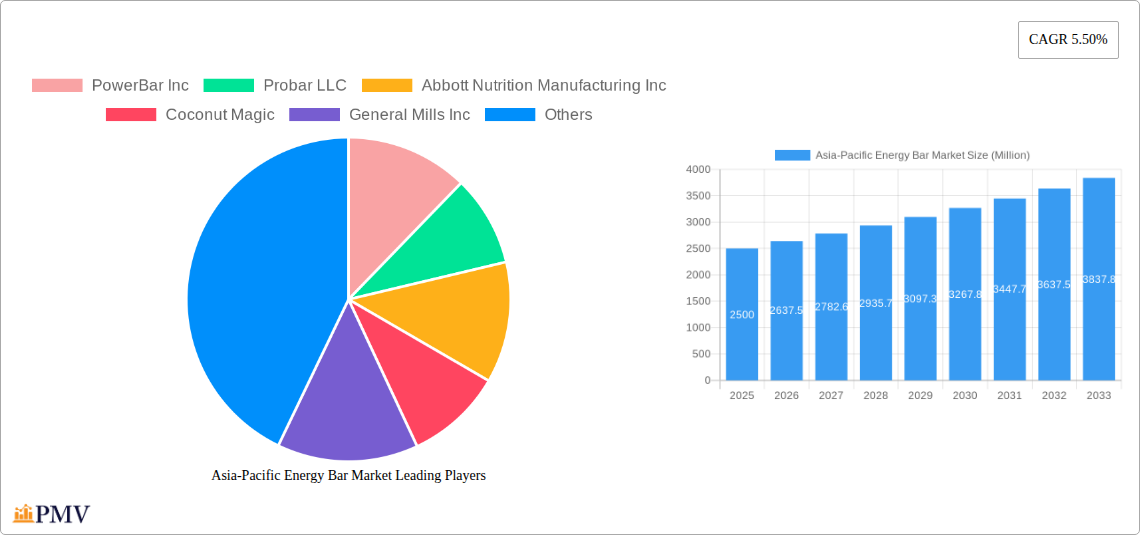
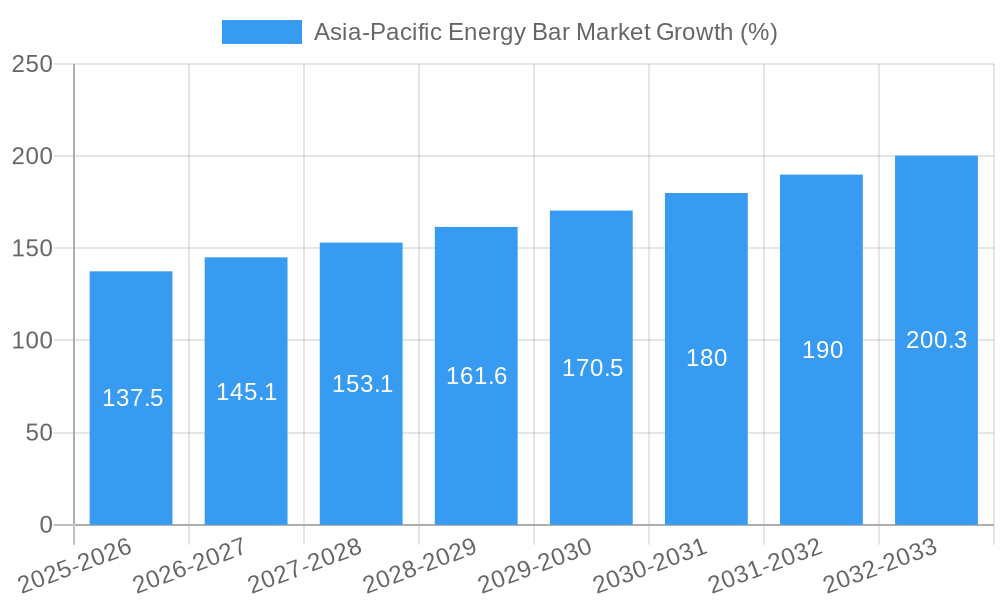
The Asia-Pacific energy bar market, valued at approximately $2.5 billion in 2025, is projected to experience robust growth, exhibiting a Compound Annual Growth Rate (CAGR) of 5.50% from 2025 to 2033. This expansion is fueled by several key factors. Firstly, the rising prevalence of health-conscious consumers seeking convenient and nutritious on-the-go snacks is significantly driving demand. The increasing adoption of active lifestyles, coupled with growing awareness of the importance of maintaining energy levels throughout the day, is further bolstering market growth. Secondly, the expanding middle class in key Asian countries like China, India, and Japan is contributing significantly to market expansion, as these consumers display a higher propensity to spend on premium and functional food products. Finally, innovative product launches featuring enhanced flavors, ingredients (such as organic and plant-based options), and functional benefits are attracting new consumers and driving market differentiation.
However, several challenges may hinder market growth. Price fluctuations in raw materials, such as nuts, seeds, and dried fruits, can impact production costs and profitability. Furthermore, intense competition from established players and the emergence of new entrants necessitates continuous innovation and strategic marketing efforts to maintain market share. Stringent regulatory frameworks related to food safety and labeling in certain countries also pose a potential barrier. Despite these challenges, the long-term outlook for the Asia-Pacific energy bar market remains optimistic, driven by continued consumer demand for healthy and convenient snacking options. The market segmentation by distribution channels reveals a diverse landscape, with supermarkets/hypermarkets currently holding a dominant position, though online retail stores are experiencing significant growth, demonstrating the evolving consumer shopping preferences within the region. Major players like PowerBar, Probar, Abbott Nutrition, and General Mills are actively investing in product development and expansion strategies to capitalize on the market opportunities.
This comprehensive report provides an in-depth analysis of the Asia-Pacific energy bar market, offering invaluable insights for stakeholders seeking to navigate this dynamic sector. The report covers the period 2019-2033, with a focus on the estimated year 2025 and a forecast period of 2025-2033. The historical period analyzed is 2019-2024. The market size is valued in Millions.
Asia-Pacific Energy Bar Market Market Structure & Competitive Dynamics
The Asia-Pacific energy bar market exhibits a moderately consolidated structure, with a handful of major players holding significant market share. However, a vibrant ecosystem of smaller, niche brands contributes to innovation and product differentiation. Market concentration is approximately xx%, with the top five players accounting for approximately xx Million in revenue in 2025. Regulatory frameworks vary across the region, impacting ingredient sourcing and labeling requirements. Significant product substitution exists from other convenient snack options, including protein shakes and granola bars. End-user trends are shifting towards healthier, more natural ingredients, driving product innovation. M&A activity has been moderate, with deal values averaging approximately xx Million per transaction in the past five years. Notable acquisitions include [Insert specific examples if available, otherwise state "no significant acquisitions reported"].
- Market Concentration: xx%
- Top 5 Players Revenue (2025): xx Million
- Average M&A Deal Value (past 5 years): xx Million
Asia-Pacific Energy Bar Market Industry Trends & Insights
The Asia-Pacific energy bar market is experiencing robust growth, driven by increasing health consciousness, rising disposable incomes, and changing lifestyles. The market registered a CAGR of xx% during the historical period (2019-2024) and is projected to grow at a CAGR of xx% during the forecast period (2025-2033). Technological disruptions, such as the adoption of advanced manufacturing techniques and improved packaging solutions, are enhancing production efficiency and product shelf life. Consumer preferences are shifting towards organic, gluten-free, and plant-based energy bars, creating new market segments. Intense competition necessitates continuous product innovation and effective marketing strategies to maintain market share. Market penetration is currently at approximately xx%, with significant untapped potential in less developed markets within the region.
Dominant Markets & Segments in Asia-Pacific Energy Bar Market
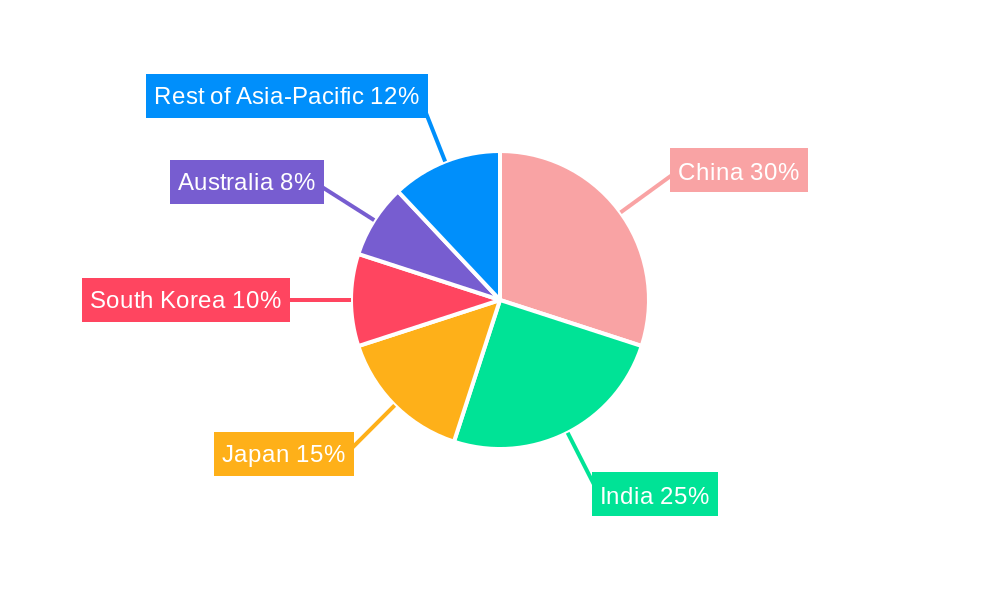
The [Specific country/region - e.g., China or Australia] market dominates the Asia-Pacific energy bar market, driven by factors such as a large and growing population, rising health awareness, and increased spending on convenient food products. The Supermarkets/Hypermarkets distribution channel holds the largest market share, followed by convenience stores and online retail stores.
- Key Drivers in Dominant Market:
- Large and growing consumer base.
- Increasing health consciousness and fitness trends.
- Robust retail infrastructure supporting distribution.
- Favorable government policies promoting healthy food consumption.
- Dominant Distribution Channel: Supermarkets/Hypermarkets - This channel benefits from established supply chains, wide consumer reach, and effective marketing capabilities. Convenience stores are also experiencing significant growth, driven by their accessibility and growing demand for on-the-go snacks. Online retail is showing strong growth potential, leveraging convenience and the broad reach of e-commerce platforms.
Asia-Pacific Energy Bar Market Product Innovations
Recent product innovations focus on incorporating functional ingredients, such as protein, fiber, and probiotics, to enhance nutritional value and cater to specific health needs. The introduction of innovative flavors and textures caters to evolving consumer preferences. Technological advancements in manufacturing processes have also led to improved product quality and shelf life. The market is witnessing a growing trend towards sustainable and ethically sourced ingredients.
Report Segmentation & Scope
The report segments the Asia-Pacific energy bar market by distribution channel:
- Supermarkets/Hypermarkets: This segment is characterized by high volume sales and strong competition. Growth is projected at xx% CAGR during the forecast period.
- Convenience Stores: This segment benefits from high accessibility and caters to the on-the-go consumer. Growth is projected at xx% CAGR.
- Specialty Stores: This segment focuses on niche products catering to specific dietary needs. Growth is projected at xx% CAGR.
- Online Retail Stores: This rapidly expanding segment leverages e-commerce platforms for convenient access. Growth is projected at xx% CAGR.
- Other Distribution Channels: This segment includes smaller retailers and direct-to-consumer sales. Growth is projected at xx% CAGR.
Key Drivers of Asia-Pacific Energy Bar Market Growth
Key growth drivers include: increasing health consciousness among consumers, rising disposable incomes leading to higher spending on convenient and healthy food options, and the growing popularity of fitness and wellness lifestyles. Government initiatives promoting healthy eating habits further contribute to market expansion. Technological advancements in production and packaging enhance efficiency and product quality.
Challenges in the Asia-Pacific Energy Bar Market Sector
Challenges include maintaining supply chain efficiency in the face of potential disruptions, navigating diverse regulatory frameworks across the region, and managing intense competition from established and emerging brands. Fluctuations in raw material prices and consumer preference changes also pose significant challenges. The market faces the challenge of overcoming the perception of energy bars as a less healthy alternative to whole foods.
Leading Players in the Asia-Pacific Energy Bar Market Market
- PowerBar Inc
- Probar LLC
- Abbott Nutrition Manufacturing Inc
- Coconut Magic
- General Mills Inc
- NuGo Nutrition
- Kellogg NA Co
- Clif Bar & Company
Key Developments in Asia-Pacific Energy Bar Market Sector
- February 2022: An India-based Yoga bar brand launched new mixes, 'Yo Chos' and 'Yo Fills', expanding into the kids' nutrition segment. This illustrates the market's responsiveness to diversifying consumer demands.
Strategic Asia-Pacific Energy Bar Market Market Outlook
The Asia-Pacific energy bar market presents substantial growth opportunities for both established and emerging players. Strategic initiatives focused on product innovation, leveraging e-commerce channels, and expanding into underserved markets will be crucial for success. Meeting growing consumer demand for healthier and more sustainable products will also be key to capturing market share. Focus on regional preferences and tailoring products accordingly will be crucial for optimal growth.
Asia-Pacific Energy Bar Market Segmentation
-
1. Distribution Channel
- 1.1. Supermarkets/Hypermarkets
- 1.2. Convenience Stores
- 1.3. Speciality Stores
- 1.4. Online Retail Stores
- 1.5. Other Distribution Channels
-
2. Geography
-
2.1. Asia Pacific
- 2.1.1. China
- 2.1.2. Japan
- 2.1.3. India
- 2.1.4. Australia
- 2.1.5. Rest of Asia-Pacific
-
2.1. Asia Pacific
Asia-Pacific Energy Bar Market Segmentation By Geography
-
1. Asia Pacific
- 1.1. China
- 1.2. Japan
- 1.3. India
- 1.4. Australia
- 1.5. Rest of Asia Pacific
Asia-Pacific Energy Bar Market REPORT HIGHLIGHTS
| Aspects | Details |
|---|---|
| Study Period | 2019-2033 |
| Base Year | 2024 |
| Estimated Year | 2025 |
| Forecast Period | 2025-2033 |
| Historical Period | 2019-2024 |
| Growth Rate | CAGR of 5.50% from 2019-2033 |
| Segmentation |
|
Table of Contents
- 1. Introduction
- 1.1. Research Scope
- 1.2. Market Segmentation
- 1.3. Research Methodology
- 1.4. Definitions and Assumptions
- 2. Executive Summary
- 2.1. Introduction
- 3. Market Dynamics
- 3.1. Introduction
- 3.2. Market Drivers
- 3.2.1. Rising Health Consciousness among consumer
- 3.3. Market Restrains
- 3.3.1. High Cost of natural Ingredients
- 3.4. Market Trends
- 3.4.1. Australia Dominating the Energy Bar Market
- 4. Market Factor Analysis
- 4.1. Porters Five Forces
- 4.2. Supply/Value Chain
- 4.3. PESTEL analysis
- 4.4. Market Entropy
- 4.5. Patent/Trademark Analysis
- 5. Asia-Pacific Energy Bar Market Analysis, Insights and Forecast, 2019-2031
- 5.1. Market Analysis, Insights and Forecast - by Distribution Channel
- 5.1.1. Supermarkets/Hypermarkets
- 5.1.2. Convenience Stores
- 5.1.3. Speciality Stores
- 5.1.4. Online Retail Stores
- 5.1.5. Other Distribution Channels
- 5.2. Market Analysis, Insights and Forecast - by Geography
- 5.2.1. Asia Pacific
- 5.2.1.1. China
- 5.2.1.2. Japan
- 5.2.1.3. India
- 5.2.1.4. Australia
- 5.2.1.5. Rest of Asia-Pacific
- 5.2.1. Asia Pacific
- 5.3. Market Analysis, Insights and Forecast - by Region
- 5.3.1. Asia Pacific
- 5.1. Market Analysis, Insights and Forecast - by Distribution Channel
- 6. China Asia-Pacific Energy Bar Market Analysis, Insights and Forecast, 2019-2031
- 7. Japan Asia-Pacific Energy Bar Market Analysis, Insights and Forecast, 2019-2031
- 8. India Asia-Pacific Energy Bar Market Analysis, Insights and Forecast, 2019-2031
- 9. South Korea Asia-Pacific Energy Bar Market Analysis, Insights and Forecast, 2019-2031
- 10. Taiwan Asia-Pacific Energy Bar Market Analysis, Insights and Forecast, 2019-2031
- 11. Australia Asia-Pacific Energy Bar Market Analysis, Insights and Forecast, 2019-2031
- 12. Rest of Asia-Pacific Asia-Pacific Energy Bar Market Analysis, Insights and Forecast, 2019-2031
- 13. Competitive Analysis
- 13.1. Market Share Analysis 2024
- 13.2. Company Profiles
- 13.2.1 PowerBar Inc
- 13.2.1.1. Overview
- 13.2.1.2. Products
- 13.2.1.3. SWOT Analysis
- 13.2.1.4. Recent Developments
- 13.2.1.5. Financials (Based on Availability)
- 13.2.2 Probar LLC
- 13.2.2.1. Overview
- 13.2.2.2. Products
- 13.2.2.3. SWOT Analysis
- 13.2.2.4. Recent Developments
- 13.2.2.5. Financials (Based on Availability)
- 13.2.3 Abbott Nutrition Manufacturing Inc
- 13.2.3.1. Overview
- 13.2.3.2. Products
- 13.2.3.3. SWOT Analysis
- 13.2.3.4. Recent Developments
- 13.2.3.5. Financials (Based on Availability)
- 13.2.4 Coconut Magic
- 13.2.4.1. Overview
- 13.2.4.2. Products
- 13.2.4.3. SWOT Analysis
- 13.2.4.4. Recent Developments
- 13.2.4.5. Financials (Based on Availability)
- 13.2.5 General Mills Inc
- 13.2.5.1. Overview
- 13.2.5.2. Products
- 13.2.5.3. SWOT Analysis
- 13.2.5.4. Recent Developments
- 13.2.5.5. Financials (Based on Availability)
- 13.2.6 NuGo Nutrition*List Not Exhaustive
- 13.2.6.1. Overview
- 13.2.6.2. Products
- 13.2.6.3. SWOT Analysis
- 13.2.6.4. Recent Developments
- 13.2.6.5. Financials (Based on Availability)
- 13.2.7 Kellogg NA Co
- 13.2.7.1. Overview
- 13.2.7.2. Products
- 13.2.7.3. SWOT Analysis
- 13.2.7.4. Recent Developments
- 13.2.7.5. Financials (Based on Availability)
- 13.2.8 Clif Bar & Company
- 13.2.8.1. Overview
- 13.2.8.2. Products
- 13.2.8.3. SWOT Analysis
- 13.2.8.4. Recent Developments
- 13.2.8.5. Financials (Based on Availability)
- 13.2.1 PowerBar Inc
List of Figures
- Figure 1: Asia-Pacific Energy Bar Market Revenue Breakdown (Million, %) by Product 2024 & 2032
- Figure 2: Asia-Pacific Energy Bar Market Share (%) by Company 2024
List of Tables
- Table 1: Asia-Pacific Energy Bar Market Revenue Million Forecast, by Region 2019 & 2032
- Table 2: Asia-Pacific Energy Bar Market Revenue Million Forecast, by Distribution Channel 2019 & 2032
- Table 3: Asia-Pacific Energy Bar Market Revenue Million Forecast, by Geography 2019 & 2032
- Table 4: Asia-Pacific Energy Bar Market Revenue Million Forecast, by Region 2019 & 2032
- Table 5: Asia-Pacific Energy Bar Market Revenue Million Forecast, by Country 2019 & 2032
- Table 6: China Asia-Pacific Energy Bar Market Revenue (Million) Forecast, by Application 2019 & 2032
- Table 7: Japan Asia-Pacific Energy Bar Market Revenue (Million) Forecast, by Application 2019 & 2032
- Table 8: India Asia-Pacific Energy Bar Market Revenue (Million) Forecast, by Application 2019 & 2032
- Table 9: South Korea Asia-Pacific Energy Bar Market Revenue (Million) Forecast, by Application 2019 & 2032
- Table 10: Taiwan Asia-Pacific Energy Bar Market Revenue (Million) Forecast, by Application 2019 & 2032
- Table 11: Australia Asia-Pacific Energy Bar Market Revenue (Million) Forecast, by Application 2019 & 2032
- Table 12: Rest of Asia-Pacific Asia-Pacific Energy Bar Market Revenue (Million) Forecast, by Application 2019 & 2032
- Table 13: Asia-Pacific Energy Bar Market Revenue Million Forecast, by Distribution Channel 2019 & 2032
- Table 14: Asia-Pacific Energy Bar Market Revenue Million Forecast, by Geography 2019 & 2032
- Table 15: Asia-Pacific Energy Bar Market Revenue Million Forecast, by Country 2019 & 2032
- Table 16: China Asia-Pacific Energy Bar Market Revenue (Million) Forecast, by Application 2019 & 2032
- Table 17: Japan Asia-Pacific Energy Bar Market Revenue (Million) Forecast, by Application 2019 & 2032
- Table 18: India Asia-Pacific Energy Bar Market Revenue (Million) Forecast, by Application 2019 & 2032
- Table 19: Australia Asia-Pacific Energy Bar Market Revenue (Million) Forecast, by Application 2019 & 2032
- Table 20: Rest of Asia Pacific Asia-Pacific Energy Bar Market Revenue (Million) Forecast, by Application 2019 & 2032
Frequently Asked Questions
1. What is the projected Compound Annual Growth Rate (CAGR) of the Asia-Pacific Energy Bar Market?
The projected CAGR is approximately 5.50%.
2. Which companies are prominent players in the Asia-Pacific Energy Bar Market?
Key companies in the market include PowerBar Inc, Probar LLC, Abbott Nutrition Manufacturing Inc, Coconut Magic, General Mills Inc, NuGo Nutrition*List Not Exhaustive, Kellogg NA Co, Clif Bar & Company.
3. What are the main segments of the Asia-Pacific Energy Bar Market?
The market segments include Distribution Channel, Geography.
4. Can you provide details about the market size?
The market size is estimated to be USD XX Million as of 2022.
5. What are some drivers contributing to market growth?
Rising Health Consciousness among consumer.
6. What are the notable trends driving market growth?
Australia Dominating the Energy Bar Market.
7. Are there any restraints impacting market growth?
High Cost of natural Ingredients.
8. Can you provide examples of recent developments in the market?
In February 2022, the India-based Yoga bar brand extended its product category into kids' nutrition with the launch of new mixes 'Yo Chos' and 'Yo Fills'.
9. What pricing options are available for accessing the report?
Pricing options include single-user, multi-user, and enterprise licenses priced at USD 4750, USD 5250, and USD 8750 respectively.
10. Is the market size provided in terms of value or volume?
The market size is provided in terms of value, measured in Million.
11. Are there any specific market keywords associated with the report?
Yes, the market keyword associated with the report is "Asia-Pacific Energy Bar Market," which aids in identifying and referencing the specific market segment covered.
12. How do I determine which pricing option suits my needs best?
The pricing options vary based on user requirements and access needs. Individual users may opt for single-user licenses, while businesses requiring broader access may choose multi-user or enterprise licenses for cost-effective access to the report.
13. Are there any additional resources or data provided in the Asia-Pacific Energy Bar Market report?
While the report offers comprehensive insights, it's advisable to review the specific contents or supplementary materials provided to ascertain if additional resources or data are available.
14. How can I stay updated on further developments or reports in the Asia-Pacific Energy Bar Market?
To stay informed about further developments, trends, and reports in the Asia-Pacific Energy Bar Market, consider subscribing to industry newsletters, following relevant companies and organizations, or regularly checking reputable industry news sources and publications.
Methodology
Step 1 - Identification of Relevant Samples Size from Population Database


Step 2 - Approaches for Defining Global Market Size (Value, Volume* & Price*)

Note*: In applicable scenarios
Step 3 - Data Sources
Primary Research
- Web Analytics
- Survey Reports
- Research Institute
- Latest Research Reports
- Opinion Leaders
Secondary Research
- Annual Reports
- White Paper
- Latest Press Release
- Industry Association
- Paid Database
- Investor Presentations

Step 4 - Data Triangulation
Involves using different sources of information in order to increase the validity of a study
These sources are likely to be stakeholders in a program - participants, other researchers, program staff, other community members, and so on.
Then we put all data in single framework & apply various statistical tools to find out the dynamic on the market.
During the analysis stage, feedback from the stakeholder groups would be compared to determine areas of agreement as well as areas of divergence


