
Key Insights
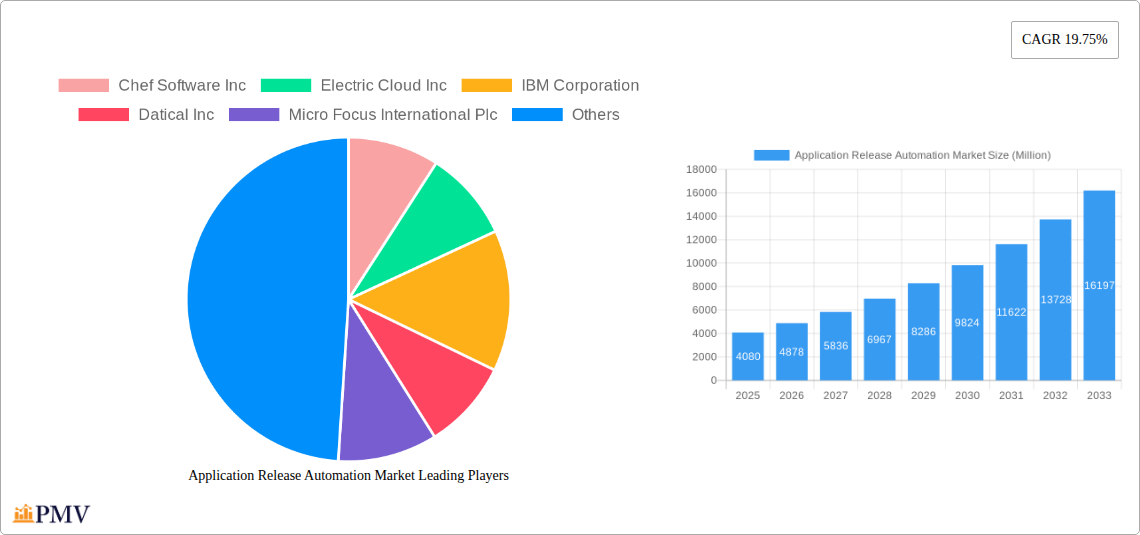
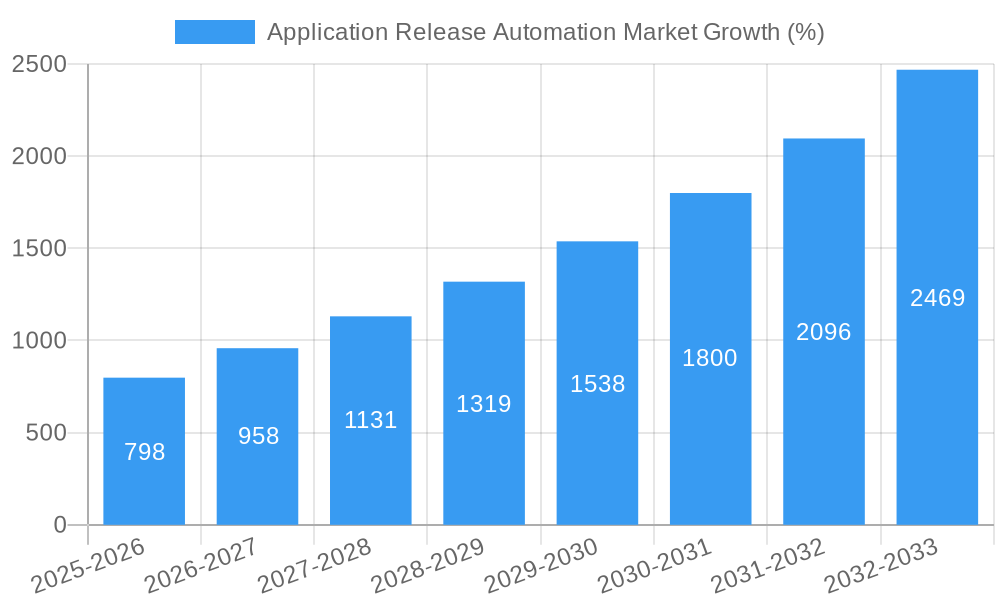
The Application Release Automation (ARA) market is experiencing robust growth, projected to reach $4.08 billion in 2025 and exhibiting a Compound Annual Growth Rate (CAGR) of 19.75% from 2025 to 2033. This expansion is fueled by several key drivers. The increasing complexity of software applications and the rising frequency of releases necessitate efficient and automated deployment processes. Businesses are increasingly adopting DevOps methodologies and Agile development practices, which inherently rely on ARA tools for faster, more reliable releases. Furthermore, the growing adoption of cloud computing and microservices architectures creates a significant demand for ARA solutions capable of managing complex deployment scenarios across diverse environments. The market segmentation reveals a strong preference for cloud-based deployments, reflecting the broader industry shift towards cloud-native architectures. Within end-user industries, BFSI (Banking, Financial Services, and Insurance), IT & Telecommunications, and Retail & E-commerce are leading the adoption, driven by the need for continuous innovation and rapid response to market changes. Competition is fierce, with established players like IBM, Microsoft, and Broadcom alongside specialized ARA vendors like Chef Software and Electric Cloud vying for market share. Continued innovation in areas such as AI-powered automation and enhanced security features will be critical for success in this rapidly evolving market.
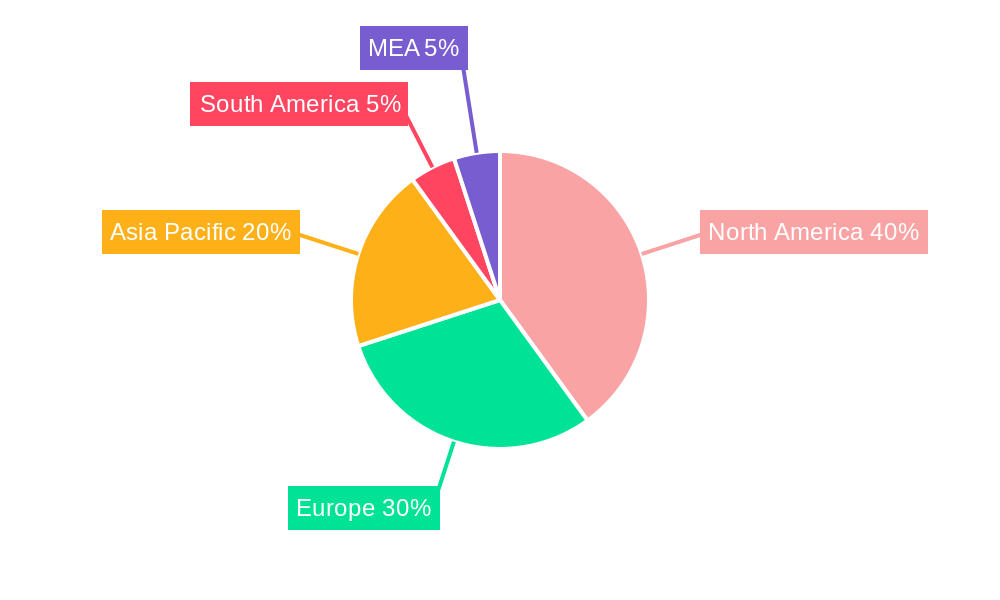
The geographic distribution of the ARA market is fairly diverse, with North America currently holding a significant share due to early adoption and a well-established technology infrastructure. However, Asia-Pacific is poised for significant growth, driven by increasing digitalization and the expansion of technology companies in regions like India and China. Europe will also continue to contribute significantly to the overall market growth, fueled by the adoption of ARA across various industries. The ongoing expansion of 5G networks and the Internet of Things (IoT) will further accelerate ARA adoption across all regions. The competitive landscape is expected to remain dynamic, with ongoing mergers and acquisitions, along with the emergence of innovative start-ups, shaping the future of the market. The focus on enhancing security and compliance within ARA solutions will be a key differentiator for vendors in the coming years.
Application Release Automation Market: A Comprehensive Report (2019-2033)
This detailed report provides a comprehensive analysis of the Application Release Automation (ARA) market, offering invaluable insights for stakeholders across the technology landscape. With a study period spanning 2019-2033, a base year of 2025, and a forecast period of 2025-2033, this report meticulously examines market trends, competitive dynamics, and future growth potential. The market is segmented by component (Tool, Services), deployment (Cloud, On-premises), and end-user industries (BFSI, IT & Telecommunications, Retail & E-commerce, Media & Entertainment, Others). Key players analyzed include Chef Software Inc, Electric Cloud Inc, IBM Corporation, Datical Inc, Micro Focus International Plc, CollabNet Inc, CloudBees Inc, Broadcom Inc, Microsoft Corporation, BMC Software Inc, Flexagon LLC, ARCAD Software, and Attunity Ltd. The report projects a market size of xx Million by 2033, with a CAGR of xx% during the forecast period.
Application Release Automation Market Market Structure & Competitive Dynamics
The Application Release Automation market exhibits a moderately concentrated structure, with a few major players holding significant market share. However, the presence of several niche players and emerging startups fosters a dynamic competitive landscape. Innovation ecosystems are thriving, driven by continuous advancements in DevOps methodologies and cloud technologies. Regulatory frameworks, particularly concerning data security and compliance, play a crucial role in shaping market practices. Product substitutes, while limited, include manual release processes and rudimentary scripting solutions. End-user trends favor automation and agility, pushing demand for robust ARA solutions.
M&A activity in the ARA market has been relatively steady, with deal values ranging from xx Million to xx Million in recent years. Notable acquisitions have focused on consolidating market share and expanding technological capabilities.
- Market Concentration: Moderately Concentrated
- Innovation Ecosystems: Thriving, driven by DevOps and cloud technologies
- Regulatory Frameworks: Significant impact on data security and compliance
- M&A Activity: Moderate, with deal values ranging from xx Million to xx Million. Examples include [Insert specific examples if available, otherwise use "Several strategic acquisitions aimed at expanding market reach and technological capabilities."]
- Market Share: Top 5 players hold approximately xx% of the market share. (These figures are estimates if specific data isn't available)
Application Release Automation Market Industry Trends & Insights
The Application Release Automation market is experiencing robust growth fueled by several key factors. The increasing adoption of DevOps methodologies across various industries is a primary driver, as organizations strive for faster and more frequent software releases. Cloud adoption is another significant catalyst, with cloud-native applications requiring efficient and automated release processes. Consumer preference for seamless digital experiences demands continuous software updates and feature enhancements, further boosting the market. The shift towards microservices architecture also contributes to the growth, as it necessitates efficient tools for managing numerous independent services. The competitive dynamics are characterized by innovation, strategic partnerships, and a focus on expanding into new markets and industries. The market is projected to reach xx Million by 2033, exhibiting a CAGR of xx%. Market penetration is increasing across all segments, with a particular focus on cloud-based solutions.
Dominant Markets & Segments in Application Release Automation Market
The North American region currently holds the dominant position in the Application Release Automation market, driven by high adoption rates in the IT and BFSI sectors. This dominance is attributable to factors such as advanced technological infrastructure, early adoption of DevOps practices, and a mature IT ecosystem. Europe follows as a significant market, experiencing steady growth.
- By Component: The Tools segment holds a larger market share compared to Services, with a predicted market size of xx Million in 2025. This is driven by the increasing demand for sophisticated ARA tools that enable efficient release management.
- By Deployment: The Cloud segment dominates, with a market size of xx Million in 2025, due to its scalability, flexibility, and cost-effectiveness. On-premises deployments still hold a significant share, particularly in industries with stringent security and compliance requirements.
- By End-User Industries: The IT & Telecommunications sector currently leads the market, followed closely by the BFSI sector. Retail & E-commerce is a rapidly growing segment, driven by the need for agile software deployments to meet consumer demands.
Key Drivers for Dominant Regions/Segments:
- North America: Strong IT infrastructure, early DevOps adoption, mature IT ecosystem.
- IT & Telecommunications: High software release frequency, continuous innovation demands.
- BFSI: Stringent regulatory compliance, need for secure and reliable systems.
- Cloud Deployment: Scalability, cost-effectiveness, flexibility.
Application Release Automation Market Product Innovations
Recent innovations in Application Release Automation focus on AI-powered automation, enhanced integration with DevOps toolchains, and improved security features. These advancements aim to simplify complex release processes, improve efficiency, and reduce risks. The market is witnessing the emergence of low-code/no-code platforms for ARA, making the technology accessible to a wider range of users. These innovations are well-aligned with market trends, offering significant competitive advantages to vendors who embrace them.
Report Segmentation & Scope
This report segments the Application Release Automation market comprehensively across various parameters.
By Component: The market is divided into Tool and Services segments, analyzing their respective growth trajectories and competitive landscapes. The Tool segment is expected to grow at a CAGR of xx%, driven by demand for sophisticated automation tools. The Services segment is projected to grow at a CAGR of xx%, driven by the increasing need for expert assistance in implementation and integration.
By Deployment: The market is categorized into Cloud and On-premises deployments, considering their differing characteristics and adoption rates. Cloud deployment is projected to experience faster growth (CAGR of xx%) compared to On-premises (CAGR of xx%).
By End-User Industries: The market is segmented by BFSI, IT & Telecommunications, Retail & E-commerce, Media & Entertainment, and Others. Each segment exhibits unique growth drivers and competitive dynamics.
Key Drivers of Application Release Automation Market Growth
Several factors drive the growth of the Application Release Automation market. The rising demand for faster and more frequent software releases is a primary factor. The increasing adoption of DevOps practices, fueled by the need for agility and faster time-to-market, is another significant driver. Furthermore, the proliferation of cloud-based applications necessitates efficient automation of deployment processes. Stringent regulatory compliance requirements also push organizations toward automating software releases to ensure accuracy and reliability.
Challenges in the Application Release Automation Market Sector
Despite substantial growth potential, several challenges impede the market's progress. Integration complexities with existing IT infrastructure can be a major hurdle for organizations. The need for skilled professionals to implement and manage ARA solutions presents another challenge. Moreover, security concerns associated with automated deployments necessitate robust security measures, increasing costs and complexity. The high initial investment cost for implementing ARA solutions can be a barrier to entry for smaller organizations.
Leading Players in the Application Release Automation Market Market
- Chef Software Inc
- Electric Cloud Inc
- IBM Corporation
- Datical Inc
- Micro Focus International Plc
- CollabNet Inc
- CloudBees Inc
- Broadcom Inc
- Microsoft Corporation
- BMC Software Inc
- Flexagon LLC
- ARCAD Software
- Attunity Ltd
Key Developments in Application Release Automation Market Sector
February 2023: Red Hat, Inc., announced the availability of the Red Hat Ansible Automation Platform on Google Cloud, expanding its reach and simplifying IT automation across hybrid environments. This development significantly impacts market dynamics by strengthening Red Hat's position in the cloud-based ARA market.
December 2022: Salesforce announced the general availability of its DevOps Center, accelerating the release of custom solutions within its platform. This boosts the market by providing a specialized ARA solution for Salesforce developers, streamlining deployment and improving collaboration.
Strategic Application Release Automation Market Market Outlook
The Application Release Automation market exhibits immense future potential, driven by the ongoing digital transformation across industries. The convergence of cloud technologies, AI/ML, and DevOps practices will continue to fuel innovation and growth. Strategic opportunities lie in developing specialized ARA solutions for niche industries, offering comprehensive integration with existing toolchains, and enhancing security features to address evolving cyber threats. The market is poised for sustained expansion, with a focus on simplifying deployment processes and enhancing operational efficiency.
Application Release Automation Market Segmentation
-
1. Component
- 1.1. Tool
- 1.2. Services
-
2. Deployment
- 2.1. Cloud
- 2.2. On-Premises
-
3. End-User Industries
- 3.1. BFSI
- 3.2. IT & Telecommunications
- 3.3. Retail & E-commerce
- 3.4. Media & Entertainment
- 3.5. Others End-User Industries
Application Release Automation Market Segmentation By Geography
- 1. North America
- 2. Europe
- 3. Asia Pacific
- 4. Rest of the World
Application Release Automation Market REPORT HIGHLIGHTS
| Aspects | Details |
|---|---|
| Study Period | 2019-2033 |
| Base Year | 2024 |
| Estimated Year | 2025 |
| Forecast Period | 2025-2033 |
| Historical Period | 2019-2024 |
| Growth Rate | CAGR of 19.75% from 2019-2033 |
| Segmentation |
|
Table of Contents
- 1. Introduction
- 1.1. Research Scope
- 1.2. Market Segmentation
- 1.3. Research Methodology
- 1.4. Definitions and Assumptions
- 2. Executive Summary
- 2.1. Introduction
- 3. Market Dynamics
- 3.1. Introduction
- 3.2. Market Drivers
- 3.2.1. On Increasing Demand of Faster Delivery of Software with Reduced Operational Risk; Rapid Adoption by Enterprise to Deliver Differentiated Customer Experiences and to Retain
- 3.3. Market Restrains
- 3.3.1. High Cost of Product and Failed Deployment of Software or Applications and Complexity in Configurations
- 3.4. Market Trends
- 3.4.1. Cloud is Expected to Hold Significant Market Share
- 4. Market Factor Analysis
- 4.1. Porters Five Forces
- 4.2. Supply/Value Chain
- 4.3. PESTEL analysis
- 4.4. Market Entropy
- 4.5. Patent/Trademark Analysis
- 5. Global Application Release Automation Market Analysis, Insights and Forecast, 2019-2031
- 5.1. Market Analysis, Insights and Forecast - by Component
- 5.1.1. Tool
- 5.1.2. Services
- 5.2. Market Analysis, Insights and Forecast - by Deployment
- 5.2.1. Cloud
- 5.2.2. On-Premises
- 5.3. Market Analysis, Insights and Forecast - by End-User Industries
- 5.3.1. BFSI
- 5.3.2. IT & Telecommunications
- 5.3.3. Retail & E-commerce
- 5.3.4. Media & Entertainment
- 5.3.5. Others End-User Industries
- 5.4. Market Analysis, Insights and Forecast - by Region
- 5.4.1. North America
- 5.4.2. Europe
- 5.4.3. Asia Pacific
- 5.4.4. Rest of the World
- 5.1. Market Analysis, Insights and Forecast - by Component
- 6. North America Application Release Automation Market Analysis, Insights and Forecast, 2019-2031
- 6.1. Market Analysis, Insights and Forecast - by Component
- 6.1.1. Tool
- 6.1.2. Services
- 6.2. Market Analysis, Insights and Forecast - by Deployment
- 6.2.1. Cloud
- 6.2.2. On-Premises
- 6.3. Market Analysis, Insights and Forecast - by End-User Industries
- 6.3.1. BFSI
- 6.3.2. IT & Telecommunications
- 6.3.3. Retail & E-commerce
- 6.3.4. Media & Entertainment
- 6.3.5. Others End-User Industries
- 6.1. Market Analysis, Insights and Forecast - by Component
- 7. Europe Application Release Automation Market Analysis, Insights and Forecast, 2019-2031
- 7.1. Market Analysis, Insights and Forecast - by Component
- 7.1.1. Tool
- 7.1.2. Services
- 7.2. Market Analysis, Insights and Forecast - by Deployment
- 7.2.1. Cloud
- 7.2.2. On-Premises
- 7.3. Market Analysis, Insights and Forecast - by End-User Industries
- 7.3.1. BFSI
- 7.3.2. IT & Telecommunications
- 7.3.3. Retail & E-commerce
- 7.3.4. Media & Entertainment
- 7.3.5. Others End-User Industries
- 7.1. Market Analysis, Insights and Forecast - by Component
- 8. Asia Pacific Application Release Automation Market Analysis, Insights and Forecast, 2019-2031
- 8.1. Market Analysis, Insights and Forecast - by Component
- 8.1.1. Tool
- 8.1.2. Services
- 8.2. Market Analysis, Insights and Forecast - by Deployment
- 8.2.1. Cloud
- 8.2.2. On-Premises
- 8.3. Market Analysis, Insights and Forecast - by End-User Industries
- 8.3.1. BFSI
- 8.3.2. IT & Telecommunications
- 8.3.3. Retail & E-commerce
- 8.3.4. Media & Entertainment
- 8.3.5. Others End-User Industries
- 8.1. Market Analysis, Insights and Forecast - by Component
- 9. Rest of the World Application Release Automation Market Analysis, Insights and Forecast, 2019-2031
- 9.1. Market Analysis, Insights and Forecast - by Component
- 9.1.1. Tool
- 9.1.2. Services
- 9.2. Market Analysis, Insights and Forecast - by Deployment
- 9.2.1. Cloud
- 9.2.2. On-Premises
- 9.3. Market Analysis, Insights and Forecast - by End-User Industries
- 9.3.1. BFSI
- 9.3.2. IT & Telecommunications
- 9.3.3. Retail & E-commerce
- 9.3.4. Media & Entertainment
- 9.3.5. Others End-User Industries
- 9.1. Market Analysis, Insights and Forecast - by Component
- 10. North America Application Release Automation Market Analysis, Insights and Forecast, 2019-2031
- 10.1. Market Analysis, Insights and Forecast - By Country/Sub-region
- 10.1.1 United States
- 10.1.2 Canada
- 10.1.3 Mexico
- 11. Europe Application Release Automation Market Analysis, Insights and Forecast, 2019-2031
- 11.1. Market Analysis, Insights and Forecast - By Country/Sub-region
- 11.1.1 Germany
- 11.1.2 United Kingdom
- 11.1.3 France
- 11.1.4 Spain
- 11.1.5 Italy
- 11.1.6 Spain
- 11.1.7 Belgium
- 11.1.8 Netherland
- 11.1.9 Nordics
- 11.1.10 Rest of Europe
- 12. Asia Pacific Application Release Automation Market Analysis, Insights and Forecast, 2019-2031
- 12.1. Market Analysis, Insights and Forecast - By Country/Sub-region
- 12.1.1 China
- 12.1.2 Japan
- 12.1.3 India
- 12.1.4 South Korea
- 12.1.5 Southeast Asia
- 12.1.6 Australia
- 12.1.7 Indonesia
- 12.1.8 Phillipes
- 12.1.9 Singapore
- 12.1.10 Thailandc
- 12.1.11 Rest of Asia Pacific
- 13. South America Application Release Automation Market Analysis, Insights and Forecast, 2019-2031
- 13.1. Market Analysis, Insights and Forecast - By Country/Sub-region
- 13.1.1 Brazil
- 13.1.2 Argentina
- 13.1.3 Peru
- 13.1.4 Chile
- 13.1.5 Colombia
- 13.1.6 Ecuador
- 13.1.7 Venezuela
- 13.1.8 Rest of South America
- 14. North America Application Release Automation Market Analysis, Insights and Forecast, 2019-2031
- 14.1. Market Analysis, Insights and Forecast - By Country/Sub-region
- 14.1.1 United States
- 14.1.2 Canada
- 14.1.3 Mexico
- 15. MEA Application Release Automation Market Analysis, Insights and Forecast, 2019-2031
- 15.1. Market Analysis, Insights and Forecast - By Country/Sub-region
- 15.1.1 United Arab Emirates
- 15.1.2 Saudi Arabia
- 15.1.3 South Africa
- 15.1.4 Rest of Middle East and Africa
- 16. Competitive Analysis
- 16.1. Global Market Share Analysis 2024
- 16.2. Company Profiles
- 16.2.1 Chef Software Inc
- 16.2.1.1. Overview
- 16.2.1.2. Products
- 16.2.1.3. SWOT Analysis
- 16.2.1.4. Recent Developments
- 16.2.1.5. Financials (Based on Availability)
- 16.2.2 Electric Cloud Inc
- 16.2.2.1. Overview
- 16.2.2.2. Products
- 16.2.2.3. SWOT Analysis
- 16.2.2.4. Recent Developments
- 16.2.2.5. Financials (Based on Availability)
- 16.2.3 IBM Corporation
- 16.2.3.1. Overview
- 16.2.3.2. Products
- 16.2.3.3. SWOT Analysis
- 16.2.3.4. Recent Developments
- 16.2.3.5. Financials (Based on Availability)
- 16.2.4 Datical Inc
- 16.2.4.1. Overview
- 16.2.4.2. Products
- 16.2.4.3. SWOT Analysis
- 16.2.4.4. Recent Developments
- 16.2.4.5. Financials (Based on Availability)
- 16.2.5 Micro Focus International Plc
- 16.2.5.1. Overview
- 16.2.5.2. Products
- 16.2.5.3. SWOT Analysis
- 16.2.5.4. Recent Developments
- 16.2.5.5. Financials (Based on Availability)
- 16.2.6 CollabNet Inc
- 16.2.6.1. Overview
- 16.2.6.2. Products
- 16.2.6.3. SWOT Analysis
- 16.2.6.4. Recent Developments
- 16.2.6.5. Financials (Based on Availability)
- 16.2.7 CloudBees Inc
- 16.2.7.1. Overview
- 16.2.7.2. Products
- 16.2.7.3. SWOT Analysis
- 16.2.7.4. Recent Developments
- 16.2.7.5. Financials (Based on Availability)
- 16.2.8 Broadcom Inc
- 16.2.8.1. Overview
- 16.2.8.2. Products
- 16.2.8.3. SWOT Analysis
- 16.2.8.4. Recent Developments
- 16.2.8.5. Financials (Based on Availability)
- 16.2.9 Microsoft Corporation
- 16.2.9.1. Overview
- 16.2.9.2. Products
- 16.2.9.3. SWOT Analysis
- 16.2.9.4. Recent Developments
- 16.2.9.5. Financials (Based on Availability)
- 16.2.10 BMC Software Inc
- 16.2.10.1. Overview
- 16.2.10.2. Products
- 16.2.10.3. SWOT Analysis
- 16.2.10.4. Recent Developments
- 16.2.10.5. Financials (Based on Availability)
- 16.2.11 Flexagon LLC
- 16.2.11.1. Overview
- 16.2.11.2. Products
- 16.2.11.3. SWOT Analysis
- 16.2.11.4. Recent Developments
- 16.2.11.5. Financials (Based on Availability)
- 16.2.12 ARCAD Software
- 16.2.12.1. Overview
- 16.2.12.2. Products
- 16.2.12.3. SWOT Analysis
- 16.2.12.4. Recent Developments
- 16.2.12.5. Financials (Based on Availability)
- 16.2.13 Attunity Ltd
- 16.2.13.1. Overview
- 16.2.13.2. Products
- 16.2.13.3. SWOT Analysis
- 16.2.13.4. Recent Developments
- 16.2.13.5. Financials (Based on Availability)
- 16.2.1 Chef Software Inc
List of Figures
- Figure 1: Global Application Release Automation Market Revenue Breakdown (Million, %) by Region 2024 & 2032
- Figure 2: North America Application Release Automation Market Revenue (Million), by Country 2024 & 2032
- Figure 3: North America Application Release Automation Market Revenue Share (%), by Country 2024 & 2032
- Figure 4: Europe Application Release Automation Market Revenue (Million), by Country 2024 & 2032
- Figure 5: Europe Application Release Automation Market Revenue Share (%), by Country 2024 & 2032
- Figure 6: Asia Pacific Application Release Automation Market Revenue (Million), by Country 2024 & 2032
- Figure 7: Asia Pacific Application Release Automation Market Revenue Share (%), by Country 2024 & 2032
- Figure 8: South America Application Release Automation Market Revenue (Million), by Country 2024 & 2032
- Figure 9: South America Application Release Automation Market Revenue Share (%), by Country 2024 & 2032
- Figure 10: North America Application Release Automation Market Revenue (Million), by Country 2024 & 2032
- Figure 11: North America Application Release Automation Market Revenue Share (%), by Country 2024 & 2032
- Figure 12: MEA Application Release Automation Market Revenue (Million), by Country 2024 & 2032
- Figure 13: MEA Application Release Automation Market Revenue Share (%), by Country 2024 & 2032
- Figure 14: North America Application Release Automation Market Revenue (Million), by Component 2024 & 2032
- Figure 15: North America Application Release Automation Market Revenue Share (%), by Component 2024 & 2032
- Figure 16: North America Application Release Automation Market Revenue (Million), by Deployment 2024 & 2032
- Figure 17: North America Application Release Automation Market Revenue Share (%), by Deployment 2024 & 2032
- Figure 18: North America Application Release Automation Market Revenue (Million), by End-User Industries 2024 & 2032
- Figure 19: North America Application Release Automation Market Revenue Share (%), by End-User Industries 2024 & 2032
- Figure 20: North America Application Release Automation Market Revenue (Million), by Country 2024 & 2032
- Figure 21: North America Application Release Automation Market Revenue Share (%), by Country 2024 & 2032
- Figure 22: Europe Application Release Automation Market Revenue (Million), by Component 2024 & 2032
- Figure 23: Europe Application Release Automation Market Revenue Share (%), by Component 2024 & 2032
- Figure 24: Europe Application Release Automation Market Revenue (Million), by Deployment 2024 & 2032
- Figure 25: Europe Application Release Automation Market Revenue Share (%), by Deployment 2024 & 2032
- Figure 26: Europe Application Release Automation Market Revenue (Million), by End-User Industries 2024 & 2032
- Figure 27: Europe Application Release Automation Market Revenue Share (%), by End-User Industries 2024 & 2032
- Figure 28: Europe Application Release Automation Market Revenue (Million), by Country 2024 & 2032
- Figure 29: Europe Application Release Automation Market Revenue Share (%), by Country 2024 & 2032
- Figure 30: Asia Pacific Application Release Automation Market Revenue (Million), by Component 2024 & 2032
- Figure 31: Asia Pacific Application Release Automation Market Revenue Share (%), by Component 2024 & 2032
- Figure 32: Asia Pacific Application Release Automation Market Revenue (Million), by Deployment 2024 & 2032
- Figure 33: Asia Pacific Application Release Automation Market Revenue Share (%), by Deployment 2024 & 2032
- Figure 34: Asia Pacific Application Release Automation Market Revenue (Million), by End-User Industries 2024 & 2032
- Figure 35: Asia Pacific Application Release Automation Market Revenue Share (%), by End-User Industries 2024 & 2032
- Figure 36: Asia Pacific Application Release Automation Market Revenue (Million), by Country 2024 & 2032
- Figure 37: Asia Pacific Application Release Automation Market Revenue Share (%), by Country 2024 & 2032
- Figure 38: Rest of the World Application Release Automation Market Revenue (Million), by Component 2024 & 2032
- Figure 39: Rest of the World Application Release Automation Market Revenue Share (%), by Component 2024 & 2032
- Figure 40: Rest of the World Application Release Automation Market Revenue (Million), by Deployment 2024 & 2032
- Figure 41: Rest of the World Application Release Automation Market Revenue Share (%), by Deployment 2024 & 2032
- Figure 42: Rest of the World Application Release Automation Market Revenue (Million), by End-User Industries 2024 & 2032
- Figure 43: Rest of the World Application Release Automation Market Revenue Share (%), by End-User Industries 2024 & 2032
- Figure 44: Rest of the World Application Release Automation Market Revenue (Million), by Country 2024 & 2032
- Figure 45: Rest of the World Application Release Automation Market Revenue Share (%), by Country 2024 & 2032
List of Tables
- Table 1: Global Application Release Automation Market Revenue Million Forecast, by Region 2019 & 2032
- Table 2: Global Application Release Automation Market Revenue Million Forecast, by Component 2019 & 2032
- Table 3: Global Application Release Automation Market Revenue Million Forecast, by Deployment 2019 & 2032
- Table 4: Global Application Release Automation Market Revenue Million Forecast, by End-User Industries 2019 & 2032
- Table 5: Global Application Release Automation Market Revenue Million Forecast, by Region 2019 & 2032
- Table 6: Global Application Release Automation Market Revenue Million Forecast, by Country 2019 & 2032
- Table 7: United States Application Release Automation Market Revenue (Million) Forecast, by Application 2019 & 2032
- Table 8: Canada Application Release Automation Market Revenue (Million) Forecast, by Application 2019 & 2032
- Table 9: Mexico Application Release Automation Market Revenue (Million) Forecast, by Application 2019 & 2032
- Table 10: Global Application Release Automation Market Revenue Million Forecast, by Country 2019 & 2032
- Table 11: Germany Application Release Automation Market Revenue (Million) Forecast, by Application 2019 & 2032
- Table 12: United Kingdom Application Release Automation Market Revenue (Million) Forecast, by Application 2019 & 2032
- Table 13: France Application Release Automation Market Revenue (Million) Forecast, by Application 2019 & 2032
- Table 14: Spain Application Release Automation Market Revenue (Million) Forecast, by Application 2019 & 2032
- Table 15: Italy Application Release Automation Market Revenue (Million) Forecast, by Application 2019 & 2032
- Table 16: Spain Application Release Automation Market Revenue (Million) Forecast, by Application 2019 & 2032
- Table 17: Belgium Application Release Automation Market Revenue (Million) Forecast, by Application 2019 & 2032
- Table 18: Netherland Application Release Automation Market Revenue (Million) Forecast, by Application 2019 & 2032
- Table 19: Nordics Application Release Automation Market Revenue (Million) Forecast, by Application 2019 & 2032
- Table 20: Rest of Europe Application Release Automation Market Revenue (Million) Forecast, by Application 2019 & 2032
- Table 21: Global Application Release Automation Market Revenue Million Forecast, by Country 2019 & 2032
- Table 22: China Application Release Automation Market Revenue (Million) Forecast, by Application 2019 & 2032
- Table 23: Japan Application Release Automation Market Revenue (Million) Forecast, by Application 2019 & 2032
- Table 24: India Application Release Automation Market Revenue (Million) Forecast, by Application 2019 & 2032
- Table 25: South Korea Application Release Automation Market Revenue (Million) Forecast, by Application 2019 & 2032
- Table 26: Southeast Asia Application Release Automation Market Revenue (Million) Forecast, by Application 2019 & 2032
- Table 27: Australia Application Release Automation Market Revenue (Million) Forecast, by Application 2019 & 2032
- Table 28: Indonesia Application Release Automation Market Revenue (Million) Forecast, by Application 2019 & 2032
- Table 29: Phillipes Application Release Automation Market Revenue (Million) Forecast, by Application 2019 & 2032
- Table 30: Singapore Application Release Automation Market Revenue (Million) Forecast, by Application 2019 & 2032
- Table 31: Thailandc Application Release Automation Market Revenue (Million) Forecast, by Application 2019 & 2032
- Table 32: Rest of Asia Pacific Application Release Automation Market Revenue (Million) Forecast, by Application 2019 & 2032
- Table 33: Global Application Release Automation Market Revenue Million Forecast, by Country 2019 & 2032
- Table 34: Brazil Application Release Automation Market Revenue (Million) Forecast, by Application 2019 & 2032
- Table 35: Argentina Application Release Automation Market Revenue (Million) Forecast, by Application 2019 & 2032
- Table 36: Peru Application Release Automation Market Revenue (Million) Forecast, by Application 2019 & 2032
- Table 37: Chile Application Release Automation Market Revenue (Million) Forecast, by Application 2019 & 2032
- Table 38: Colombia Application Release Automation Market Revenue (Million) Forecast, by Application 2019 & 2032
- Table 39: Ecuador Application Release Automation Market Revenue (Million) Forecast, by Application 2019 & 2032
- Table 40: Venezuela Application Release Automation Market Revenue (Million) Forecast, by Application 2019 & 2032
- Table 41: Rest of South America Application Release Automation Market Revenue (Million) Forecast, by Application 2019 & 2032
- Table 42: Global Application Release Automation Market Revenue Million Forecast, by Country 2019 & 2032
- Table 43: United States Application Release Automation Market Revenue (Million) Forecast, by Application 2019 & 2032
- Table 44: Canada Application Release Automation Market Revenue (Million) Forecast, by Application 2019 & 2032
- Table 45: Mexico Application Release Automation Market Revenue (Million) Forecast, by Application 2019 & 2032
- Table 46: Global Application Release Automation Market Revenue Million Forecast, by Country 2019 & 2032
- Table 47: United Arab Emirates Application Release Automation Market Revenue (Million) Forecast, by Application 2019 & 2032
- Table 48: Saudi Arabia Application Release Automation Market Revenue (Million) Forecast, by Application 2019 & 2032
- Table 49: South Africa Application Release Automation Market Revenue (Million) Forecast, by Application 2019 & 2032
- Table 50: Rest of Middle East and Africa Application Release Automation Market Revenue (Million) Forecast, by Application 2019 & 2032
- Table 51: Global Application Release Automation Market Revenue Million Forecast, by Component 2019 & 2032
- Table 52: Global Application Release Automation Market Revenue Million Forecast, by Deployment 2019 & 2032
- Table 53: Global Application Release Automation Market Revenue Million Forecast, by End-User Industries 2019 & 2032
- Table 54: Global Application Release Automation Market Revenue Million Forecast, by Country 2019 & 2032
- Table 55: Global Application Release Automation Market Revenue Million Forecast, by Component 2019 & 2032
- Table 56: Global Application Release Automation Market Revenue Million Forecast, by Deployment 2019 & 2032
- Table 57: Global Application Release Automation Market Revenue Million Forecast, by End-User Industries 2019 & 2032
- Table 58: Global Application Release Automation Market Revenue Million Forecast, by Country 2019 & 2032
- Table 59: Global Application Release Automation Market Revenue Million Forecast, by Component 2019 & 2032
- Table 60: Global Application Release Automation Market Revenue Million Forecast, by Deployment 2019 & 2032
- Table 61: Global Application Release Automation Market Revenue Million Forecast, by End-User Industries 2019 & 2032
- Table 62: Global Application Release Automation Market Revenue Million Forecast, by Country 2019 & 2032
- Table 63: Global Application Release Automation Market Revenue Million Forecast, by Component 2019 & 2032
- Table 64: Global Application Release Automation Market Revenue Million Forecast, by Deployment 2019 & 2032
- Table 65: Global Application Release Automation Market Revenue Million Forecast, by End-User Industries 2019 & 2032
- Table 66: Global Application Release Automation Market Revenue Million Forecast, by Country 2019 & 2032
Frequently Asked Questions
1. What is the projected Compound Annual Growth Rate (CAGR) of the Application Release Automation Market?
The projected CAGR is approximately 19.75%.
2. Which companies are prominent players in the Application Release Automation Market?
Key companies in the market include Chef Software Inc, Electric Cloud Inc, IBM Corporation, Datical Inc, Micro Focus International Plc, CollabNet Inc , CloudBees Inc, Broadcom Inc, Microsoft Corporation, BMC Software Inc, Flexagon LLC, ARCAD Software, Attunity Ltd.
3. What are the main segments of the Application Release Automation Market?
The market segments include Component, Deployment, End-User Industries.
4. Can you provide details about the market size?
The market size is estimated to be USD 4.08 Million as of 2022.
5. What are some drivers contributing to market growth?
On Increasing Demand of Faster Delivery of Software with Reduced Operational Risk; Rapid Adoption by Enterprise to Deliver Differentiated Customer Experiences and to Retain.
6. What are the notable trends driving market growth?
Cloud is Expected to Hold Significant Market Share.
7. Are there any restraints impacting market growth?
High Cost of Product and Failed Deployment of Software or Applications and Complexity in Configurations.
8. Can you provide examples of recent developments in the market?
February 2023 - Red Hat, Inc., announced the availability of the Red Hat Ansible Automation Platform on Google Cloud, providing a common and flexible IT automation solution that extends from the cloud to the data center and out to the edge without additional complexity or required skills.
9. What pricing options are available for accessing the report?
Pricing options include single-user, multi-user, and enterprise licenses priced at USD 4750, USD 5250, and USD 8750 respectively.
10. Is the market size provided in terms of value or volume?
The market size is provided in terms of value, measured in Million.
11. Are there any specific market keywords associated with the report?
Yes, the market keyword associated with the report is "Application Release Automation Market," which aids in identifying and referencing the specific market segment covered.
12. How do I determine which pricing option suits my needs best?
The pricing options vary based on user requirements and access needs. Individual users may opt for single-user licenses, while businesses requiring broader access may choose multi-user or enterprise licenses for cost-effective access to the report.
13. Are there any additional resources or data provided in the Application Release Automation Market report?
While the report offers comprehensive insights, it's advisable to review the specific contents or supplementary materials provided to ascertain if additional resources or data are available.
14. How can I stay updated on further developments or reports in the Application Release Automation Market?
To stay informed about further developments, trends, and reports in the Application Release Automation Market, consider subscribing to industry newsletters, following relevant companies and organizations, or regularly checking reputable industry news sources and publications.
Methodology
Step 1 - Identification of Relevant Samples Size from Population Database


Step 2 - Approaches for Defining Global Market Size (Value, Volume* & Price*)

Note*: In applicable scenarios
Step 3 - Data Sources
Primary Research
- Web Analytics
- Survey Reports
- Research Institute
- Latest Research Reports
- Opinion Leaders
Secondary Research
- Annual Reports
- White Paper
- Latest Press Release
- Industry Association
- Paid Database
- Investor Presentations

Step 4 - Data Triangulation
Involves using different sources of information in order to increase the validity of a study
These sources are likely to be stakeholders in a program - participants, other researchers, program staff, other community members, and so on.
Then we put all data in single framework & apply various statistical tools to find out the dynamic on the market.
During the analysis stage, feedback from the stakeholder groups would be compared to determine areas of agreement as well as areas of divergence


