
Key Insights
The Asia-Pacific (APAC) pet insurance market is experiencing robust growth, driven by increasing pet ownership, rising pet healthcare costs, and a growing awareness of pet health insurance benefits among pet owners. The market's expansion is particularly notable in countries like China, Japan, and Australia, where disposable incomes are rising and pet humanization trends are prominent. This leads to greater willingness to invest in comprehensive pet healthcare, including insurance coverage for accidents, illnesses, and chronic conditions. The segment dominated by dog and cat insurance reflects the widespread popularity of these pets in the region. While the private sector is currently the leading provider, the public sector’s involvement is expected to gradually increase given government initiatives focused on animal welfare. However, challenges remain, including relatively low insurance penetration compared to North America and Europe, limited product awareness in some areas, and regulatory hurdles in certain APAC nations. Furthermore, the prevalence of informal veterinary care in certain regions can pose a challenge to the accurate assessment of pet health claims. Despite these constraints, the long-term outlook for the APAC pet insurance market remains positive, fueled by sustained economic growth, evolving consumer preferences, and the potential for innovative insurance products tailored to specific regional needs.
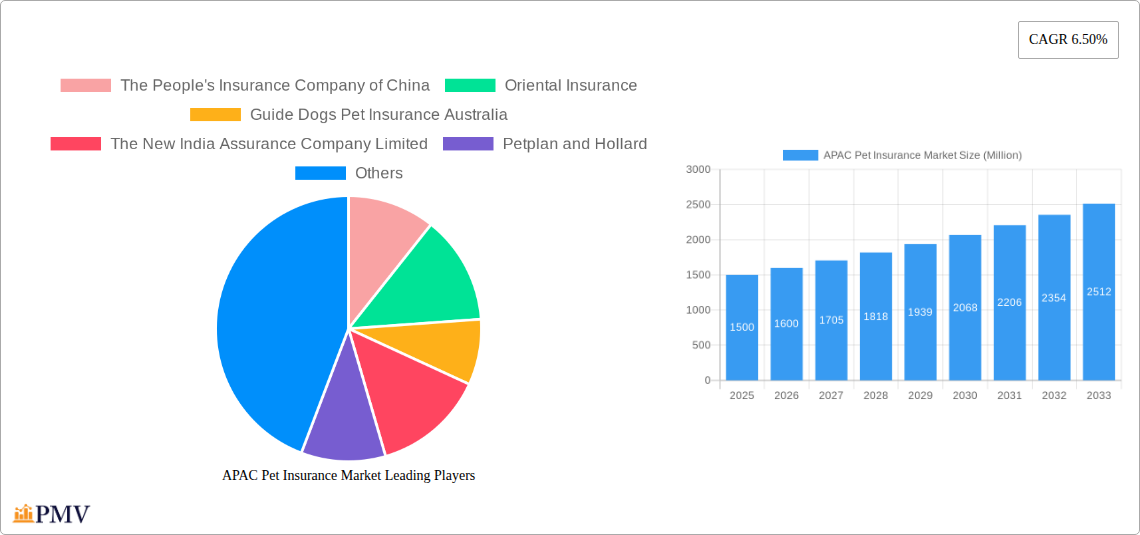
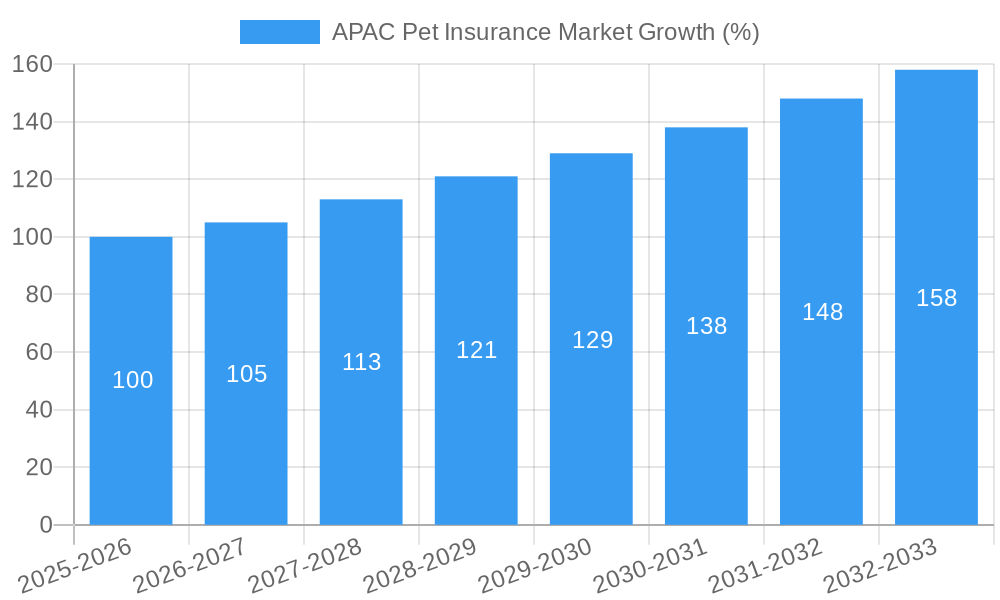
The forecast period (2025-2033) is expected to witness a significant expansion of the APAC pet insurance market, driven by a projected CAGR of 6.5%. This growth will be further fueled by the increasing availability of online pet insurance platforms, facilitating wider market reach and increased customer convenience. The diversification of insurance products is another key trend, with offerings evolving to cater to specific pet breeds, ages, and pre-existing conditions. Moreover, the integration of technology, such as telemedicine and wearable pet health trackers, is expected to significantly enhance claim processing efficiencies and provide more personalized insurance solutions. Competition among insurance providers will intensify, driving innovation and greater price competitiveness. The expanding middle class in several APAC countries will play a crucial role in this growth, further propelling the market's upward trajectory. Strategic partnerships between insurance providers and veterinary clinics will also contribute to market growth.
APAC Pet Insurance Market: A Comprehensive Report (2019-2033)
This comprehensive report provides a detailed analysis of the Asia-Pacific (APAC) pet insurance market, offering invaluable insights for industry stakeholders, investors, and strategic decision-makers. The study covers the period from 2019 to 2033, with 2025 serving as the base and estimated year. The report leverages extensive market research to deliver actionable intelligence, forecasting market growth and identifying key trends shaping this dynamic sector. The total market size in 2025 is estimated at xx Million, projected to reach xx Million by 2033, exhibiting a robust CAGR of xx%.
APAC Pet Insurance Market Market Structure & Competitive Dynamics
The APAC pet insurance market exhibits a moderately fragmented structure, with a mix of large multinational players and smaller regional insurers. Market concentration is relatively low, with no single company holding a dominant share. However, companies like The People's Insurance Company of China, Oriental Insurance, and Medibank Private Limited hold significant market presence, particularly in their respective national markets. The innovation ecosystem is driven by digitalization, with online platforms and telematics playing a crucial role. Regulatory frameworks vary significantly across the region, influencing market penetration and product offerings. The market also faces competition from alternative solutions, such as pet savings plans and crowdfunding.
M&A activity has been moderate, with deal values ranging from xx Million to xx Million in recent years. Notable transactions include collaborations like the partnership between InsuranceDekho and Future Generali India Insurance Company.
- Market Share: The People's Insurance Company of China holds an estimated xx% market share in China, while Oriental Insurance controls approximately xx%. Other significant players have varying market shares, with a concentration less than xx% for any individual company outside China.
- M&A Activity: The past five years witnessed approximately xx M&A deals in the APAC pet insurance market, with an average deal value of approximately xx Million. These deals largely focused on enhancing technological capabilities and expanding geographical reach.
APAC Pet Insurance Market Industry Trends & Insights
The APAC pet insurance market is experiencing robust growth driven by several key factors. Rising pet ownership, particularly in urban areas, is a significant driver, coupled with increasing pet humanization and a willingness to spend on premium pet healthcare. Technological advancements, including the development of digital platforms and telematics, are improving accessibility and efficiency. Consumer preferences are shifting towards comprehensive coverage, including chronic conditions, and digital-first solutions. The competitive landscape is characterized by both established players and new entrants, spurring innovation and affordability.
The market's CAGR is projected to be xx% during the forecast period (2025-2033). Market penetration remains relatively low compared to Western markets, presenting significant growth potential. This untapped potential, especially in emerging economies, offers attractive opportunities for insurance companies, particularly those focused on digital distribution channels and customized product offerings.
Dominant Markets & Segments in APAC Pet Insurance Market
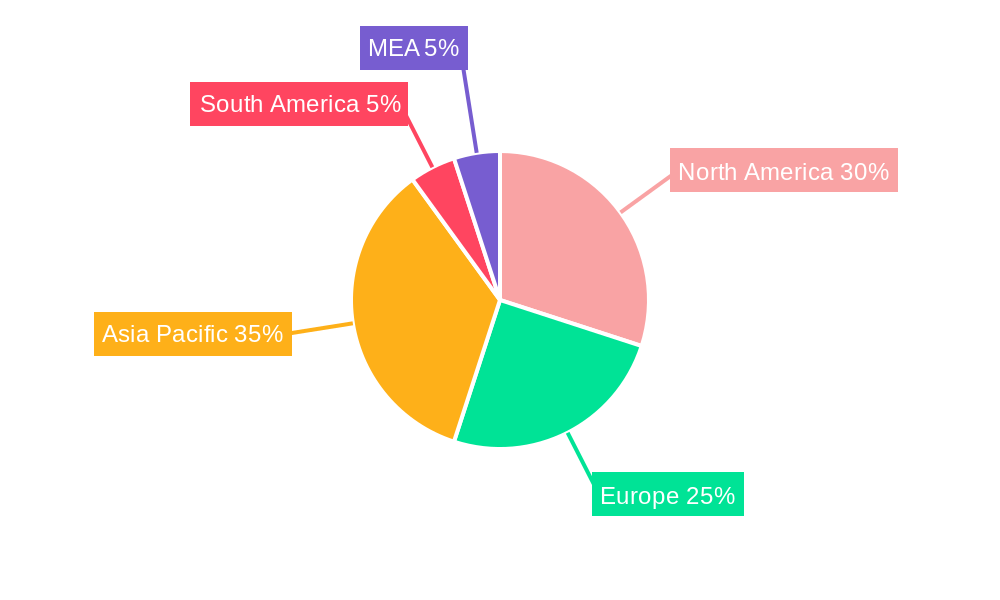
Dominant Region/Country: China currently dominates the APAC pet insurance market due to its massive pet population and growing pet owner spending. However, rapid growth is anticipated in other countries like Australia, Japan, and South Korea, fueled by increased pet ownership and high per capita income.
Dominant Segments:
- By Provider: The private sector dominates the market, driven by a wider range of products and advanced technological capabilities compared to the public sector.
- By Policy: Accident-only policies have a larger market share currently, but growth is expected to be stronger in chronic conditions coverage, reflecting evolving consumer needs.
- By Animal: Dogs and cats constitute the majority of the insured animals, with dogs holding a slightly larger market share.
Key Drivers for Dominant Segments:
- China (By Provider – Private): Strong private sector investment, technological advancements leading to digital platforms, and favorable regulatory conditions.
- Across APAC (By Policy – Chronic Conditions): Increasing awareness of pet healthcare costs, evolving consumer preferences for comprehensive coverage, and innovative product offerings by insurers.
- Across APAC (By Animal – Dogs): Higher pet ownership rates for dogs, compared to other animals, across many APAC countries.
APAC Pet Insurance Market Product Innovations
Recent product innovations have focused on enhancing digital capabilities, providing more personalized coverage options, and integrating telematics for risk assessment and claims management. The rise of digital-only platforms like oyen.my provides increased accessibility, while bundled services and value-added offerings are gaining traction. These innovations aim to improve customer experience, optimize risk management, and enhance the overall value proposition of pet insurance.
Report Segmentation & Scope
The report segments the APAC pet insurance market by:
- Provider: Public and Private. The private sector is expected to dominate with a CAGR of xx% due to its agility and investment in technology. The public sector's market share will remain relatively stable at approximately xx% during the forecast period.
- Policy: Accidents, Chronic Conditions, and Others (covering a range of ailments). Chronic condition coverage is anticipated to grow at a faster rate than accident-only policies.
- Animal: Dog, Cat, and Others (including birds, reptiles, etc.). Dogs and cats will remain the dominant segments throughout the forecast period.
Key Drivers of APAC Pet Insurance Market Growth
Several factors fuel the growth of the APAC pet insurance market:
- Rising Pet Ownership: The increasing number of pet owners, particularly in urban areas, significantly drives demand.
- Pet Humanization: Pets are increasingly viewed as family members, leading to higher spending on their healthcare.
- Technological Advancements: Digital platforms and telematics are improving accessibility and efficiency.
- Favorable Regulatory Environment (in some regions): Supportive policies in certain countries promote the development of the pet insurance industry.
Challenges in the APAC Pet Insurance Market Sector
Despite significant growth potential, the APAC pet insurance market faces several challenges:
- Low Insurance Penetration: Many pet owners remain uninsured due to limited awareness or affordability concerns.
- Varying Regulatory Frameworks: Inconsistent regulations across the region create complexities for insurers.
- Data Availability & Accuracy: Lack of comprehensive data on pet ownership and healthcare costs hinders accurate market assessment. This results in difficulty in accurate pricing and market penetration analysis.
Leading Players in the APAC Pet Insurance Market Market
- The People's Insurance Company of China
- Oriental Insurance
- Guide Dogs Pet Insurance Australia
- The New India Assurance Company Limited
- Petplan and Hollard
- Anicom Insurance Inc
- Pet Insurance Australia
- ipet Insurance
- Rakuten Inc
- Medibank Private Limited
Key Developments in APAC Pet Insurance Market Sector
- August 2022: InsuranceDekho partnered with Future Generali India Insurance Company to launch dog health insurance in India. This signals a push toward greater accessibility and specialized pet insurance products.
- April 2021: Oyen Sdn Bhd and MSIG Insurance (Malaysia) Bhd collaborated to launch oyen.my, a digital-only pet insurance platform. This showcases the growing importance of digital distribution channels.
Strategic APAC Pet Insurance Market Market Outlook
The APAC pet insurance market presents substantial growth opportunities for insurers willing to adapt to the changing landscape. Strategic focus on digitalization, product diversification (including chronic conditions coverage and wellness benefits), and expansion into underserved markets will be crucial for success. Companies that can effectively leverage technological advancements to enhance customer experience and optimize risk management are poised for significant market share gains. The growing pet ownership rates across the region, coupled with increasing pet humanization and awareness of pet healthcare costs, point towards a bright future for the APAC pet insurance market.
APAC Pet Insurance Market Segmentation
-
1. Policy
- 1.1. Accidents
- 1.2. Chronic Conditions
- 1.3. Others
-
2. Animal
- 2.1. Dog
- 2.2. Cat
- 2.3. Others
-
3. Provider
- 3.1. Public
- 3.2. Private
-
4. Geography
- 4.1. China
- 4.2. Japan
- 4.3. India
- 4.4. Australia
- 4.5. South Korea
- 4.6. Rest of Asia-Pacific
APAC Pet Insurance Market Segmentation By Geography
- 1. China
- 2. Japan
- 3. India
- 4. Australia
- 5. South Korea
- 6. Rest of Asia Pacific
APAC Pet Insurance Market REPORT HIGHLIGHTS
| Aspects | Details |
|---|---|
| Study Period | 2019-2033 |
| Base Year | 2024 |
| Estimated Year | 2025 |
| Forecast Period | 2025-2033 |
| Historical Period | 2019-2024 |
| Growth Rate | CAGR of 6.50% from 2019-2033 |
| Segmentation |
|
Table of Contents
- 1. Introduction
- 1.1. Research Scope
- 1.2. Market Segmentation
- 1.3. Research Methodology
- 1.4. Definitions and Assumptions
- 2. Executive Summary
- 2.1. Introduction
- 3. Market Dynamics
- 3.1. Introduction
- 3.2. Market Drivers
- 3.2.1. Increasing Pet Adoption; Rising Awareness Regarding Pet Insurance
- 3.3. Market Restrains
- 3.3.1. Low Adoption in Emerging Countries
- 3.4. Market Trends
- 3.4.1. Chronic Conditions by Policy is Expected to Hold a Significant Share Over the Forecast Period
- 4. Market Factor Analysis
- 4.1. Porters Five Forces
- 4.2. Supply/Value Chain
- 4.3. PESTEL analysis
- 4.4. Market Entropy
- 4.5. Patent/Trademark Analysis
- 5. Global APAC Pet Insurance Market Analysis, Insights and Forecast, 2019-2031
- 5.1. Market Analysis, Insights and Forecast - by Policy
- 5.1.1. Accidents
- 5.1.2. Chronic Conditions
- 5.1.3. Others
- 5.2. Market Analysis, Insights and Forecast - by Animal
- 5.2.1. Dog
- 5.2.2. Cat
- 5.2.3. Others
- 5.3. Market Analysis, Insights and Forecast - by Provider
- 5.3.1. Public
- 5.3.2. Private
- 5.4. Market Analysis, Insights and Forecast - by Geography
- 5.4.1. China
- 5.4.2. Japan
- 5.4.3. India
- 5.4.4. Australia
- 5.4.5. South Korea
- 5.4.6. Rest of Asia-Pacific
- 5.5. Market Analysis, Insights and Forecast - by Region
- 5.5.1. China
- 5.5.2. Japan
- 5.5.3. India
- 5.5.4. Australia
- 5.5.5. South Korea
- 5.5.6. Rest of Asia Pacific
- 5.1. Market Analysis, Insights and Forecast - by Policy
- 6. China APAC Pet Insurance Market Analysis, Insights and Forecast, 2019-2031
- 6.1. Market Analysis, Insights and Forecast - by Policy
- 6.1.1. Accidents
- 6.1.2. Chronic Conditions
- 6.1.3. Others
- 6.2. Market Analysis, Insights and Forecast - by Animal
- 6.2.1. Dog
- 6.2.2. Cat
- 6.2.3. Others
- 6.3. Market Analysis, Insights and Forecast - by Provider
- 6.3.1. Public
- 6.3.2. Private
- 6.4. Market Analysis, Insights and Forecast - by Geography
- 6.4.1. China
- 6.4.2. Japan
- 6.4.3. India
- 6.4.4. Australia
- 6.4.5. South Korea
- 6.4.6. Rest of Asia-Pacific
- 6.1. Market Analysis, Insights and Forecast - by Policy
- 7. Japan APAC Pet Insurance Market Analysis, Insights and Forecast, 2019-2031
- 7.1. Market Analysis, Insights and Forecast - by Policy
- 7.1.1. Accidents
- 7.1.2. Chronic Conditions
- 7.1.3. Others
- 7.2. Market Analysis, Insights and Forecast - by Animal
- 7.2.1. Dog
- 7.2.2. Cat
- 7.2.3. Others
- 7.3. Market Analysis, Insights and Forecast - by Provider
- 7.3.1. Public
- 7.3.2. Private
- 7.4. Market Analysis, Insights and Forecast - by Geography
- 7.4.1. China
- 7.4.2. Japan
- 7.4.3. India
- 7.4.4. Australia
- 7.4.5. South Korea
- 7.4.6. Rest of Asia-Pacific
- 7.1. Market Analysis, Insights and Forecast - by Policy
- 8. India APAC Pet Insurance Market Analysis, Insights and Forecast, 2019-2031
- 8.1. Market Analysis, Insights and Forecast - by Policy
- 8.1.1. Accidents
- 8.1.2. Chronic Conditions
- 8.1.3. Others
- 8.2. Market Analysis, Insights and Forecast - by Animal
- 8.2.1. Dog
- 8.2.2. Cat
- 8.2.3. Others
- 8.3. Market Analysis, Insights and Forecast - by Provider
- 8.3.1. Public
- 8.3.2. Private
- 8.4. Market Analysis, Insights and Forecast - by Geography
- 8.4.1. China
- 8.4.2. Japan
- 8.4.3. India
- 8.4.4. Australia
- 8.4.5. South Korea
- 8.4.6. Rest of Asia-Pacific
- 8.1. Market Analysis, Insights and Forecast - by Policy
- 9. Australia APAC Pet Insurance Market Analysis, Insights and Forecast, 2019-2031
- 9.1. Market Analysis, Insights and Forecast - by Policy
- 9.1.1. Accidents
- 9.1.2. Chronic Conditions
- 9.1.3. Others
- 9.2. Market Analysis, Insights and Forecast - by Animal
- 9.2.1. Dog
- 9.2.2. Cat
- 9.2.3. Others
- 9.3. Market Analysis, Insights and Forecast - by Provider
- 9.3.1. Public
- 9.3.2. Private
- 9.4. Market Analysis, Insights and Forecast - by Geography
- 9.4.1. China
- 9.4.2. Japan
- 9.4.3. India
- 9.4.4. Australia
- 9.4.5. South Korea
- 9.4.6. Rest of Asia-Pacific
- 9.1. Market Analysis, Insights and Forecast - by Policy
- 10. South Korea APAC Pet Insurance Market Analysis, Insights and Forecast, 2019-2031
- 10.1. Market Analysis, Insights and Forecast - by Policy
- 10.1.1. Accidents
- 10.1.2. Chronic Conditions
- 10.1.3. Others
- 10.2. Market Analysis, Insights and Forecast - by Animal
- 10.2.1. Dog
- 10.2.2. Cat
- 10.2.3. Others
- 10.3. Market Analysis, Insights and Forecast - by Provider
- 10.3.1. Public
- 10.3.2. Private
- 10.4. Market Analysis, Insights and Forecast - by Geography
- 10.4.1. China
- 10.4.2. Japan
- 10.4.3. India
- 10.4.4. Australia
- 10.4.5. South Korea
- 10.4.6. Rest of Asia-Pacific
- 10.1. Market Analysis, Insights and Forecast - by Policy
- 11. Rest of Asia Pacific APAC Pet Insurance Market Analysis, Insights and Forecast, 2019-2031
- 11.1. Market Analysis, Insights and Forecast - by Policy
- 11.1.1. Accidents
- 11.1.2. Chronic Conditions
- 11.1.3. Others
- 11.2. Market Analysis, Insights and Forecast - by Animal
- 11.2.1. Dog
- 11.2.2. Cat
- 11.2.3. Others
- 11.3. Market Analysis, Insights and Forecast - by Provider
- 11.3.1. Public
- 11.3.2. Private
- 11.4. Market Analysis, Insights and Forecast - by Geography
- 11.4.1. China
- 11.4.2. Japan
- 11.4.3. India
- 11.4.4. Australia
- 11.4.5. South Korea
- 11.4.6. Rest of Asia-Pacific
- 11.1. Market Analysis, Insights and Forecast - by Policy
- 12. North America APAC Pet Insurance Market Analysis, Insights and Forecast, 2019-2031
- 12.1. Market Analysis, Insights and Forecast - By Country/Sub-region
- 12.1.1 United States
- 12.1.2 Canada
- 12.1.3 Mexico
- 13. Europe APAC Pet Insurance Market Analysis, Insights and Forecast, 2019-2031
- 13.1. Market Analysis, Insights and Forecast - By Country/Sub-region
- 13.1.1 Germany
- 13.1.2 United Kingdom
- 13.1.3 France
- 13.1.4 Spain
- 13.1.5 Italy
- 13.1.6 Spain
- 13.1.7 Belgium
- 13.1.8 Netherland
- 13.1.9 Nordics
- 13.1.10 Rest of Europe
- 14. Asia Pacific APAC Pet Insurance Market Analysis, Insights and Forecast, 2019-2031
- 14.1. Market Analysis, Insights and Forecast - By Country/Sub-region
- 14.1.1 China
- 14.1.2 Japan
- 14.1.3 India
- 14.1.4 South Korea
- 14.1.5 Southeast Asia
- 14.1.6 Australia
- 14.1.7 Indonesia
- 14.1.8 Phillipes
- 14.1.9 Singapore
- 14.1.10 Thailandc
- 14.1.11 Rest of Asia Pacific
- 15. South America APAC Pet Insurance Market Analysis, Insights and Forecast, 2019-2031
- 15.1. Market Analysis, Insights and Forecast - By Country/Sub-region
- 15.1.1 Brazil
- 15.1.2 Argentina
- 15.1.3 Peru
- 15.1.4 Chile
- 15.1.5 Colombia
- 15.1.6 Ecuador
- 15.1.7 Venezuela
- 15.1.8 Rest of South America
- 16. North America APAC Pet Insurance Market Analysis, Insights and Forecast, 2019-2031
- 16.1. Market Analysis, Insights and Forecast - By Country/Sub-region
- 16.1.1 United States
- 16.1.2 Canada
- 16.1.3 Mexico
- 17. MEA APAC Pet Insurance Market Analysis, Insights and Forecast, 2019-2031
- 17.1. Market Analysis, Insights and Forecast - By Country/Sub-region
- 17.1.1 United Arab Emirates
- 17.1.2 Saudi Arabia
- 17.1.3 South Africa
- 17.1.4 Rest of Middle East and Africa
- 18. Competitive Analysis
- 18.1. Global Market Share Analysis 2024
- 18.2. Company Profiles
- 18.2.1 The People's Insurance Company of China
- 18.2.1.1. Overview
- 18.2.1.2. Products
- 18.2.1.3. SWOT Analysis
- 18.2.1.4. Recent Developments
- 18.2.1.5. Financials (Based on Availability)
- 18.2.2 Oriental Insurance
- 18.2.2.1. Overview
- 18.2.2.2. Products
- 18.2.2.3. SWOT Analysis
- 18.2.2.4. Recent Developments
- 18.2.2.5. Financials (Based on Availability)
- 18.2.3 Guide Dogs Pet Insurance Australia
- 18.2.3.1. Overview
- 18.2.3.2. Products
- 18.2.3.3. SWOT Analysis
- 18.2.3.4. Recent Developments
- 18.2.3.5. Financials (Based on Availability)
- 18.2.4 The New India Assurance Company Limited
- 18.2.4.1. Overview
- 18.2.4.2. Products
- 18.2.4.3. SWOT Analysis
- 18.2.4.4. Recent Developments
- 18.2.4.5. Financials (Based on Availability)
- 18.2.5 Petplan and Hollard
- 18.2.5.1. Overview
- 18.2.5.2. Products
- 18.2.5.3. SWOT Analysis
- 18.2.5.4. Recent Developments
- 18.2.5.5. Financials (Based on Availability)
- 18.2.6 Anicom Insurance Inc
- 18.2.6.1. Overview
- 18.2.6.2. Products
- 18.2.6.3. SWOT Analysis
- 18.2.6.4. Recent Developments
- 18.2.6.5. Financials (Based on Availability)
- 18.2.7 Pet Insurance Australia
- 18.2.7.1. Overview
- 18.2.7.2. Products
- 18.2.7.3. SWOT Analysis
- 18.2.7.4. Recent Developments
- 18.2.7.5. Financials (Based on Availability)
- 18.2.8 ipet Insurance
- 18.2.8.1. Overview
- 18.2.8.2. Products
- 18.2.8.3. SWOT Analysis
- 18.2.8.4. Recent Developments
- 18.2.8.5. Financials (Based on Availability)
- 18.2.9 Rakuten Inc
- 18.2.9.1. Overview
- 18.2.9.2. Products
- 18.2.9.3. SWOT Analysis
- 18.2.9.4. Recent Developments
- 18.2.9.5. Financials (Based on Availability)
- 18.2.10 Medibank Private Limited
- 18.2.10.1. Overview
- 18.2.10.2. Products
- 18.2.10.3. SWOT Analysis
- 18.2.10.4. Recent Developments
- 18.2.10.5. Financials (Based on Availability)
- 18.2.1 The People's Insurance Company of China
List of Figures
- Figure 1: Global APAC Pet Insurance Market Revenue Breakdown (Million, %) by Region 2024 & 2032
- Figure 2: Global APAC Pet Insurance Market Volume Breakdown (K Unit, %) by Region 2024 & 2032
- Figure 3: North America APAC Pet Insurance Market Revenue (Million), by Country 2024 & 2032
- Figure 4: North America APAC Pet Insurance Market Volume (K Unit), by Country 2024 & 2032
- Figure 5: North America APAC Pet Insurance Market Revenue Share (%), by Country 2024 & 2032
- Figure 6: North America APAC Pet Insurance Market Volume Share (%), by Country 2024 & 2032
- Figure 7: Europe APAC Pet Insurance Market Revenue (Million), by Country 2024 & 2032
- Figure 8: Europe APAC Pet Insurance Market Volume (K Unit), by Country 2024 & 2032
- Figure 9: Europe APAC Pet Insurance Market Revenue Share (%), by Country 2024 & 2032
- Figure 10: Europe APAC Pet Insurance Market Volume Share (%), by Country 2024 & 2032
- Figure 11: Asia Pacific APAC Pet Insurance Market Revenue (Million), by Country 2024 & 2032
- Figure 12: Asia Pacific APAC Pet Insurance Market Volume (K Unit), by Country 2024 & 2032
- Figure 13: Asia Pacific APAC Pet Insurance Market Revenue Share (%), by Country 2024 & 2032
- Figure 14: Asia Pacific APAC Pet Insurance Market Volume Share (%), by Country 2024 & 2032
- Figure 15: South America APAC Pet Insurance Market Revenue (Million), by Country 2024 & 2032
- Figure 16: South America APAC Pet Insurance Market Volume (K Unit), by Country 2024 & 2032
- Figure 17: South America APAC Pet Insurance Market Revenue Share (%), by Country 2024 & 2032
- Figure 18: South America APAC Pet Insurance Market Volume Share (%), by Country 2024 & 2032
- Figure 19: North America APAC Pet Insurance Market Revenue (Million), by Country 2024 & 2032
- Figure 20: North America APAC Pet Insurance Market Volume (K Unit), by Country 2024 & 2032
- Figure 21: North America APAC Pet Insurance Market Revenue Share (%), by Country 2024 & 2032
- Figure 22: North America APAC Pet Insurance Market Volume Share (%), by Country 2024 & 2032
- Figure 23: MEA APAC Pet Insurance Market Revenue (Million), by Country 2024 & 2032
- Figure 24: MEA APAC Pet Insurance Market Volume (K Unit), by Country 2024 & 2032
- Figure 25: MEA APAC Pet Insurance Market Revenue Share (%), by Country 2024 & 2032
- Figure 26: MEA APAC Pet Insurance Market Volume Share (%), by Country 2024 & 2032
- Figure 27: China APAC Pet Insurance Market Revenue (Million), by Policy 2024 & 2032
- Figure 28: China APAC Pet Insurance Market Volume (K Unit), by Policy 2024 & 2032
- Figure 29: China APAC Pet Insurance Market Revenue Share (%), by Policy 2024 & 2032
- Figure 30: China APAC Pet Insurance Market Volume Share (%), by Policy 2024 & 2032
- Figure 31: China APAC Pet Insurance Market Revenue (Million), by Animal 2024 & 2032
- Figure 32: China APAC Pet Insurance Market Volume (K Unit), by Animal 2024 & 2032
- Figure 33: China APAC Pet Insurance Market Revenue Share (%), by Animal 2024 & 2032
- Figure 34: China APAC Pet Insurance Market Volume Share (%), by Animal 2024 & 2032
- Figure 35: China APAC Pet Insurance Market Revenue (Million), by Provider 2024 & 2032
- Figure 36: China APAC Pet Insurance Market Volume (K Unit), by Provider 2024 & 2032
- Figure 37: China APAC Pet Insurance Market Revenue Share (%), by Provider 2024 & 2032
- Figure 38: China APAC Pet Insurance Market Volume Share (%), by Provider 2024 & 2032
- Figure 39: China APAC Pet Insurance Market Revenue (Million), by Geography 2024 & 2032
- Figure 40: China APAC Pet Insurance Market Volume (K Unit), by Geography 2024 & 2032
- Figure 41: China APAC Pet Insurance Market Revenue Share (%), by Geography 2024 & 2032
- Figure 42: China APAC Pet Insurance Market Volume Share (%), by Geography 2024 & 2032
- Figure 43: China APAC Pet Insurance Market Revenue (Million), by Country 2024 & 2032
- Figure 44: China APAC Pet Insurance Market Volume (K Unit), by Country 2024 & 2032
- Figure 45: China APAC Pet Insurance Market Revenue Share (%), by Country 2024 & 2032
- Figure 46: China APAC Pet Insurance Market Volume Share (%), by Country 2024 & 2032
- Figure 47: Japan APAC Pet Insurance Market Revenue (Million), by Policy 2024 & 2032
- Figure 48: Japan APAC Pet Insurance Market Volume (K Unit), by Policy 2024 & 2032
- Figure 49: Japan APAC Pet Insurance Market Revenue Share (%), by Policy 2024 & 2032
- Figure 50: Japan APAC Pet Insurance Market Volume Share (%), by Policy 2024 & 2032
- Figure 51: Japan APAC Pet Insurance Market Revenue (Million), by Animal 2024 & 2032
- Figure 52: Japan APAC Pet Insurance Market Volume (K Unit), by Animal 2024 & 2032
- Figure 53: Japan APAC Pet Insurance Market Revenue Share (%), by Animal 2024 & 2032
- Figure 54: Japan APAC Pet Insurance Market Volume Share (%), by Animal 2024 & 2032
- Figure 55: Japan APAC Pet Insurance Market Revenue (Million), by Provider 2024 & 2032
- Figure 56: Japan APAC Pet Insurance Market Volume (K Unit), by Provider 2024 & 2032
- Figure 57: Japan APAC Pet Insurance Market Revenue Share (%), by Provider 2024 & 2032
- Figure 58: Japan APAC Pet Insurance Market Volume Share (%), by Provider 2024 & 2032
- Figure 59: Japan APAC Pet Insurance Market Revenue (Million), by Geography 2024 & 2032
- Figure 60: Japan APAC Pet Insurance Market Volume (K Unit), by Geography 2024 & 2032
- Figure 61: Japan APAC Pet Insurance Market Revenue Share (%), by Geography 2024 & 2032
- Figure 62: Japan APAC Pet Insurance Market Volume Share (%), by Geography 2024 & 2032
- Figure 63: Japan APAC Pet Insurance Market Revenue (Million), by Country 2024 & 2032
- Figure 64: Japan APAC Pet Insurance Market Volume (K Unit), by Country 2024 & 2032
- Figure 65: Japan APAC Pet Insurance Market Revenue Share (%), by Country 2024 & 2032
- Figure 66: Japan APAC Pet Insurance Market Volume Share (%), by Country 2024 & 2032
- Figure 67: India APAC Pet Insurance Market Revenue (Million), by Policy 2024 & 2032
- Figure 68: India APAC Pet Insurance Market Volume (K Unit), by Policy 2024 & 2032
- Figure 69: India APAC Pet Insurance Market Revenue Share (%), by Policy 2024 & 2032
- Figure 70: India APAC Pet Insurance Market Volume Share (%), by Policy 2024 & 2032
- Figure 71: India APAC Pet Insurance Market Revenue (Million), by Animal 2024 & 2032
- Figure 72: India APAC Pet Insurance Market Volume (K Unit), by Animal 2024 & 2032
- Figure 73: India APAC Pet Insurance Market Revenue Share (%), by Animal 2024 & 2032
- Figure 74: India APAC Pet Insurance Market Volume Share (%), by Animal 2024 & 2032
- Figure 75: India APAC Pet Insurance Market Revenue (Million), by Provider 2024 & 2032
- Figure 76: India APAC Pet Insurance Market Volume (K Unit), by Provider 2024 & 2032
- Figure 77: India APAC Pet Insurance Market Revenue Share (%), by Provider 2024 & 2032
- Figure 78: India APAC Pet Insurance Market Volume Share (%), by Provider 2024 & 2032
- Figure 79: India APAC Pet Insurance Market Revenue (Million), by Geography 2024 & 2032
- Figure 80: India APAC Pet Insurance Market Volume (K Unit), by Geography 2024 & 2032
- Figure 81: India APAC Pet Insurance Market Revenue Share (%), by Geography 2024 & 2032
- Figure 82: India APAC Pet Insurance Market Volume Share (%), by Geography 2024 & 2032
- Figure 83: India APAC Pet Insurance Market Revenue (Million), by Country 2024 & 2032
- Figure 84: India APAC Pet Insurance Market Volume (K Unit), by Country 2024 & 2032
- Figure 85: India APAC Pet Insurance Market Revenue Share (%), by Country 2024 & 2032
- Figure 86: India APAC Pet Insurance Market Volume Share (%), by Country 2024 & 2032
- Figure 87: Australia APAC Pet Insurance Market Revenue (Million), by Policy 2024 & 2032
- Figure 88: Australia APAC Pet Insurance Market Volume (K Unit), by Policy 2024 & 2032
- Figure 89: Australia APAC Pet Insurance Market Revenue Share (%), by Policy 2024 & 2032
- Figure 90: Australia APAC Pet Insurance Market Volume Share (%), by Policy 2024 & 2032
- Figure 91: Australia APAC Pet Insurance Market Revenue (Million), by Animal 2024 & 2032
- Figure 92: Australia APAC Pet Insurance Market Volume (K Unit), by Animal 2024 & 2032
- Figure 93: Australia APAC Pet Insurance Market Revenue Share (%), by Animal 2024 & 2032
- Figure 94: Australia APAC Pet Insurance Market Volume Share (%), by Animal 2024 & 2032
- Figure 95: Australia APAC Pet Insurance Market Revenue (Million), by Provider 2024 & 2032
- Figure 96: Australia APAC Pet Insurance Market Volume (K Unit), by Provider 2024 & 2032
- Figure 97: Australia APAC Pet Insurance Market Revenue Share (%), by Provider 2024 & 2032
- Figure 98: Australia APAC Pet Insurance Market Volume Share (%), by Provider 2024 & 2032
- Figure 99: Australia APAC Pet Insurance Market Revenue (Million), by Geography 2024 & 2032
- Figure 100: Australia APAC Pet Insurance Market Volume (K Unit), by Geography 2024 & 2032
- Figure 101: Australia APAC Pet Insurance Market Revenue Share (%), by Geography 2024 & 2032
- Figure 102: Australia APAC Pet Insurance Market Volume Share (%), by Geography 2024 & 2032
- Figure 103: Australia APAC Pet Insurance Market Revenue (Million), by Country 2024 & 2032
- Figure 104: Australia APAC Pet Insurance Market Volume (K Unit), by Country 2024 & 2032
- Figure 105: Australia APAC Pet Insurance Market Revenue Share (%), by Country 2024 & 2032
- Figure 106: Australia APAC Pet Insurance Market Volume Share (%), by Country 2024 & 2032
- Figure 107: South Korea APAC Pet Insurance Market Revenue (Million), by Policy 2024 & 2032
- Figure 108: South Korea APAC Pet Insurance Market Volume (K Unit), by Policy 2024 & 2032
- Figure 109: South Korea APAC Pet Insurance Market Revenue Share (%), by Policy 2024 & 2032
- Figure 110: South Korea APAC Pet Insurance Market Volume Share (%), by Policy 2024 & 2032
- Figure 111: South Korea APAC Pet Insurance Market Revenue (Million), by Animal 2024 & 2032
- Figure 112: South Korea APAC Pet Insurance Market Volume (K Unit), by Animal 2024 & 2032
- Figure 113: South Korea APAC Pet Insurance Market Revenue Share (%), by Animal 2024 & 2032
- Figure 114: South Korea APAC Pet Insurance Market Volume Share (%), by Animal 2024 & 2032
- Figure 115: South Korea APAC Pet Insurance Market Revenue (Million), by Provider 2024 & 2032
- Figure 116: South Korea APAC Pet Insurance Market Volume (K Unit), by Provider 2024 & 2032
- Figure 117: South Korea APAC Pet Insurance Market Revenue Share (%), by Provider 2024 & 2032
- Figure 118: South Korea APAC Pet Insurance Market Volume Share (%), by Provider 2024 & 2032
- Figure 119: South Korea APAC Pet Insurance Market Revenue (Million), by Geography 2024 & 2032
- Figure 120: South Korea APAC Pet Insurance Market Volume (K Unit), by Geography 2024 & 2032
- Figure 121: South Korea APAC Pet Insurance Market Revenue Share (%), by Geography 2024 & 2032
- Figure 122: South Korea APAC Pet Insurance Market Volume Share (%), by Geography 2024 & 2032
- Figure 123: South Korea APAC Pet Insurance Market Revenue (Million), by Country 2024 & 2032
- Figure 124: South Korea APAC Pet Insurance Market Volume (K Unit), by Country 2024 & 2032
- Figure 125: South Korea APAC Pet Insurance Market Revenue Share (%), by Country 2024 & 2032
- Figure 126: South Korea APAC Pet Insurance Market Volume Share (%), by Country 2024 & 2032
- Figure 127: Rest of Asia Pacific APAC Pet Insurance Market Revenue (Million), by Policy 2024 & 2032
- Figure 128: Rest of Asia Pacific APAC Pet Insurance Market Volume (K Unit), by Policy 2024 & 2032
- Figure 129: Rest of Asia Pacific APAC Pet Insurance Market Revenue Share (%), by Policy 2024 & 2032
- Figure 130: Rest of Asia Pacific APAC Pet Insurance Market Volume Share (%), by Policy 2024 & 2032
- Figure 131: Rest of Asia Pacific APAC Pet Insurance Market Revenue (Million), by Animal 2024 & 2032
- Figure 132: Rest of Asia Pacific APAC Pet Insurance Market Volume (K Unit), by Animal 2024 & 2032
- Figure 133: Rest of Asia Pacific APAC Pet Insurance Market Revenue Share (%), by Animal 2024 & 2032
- Figure 134: Rest of Asia Pacific APAC Pet Insurance Market Volume Share (%), by Animal 2024 & 2032
- Figure 135: Rest of Asia Pacific APAC Pet Insurance Market Revenue (Million), by Provider 2024 & 2032
- Figure 136: Rest of Asia Pacific APAC Pet Insurance Market Volume (K Unit), by Provider 2024 & 2032
- Figure 137: Rest of Asia Pacific APAC Pet Insurance Market Revenue Share (%), by Provider 2024 & 2032
- Figure 138: Rest of Asia Pacific APAC Pet Insurance Market Volume Share (%), by Provider 2024 & 2032
- Figure 139: Rest of Asia Pacific APAC Pet Insurance Market Revenue (Million), by Geography 2024 & 2032
- Figure 140: Rest of Asia Pacific APAC Pet Insurance Market Volume (K Unit), by Geography 2024 & 2032
- Figure 141: Rest of Asia Pacific APAC Pet Insurance Market Revenue Share (%), by Geography 2024 & 2032
- Figure 142: Rest of Asia Pacific APAC Pet Insurance Market Volume Share (%), by Geography 2024 & 2032
- Figure 143: Rest of Asia Pacific APAC Pet Insurance Market Revenue (Million), by Country 2024 & 2032
- Figure 144: Rest of Asia Pacific APAC Pet Insurance Market Volume (K Unit), by Country 2024 & 2032
- Figure 145: Rest of Asia Pacific APAC Pet Insurance Market Revenue Share (%), by Country 2024 & 2032
- Figure 146: Rest of Asia Pacific APAC Pet Insurance Market Volume Share (%), by Country 2024 & 2032
List of Tables
- Table 1: Global APAC Pet Insurance Market Revenue Million Forecast, by Region 2019 & 2032
- Table 2: Global APAC Pet Insurance Market Volume K Unit Forecast, by Region 2019 & 2032
- Table 3: Global APAC Pet Insurance Market Revenue Million Forecast, by Policy 2019 & 2032
- Table 4: Global APAC Pet Insurance Market Volume K Unit Forecast, by Policy 2019 & 2032
- Table 5: Global APAC Pet Insurance Market Revenue Million Forecast, by Animal 2019 & 2032
- Table 6: Global APAC Pet Insurance Market Volume K Unit Forecast, by Animal 2019 & 2032
- Table 7: Global APAC Pet Insurance Market Revenue Million Forecast, by Provider 2019 & 2032
- Table 8: Global APAC Pet Insurance Market Volume K Unit Forecast, by Provider 2019 & 2032
- Table 9: Global APAC Pet Insurance Market Revenue Million Forecast, by Geography 2019 & 2032
- Table 10: Global APAC Pet Insurance Market Volume K Unit Forecast, by Geography 2019 & 2032
- Table 11: Global APAC Pet Insurance Market Revenue Million Forecast, by Region 2019 & 2032
- Table 12: Global APAC Pet Insurance Market Volume K Unit Forecast, by Region 2019 & 2032
- Table 13: Global APAC Pet Insurance Market Revenue Million Forecast, by Country 2019 & 2032
- Table 14: Global APAC Pet Insurance Market Volume K Unit Forecast, by Country 2019 & 2032
- Table 15: United States APAC Pet Insurance Market Revenue (Million) Forecast, by Application 2019 & 2032
- Table 16: United States APAC Pet Insurance Market Volume (K Unit) Forecast, by Application 2019 & 2032
- Table 17: Canada APAC Pet Insurance Market Revenue (Million) Forecast, by Application 2019 & 2032
- Table 18: Canada APAC Pet Insurance Market Volume (K Unit) Forecast, by Application 2019 & 2032
- Table 19: Mexico APAC Pet Insurance Market Revenue (Million) Forecast, by Application 2019 & 2032
- Table 20: Mexico APAC Pet Insurance Market Volume (K Unit) Forecast, by Application 2019 & 2032
- Table 21: Global APAC Pet Insurance Market Revenue Million Forecast, by Country 2019 & 2032
- Table 22: Global APAC Pet Insurance Market Volume K Unit Forecast, by Country 2019 & 2032
- Table 23: Germany APAC Pet Insurance Market Revenue (Million) Forecast, by Application 2019 & 2032
- Table 24: Germany APAC Pet Insurance Market Volume (K Unit) Forecast, by Application 2019 & 2032
- Table 25: United Kingdom APAC Pet Insurance Market Revenue (Million) Forecast, by Application 2019 & 2032
- Table 26: United Kingdom APAC Pet Insurance Market Volume (K Unit) Forecast, by Application 2019 & 2032
- Table 27: France APAC Pet Insurance Market Revenue (Million) Forecast, by Application 2019 & 2032
- Table 28: France APAC Pet Insurance Market Volume (K Unit) Forecast, by Application 2019 & 2032
- Table 29: Spain APAC Pet Insurance Market Revenue (Million) Forecast, by Application 2019 & 2032
- Table 30: Spain APAC Pet Insurance Market Volume (K Unit) Forecast, by Application 2019 & 2032
- Table 31: Italy APAC Pet Insurance Market Revenue (Million) Forecast, by Application 2019 & 2032
- Table 32: Italy APAC Pet Insurance Market Volume (K Unit) Forecast, by Application 2019 & 2032
- Table 33: Spain APAC Pet Insurance Market Revenue (Million) Forecast, by Application 2019 & 2032
- Table 34: Spain APAC Pet Insurance Market Volume (K Unit) Forecast, by Application 2019 & 2032
- Table 35: Belgium APAC Pet Insurance Market Revenue (Million) Forecast, by Application 2019 & 2032
- Table 36: Belgium APAC Pet Insurance Market Volume (K Unit) Forecast, by Application 2019 & 2032
- Table 37: Netherland APAC Pet Insurance Market Revenue (Million) Forecast, by Application 2019 & 2032
- Table 38: Netherland APAC Pet Insurance Market Volume (K Unit) Forecast, by Application 2019 & 2032
- Table 39: Nordics APAC Pet Insurance Market Revenue (Million) Forecast, by Application 2019 & 2032
- Table 40: Nordics APAC Pet Insurance Market Volume (K Unit) Forecast, by Application 2019 & 2032
- Table 41: Rest of Europe APAC Pet Insurance Market Revenue (Million) Forecast, by Application 2019 & 2032
- Table 42: Rest of Europe APAC Pet Insurance Market Volume (K Unit) Forecast, by Application 2019 & 2032
- Table 43: Global APAC Pet Insurance Market Revenue Million Forecast, by Country 2019 & 2032
- Table 44: Global APAC Pet Insurance Market Volume K Unit Forecast, by Country 2019 & 2032
- Table 45: China APAC Pet Insurance Market Revenue (Million) Forecast, by Application 2019 & 2032
- Table 46: China APAC Pet Insurance Market Volume (K Unit) Forecast, by Application 2019 & 2032
- Table 47: Japan APAC Pet Insurance Market Revenue (Million) Forecast, by Application 2019 & 2032
- Table 48: Japan APAC Pet Insurance Market Volume (K Unit) Forecast, by Application 2019 & 2032
- Table 49: India APAC Pet Insurance Market Revenue (Million) Forecast, by Application 2019 & 2032
- Table 50: India APAC Pet Insurance Market Volume (K Unit) Forecast, by Application 2019 & 2032
- Table 51: South Korea APAC Pet Insurance Market Revenue (Million) Forecast, by Application 2019 & 2032
- Table 52: South Korea APAC Pet Insurance Market Volume (K Unit) Forecast, by Application 2019 & 2032
- Table 53: Southeast Asia APAC Pet Insurance Market Revenue (Million) Forecast, by Application 2019 & 2032
- Table 54: Southeast Asia APAC Pet Insurance Market Volume (K Unit) Forecast, by Application 2019 & 2032
- Table 55: Australia APAC Pet Insurance Market Revenue (Million) Forecast, by Application 2019 & 2032
- Table 56: Australia APAC Pet Insurance Market Volume (K Unit) Forecast, by Application 2019 & 2032
- Table 57: Indonesia APAC Pet Insurance Market Revenue (Million) Forecast, by Application 2019 & 2032
- Table 58: Indonesia APAC Pet Insurance Market Volume (K Unit) Forecast, by Application 2019 & 2032
- Table 59: Phillipes APAC Pet Insurance Market Revenue (Million) Forecast, by Application 2019 & 2032
- Table 60: Phillipes APAC Pet Insurance Market Volume (K Unit) Forecast, by Application 2019 & 2032
- Table 61: Singapore APAC Pet Insurance Market Revenue (Million) Forecast, by Application 2019 & 2032
- Table 62: Singapore APAC Pet Insurance Market Volume (K Unit) Forecast, by Application 2019 & 2032
- Table 63: Thailandc APAC Pet Insurance Market Revenue (Million) Forecast, by Application 2019 & 2032
- Table 64: Thailandc APAC Pet Insurance Market Volume (K Unit) Forecast, by Application 2019 & 2032
- Table 65: Rest of Asia Pacific APAC Pet Insurance Market Revenue (Million) Forecast, by Application 2019 & 2032
- Table 66: Rest of Asia Pacific APAC Pet Insurance Market Volume (K Unit) Forecast, by Application 2019 & 2032
- Table 67: Global APAC Pet Insurance Market Revenue Million Forecast, by Country 2019 & 2032
- Table 68: Global APAC Pet Insurance Market Volume K Unit Forecast, by Country 2019 & 2032
- Table 69: Brazil APAC Pet Insurance Market Revenue (Million) Forecast, by Application 2019 & 2032
- Table 70: Brazil APAC Pet Insurance Market Volume (K Unit) Forecast, by Application 2019 & 2032
- Table 71: Argentina APAC Pet Insurance Market Revenue (Million) Forecast, by Application 2019 & 2032
- Table 72: Argentina APAC Pet Insurance Market Volume (K Unit) Forecast, by Application 2019 & 2032
- Table 73: Peru APAC Pet Insurance Market Revenue (Million) Forecast, by Application 2019 & 2032
- Table 74: Peru APAC Pet Insurance Market Volume (K Unit) Forecast, by Application 2019 & 2032
- Table 75: Chile APAC Pet Insurance Market Revenue (Million) Forecast, by Application 2019 & 2032
- Table 76: Chile APAC Pet Insurance Market Volume (K Unit) Forecast, by Application 2019 & 2032
- Table 77: Colombia APAC Pet Insurance Market Revenue (Million) Forecast, by Application 2019 & 2032
- Table 78: Colombia APAC Pet Insurance Market Volume (K Unit) Forecast, by Application 2019 & 2032
- Table 79: Ecuador APAC Pet Insurance Market Revenue (Million) Forecast, by Application 2019 & 2032
- Table 80: Ecuador APAC Pet Insurance Market Volume (K Unit) Forecast, by Application 2019 & 2032
- Table 81: Venezuela APAC Pet Insurance Market Revenue (Million) Forecast, by Application 2019 & 2032
- Table 82: Venezuela APAC Pet Insurance Market Volume (K Unit) Forecast, by Application 2019 & 2032
- Table 83: Rest of South America APAC Pet Insurance Market Revenue (Million) Forecast, by Application 2019 & 2032
- Table 84: Rest of South America APAC Pet Insurance Market Volume (K Unit) Forecast, by Application 2019 & 2032
- Table 85: Global APAC Pet Insurance Market Revenue Million Forecast, by Country 2019 & 2032
- Table 86: Global APAC Pet Insurance Market Volume K Unit Forecast, by Country 2019 & 2032
- Table 87: United States APAC Pet Insurance Market Revenue (Million) Forecast, by Application 2019 & 2032
- Table 88: United States APAC Pet Insurance Market Volume (K Unit) Forecast, by Application 2019 & 2032
- Table 89: Canada APAC Pet Insurance Market Revenue (Million) Forecast, by Application 2019 & 2032
- Table 90: Canada APAC Pet Insurance Market Volume (K Unit) Forecast, by Application 2019 & 2032
- Table 91: Mexico APAC Pet Insurance Market Revenue (Million) Forecast, by Application 2019 & 2032
- Table 92: Mexico APAC Pet Insurance Market Volume (K Unit) Forecast, by Application 2019 & 2032
- Table 93: Global APAC Pet Insurance Market Revenue Million Forecast, by Country 2019 & 2032
- Table 94: Global APAC Pet Insurance Market Volume K Unit Forecast, by Country 2019 & 2032
- Table 95: United Arab Emirates APAC Pet Insurance Market Revenue (Million) Forecast, by Application 2019 & 2032
- Table 96: United Arab Emirates APAC Pet Insurance Market Volume (K Unit) Forecast, by Application 2019 & 2032
- Table 97: Saudi Arabia APAC Pet Insurance Market Revenue (Million) Forecast, by Application 2019 & 2032
- Table 98: Saudi Arabia APAC Pet Insurance Market Volume (K Unit) Forecast, by Application 2019 & 2032
- Table 99: South Africa APAC Pet Insurance Market Revenue (Million) Forecast, by Application 2019 & 2032
- Table 100: South Africa APAC Pet Insurance Market Volume (K Unit) Forecast, by Application 2019 & 2032
- Table 101: Rest of Middle East and Africa APAC Pet Insurance Market Revenue (Million) Forecast, by Application 2019 & 2032
- Table 102: Rest of Middle East and Africa APAC Pet Insurance Market Volume (K Unit) Forecast, by Application 2019 & 2032
- Table 103: Global APAC Pet Insurance Market Revenue Million Forecast, by Policy 2019 & 2032
- Table 104: Global APAC Pet Insurance Market Volume K Unit Forecast, by Policy 2019 & 2032
- Table 105: Global APAC Pet Insurance Market Revenue Million Forecast, by Animal 2019 & 2032
- Table 106: Global APAC Pet Insurance Market Volume K Unit Forecast, by Animal 2019 & 2032
- Table 107: Global APAC Pet Insurance Market Revenue Million Forecast, by Provider 2019 & 2032
- Table 108: Global APAC Pet Insurance Market Volume K Unit Forecast, by Provider 2019 & 2032
- Table 109: Global APAC Pet Insurance Market Revenue Million Forecast, by Geography 2019 & 2032
- Table 110: Global APAC Pet Insurance Market Volume K Unit Forecast, by Geography 2019 & 2032
- Table 111: Global APAC Pet Insurance Market Revenue Million Forecast, by Country 2019 & 2032
- Table 112: Global APAC Pet Insurance Market Volume K Unit Forecast, by Country 2019 & 2032
- Table 113: Global APAC Pet Insurance Market Revenue Million Forecast, by Policy 2019 & 2032
- Table 114: Global APAC Pet Insurance Market Volume K Unit Forecast, by Policy 2019 & 2032
- Table 115: Global APAC Pet Insurance Market Revenue Million Forecast, by Animal 2019 & 2032
- Table 116: Global APAC Pet Insurance Market Volume K Unit Forecast, by Animal 2019 & 2032
- Table 117: Global APAC Pet Insurance Market Revenue Million Forecast, by Provider 2019 & 2032
- Table 118: Global APAC Pet Insurance Market Volume K Unit Forecast, by Provider 2019 & 2032
- Table 119: Global APAC Pet Insurance Market Revenue Million Forecast, by Geography 2019 & 2032
- Table 120: Global APAC Pet Insurance Market Volume K Unit Forecast, by Geography 2019 & 2032
- Table 121: Global APAC Pet Insurance Market Revenue Million Forecast, by Country 2019 & 2032
- Table 122: Global APAC Pet Insurance Market Volume K Unit Forecast, by Country 2019 & 2032
- Table 123: Global APAC Pet Insurance Market Revenue Million Forecast, by Policy 2019 & 2032
- Table 124: Global APAC Pet Insurance Market Volume K Unit Forecast, by Policy 2019 & 2032
- Table 125: Global APAC Pet Insurance Market Revenue Million Forecast, by Animal 2019 & 2032
- Table 126: Global APAC Pet Insurance Market Volume K Unit Forecast, by Animal 2019 & 2032
- Table 127: Global APAC Pet Insurance Market Revenue Million Forecast, by Provider 2019 & 2032
- Table 128: Global APAC Pet Insurance Market Volume K Unit Forecast, by Provider 2019 & 2032
- Table 129: Global APAC Pet Insurance Market Revenue Million Forecast, by Geography 2019 & 2032
- Table 130: Global APAC Pet Insurance Market Volume K Unit Forecast, by Geography 2019 & 2032
- Table 131: Global APAC Pet Insurance Market Revenue Million Forecast, by Country 2019 & 2032
- Table 132: Global APAC Pet Insurance Market Volume K Unit Forecast, by Country 2019 & 2032
- Table 133: Global APAC Pet Insurance Market Revenue Million Forecast, by Policy 2019 & 2032
- Table 134: Global APAC Pet Insurance Market Volume K Unit Forecast, by Policy 2019 & 2032
- Table 135: Global APAC Pet Insurance Market Revenue Million Forecast, by Animal 2019 & 2032
- Table 136: Global APAC Pet Insurance Market Volume K Unit Forecast, by Animal 2019 & 2032
- Table 137: Global APAC Pet Insurance Market Revenue Million Forecast, by Provider 2019 & 2032
- Table 138: Global APAC Pet Insurance Market Volume K Unit Forecast, by Provider 2019 & 2032
- Table 139: Global APAC Pet Insurance Market Revenue Million Forecast, by Geography 2019 & 2032
- Table 140: Global APAC Pet Insurance Market Volume K Unit Forecast, by Geography 2019 & 2032
- Table 141: Global APAC Pet Insurance Market Revenue Million Forecast, by Country 2019 & 2032
- Table 142: Global APAC Pet Insurance Market Volume K Unit Forecast, by Country 2019 & 2032
- Table 143: Global APAC Pet Insurance Market Revenue Million Forecast, by Policy 2019 & 2032
- Table 144: Global APAC Pet Insurance Market Volume K Unit Forecast, by Policy 2019 & 2032
- Table 145: Global APAC Pet Insurance Market Revenue Million Forecast, by Animal 2019 & 2032
- Table 146: Global APAC Pet Insurance Market Volume K Unit Forecast, by Animal 2019 & 2032
- Table 147: Global APAC Pet Insurance Market Revenue Million Forecast, by Provider 2019 & 2032
- Table 148: Global APAC Pet Insurance Market Volume K Unit Forecast, by Provider 2019 & 2032
- Table 149: Global APAC Pet Insurance Market Revenue Million Forecast, by Geography 2019 & 2032
- Table 150: Global APAC Pet Insurance Market Volume K Unit Forecast, by Geography 2019 & 2032
- Table 151: Global APAC Pet Insurance Market Revenue Million Forecast, by Country 2019 & 2032
- Table 152: Global APAC Pet Insurance Market Volume K Unit Forecast, by Country 2019 & 2032
- Table 153: Global APAC Pet Insurance Market Revenue Million Forecast, by Policy 2019 & 2032
- Table 154: Global APAC Pet Insurance Market Volume K Unit Forecast, by Policy 2019 & 2032
- Table 155: Global APAC Pet Insurance Market Revenue Million Forecast, by Animal 2019 & 2032
- Table 156: Global APAC Pet Insurance Market Volume K Unit Forecast, by Animal 2019 & 2032
- Table 157: Global APAC Pet Insurance Market Revenue Million Forecast, by Provider 2019 & 2032
- Table 158: Global APAC Pet Insurance Market Volume K Unit Forecast, by Provider 2019 & 2032
- Table 159: Global APAC Pet Insurance Market Revenue Million Forecast, by Geography 2019 & 2032
- Table 160: Global APAC Pet Insurance Market Volume K Unit Forecast, by Geography 2019 & 2032
- Table 161: Global APAC Pet Insurance Market Revenue Million Forecast, by Country 2019 & 2032
- Table 162: Global APAC Pet Insurance Market Volume K Unit Forecast, by Country 2019 & 2032
Frequently Asked Questions
1. What is the projected Compound Annual Growth Rate (CAGR) of the APAC Pet Insurance Market?
The projected CAGR is approximately 6.50%.
2. Which companies are prominent players in the APAC Pet Insurance Market?
Key companies in the market include The People's Insurance Company of China, Oriental Insurance, Guide Dogs Pet Insurance Australia, The New India Assurance Company Limited, Petplan and Hollard, Anicom Insurance Inc, Pet Insurance Australia, ipet Insurance, Rakuten Inc, Medibank Private Limited.
3. What are the main segments of the APAC Pet Insurance Market?
The market segments include Policy, Animal, Provider, Geography.
4. Can you provide details about the market size?
The market size is estimated to be USD XX Million as of 2022.
5. What are some drivers contributing to market growth?
Increasing Pet Adoption; Rising Awareness Regarding Pet Insurance.
6. What are the notable trends driving market growth?
Chronic Conditions by Policy is Expected to Hold a Significant Share Over the Forecast Period.
7. Are there any restraints impacting market growth?
Low Adoption in Emerging Countries.
8. Can you provide examples of recent developments in the market?
In August 2022, InsuranceDekho collaborated with Future Generali India Insurance Company to launch dog health insurance in India with a starting annual premium of about INR 324.
9. What pricing options are available for accessing the report?
Pricing options include single-user, multi-user, and enterprise licenses priced at USD 4750, USD 5250, and USD 8750 respectively.
10. Is the market size provided in terms of value or volume?
The market size is provided in terms of value, measured in Million and volume, measured in K Unit.
11. Are there any specific market keywords associated with the report?
Yes, the market keyword associated with the report is "APAC Pet Insurance Market," which aids in identifying and referencing the specific market segment covered.
12. How do I determine which pricing option suits my needs best?
The pricing options vary based on user requirements and access needs. Individual users may opt for single-user licenses, while businesses requiring broader access may choose multi-user or enterprise licenses for cost-effective access to the report.
13. Are there any additional resources or data provided in the APAC Pet Insurance Market report?
While the report offers comprehensive insights, it's advisable to review the specific contents or supplementary materials provided to ascertain if additional resources or data are available.
14. How can I stay updated on further developments or reports in the APAC Pet Insurance Market?
To stay informed about further developments, trends, and reports in the APAC Pet Insurance Market, consider subscribing to industry newsletters, following relevant companies and organizations, or regularly checking reputable industry news sources and publications.
Methodology
Step 1 - Identification of Relevant Samples Size from Population Database


Step 2 - Approaches for Defining Global Market Size (Value, Volume* & Price*)

Note*: In applicable scenarios
Step 3 - Data Sources
Primary Research
- Web Analytics
- Survey Reports
- Research Institute
- Latest Research Reports
- Opinion Leaders
Secondary Research
- Annual Reports
- White Paper
- Latest Press Release
- Industry Association
- Paid Database
- Investor Presentations

Step 4 - Data Triangulation
Involves using different sources of information in order to increase the validity of a study
These sources are likely to be stakeholders in a program - participants, other researchers, program staff, other community members, and so on.
Then we put all data in single framework & apply various statistical tools to find out the dynamic on the market.
During the analysis stage, feedback from the stakeholder groups would be compared to determine areas of agreement as well as areas of divergence


