
Key Insights
The Asia-Pacific (APAC) open systems imaging market is experiencing robust growth, driven by factors such as increasing prevalence of chronic diseases necessitating advanced diagnostic imaging, rising healthcare expenditure, and technological advancements leading to improved image quality and faster scan times. The region's diverse demographics and large population contribute significantly to the market's expansion. Specific growth drivers include the increasing adoption of minimally invasive procedures, a growing preference for technologically advanced systems, and government initiatives promoting healthcare infrastructure development across various APAC countries. China, Japan, India, and South Korea are key contributors to the market's growth, exhibiting strong demand for high-field scanners particularly in specialized applications like neurology, cardiology, and oncology. However, factors such as high initial investment costs for advanced imaging systems, particularly in less developed economies, and the need for skilled technicians to operate and maintain these systems pose challenges to market growth. The competitive landscape is dynamic, with a mix of established global players and emerging regional manufacturers vying for market share, fueling innovation and potentially leading to price reductions over the forecast period.
Looking forward, the APAC open systems imaging market is projected to maintain a healthy CAGR, exceeding the global average. This positive outlook is underpinned by several factors, including continued investments in healthcare infrastructure, expanding medical tourism, and the increasing awareness of the importance of early disease detection. Furthermore, the growing adoption of telehealth and remote diagnostic services is expected to stimulate demand for advanced imaging systems that can integrate with these platforms. However, regulatory hurdles and variations in healthcare policies across different APAC countries may create complexities for market participants. Nevertheless, the long-term growth trajectory remains positive, driven by the region's expanding healthcare sector and the increasing demand for high-quality diagnostic imaging solutions.
APAC Open Systems Imaging Industry: Market Analysis & Forecast 2019-2033
This comprehensive report provides a detailed analysis of the Asia-Pacific (APAC) open systems imaging industry, covering market size, growth projections, competitive landscape, and key trends from 2019 to 2033. The study includes in-depth segmentation by resolution (Low-Field Scanner, Mid-field Scanner, High-Field Scanner) and application (Neurology, Gastroenterology, Cardiology, Oncology, Others), offering actionable insights for industry stakeholders. The base year is 2025, with estimations for 2025 and forecasts spanning 2025-2033. Historical data from 2019-2024 provides a robust foundation for future projections. Key players such as ESAOTE SA, Siemens Healthcare, SHENZHEN BASDA MEDICAL APPARATUS CO LTD, Philips Healthcare, Mindray, Hitachi Medical Corporation, and Canon Medical Systems Corporation are analyzed in detail. This report is crucial for strategic decision-making and investment planning within the rapidly evolving APAC medical imaging sector.
APAC Open Systems Imaging Industry Market Structure & Competitive Dynamics
The APAC open systems imaging market exhibits a moderately consolidated structure, with key players holding significant market share. The market concentration ratio (CR4) is estimated at xx%, indicating the presence of both established multinational corporations and emerging local companies. Innovation ecosystems are geographically dispersed, with hubs in major APAC economies like China, Japan, and India. Regulatory frameworks vary across countries, impacting market access and product approvals. Substitute products, such as conventional imaging techniques, pose moderate competition, while the increasing adoption of advanced imaging technologies is driving market growth. End-user trends show a preference for high-resolution, cost-effective, and technologically advanced imaging systems. M&A activity is moderate, with deal values totaling approximately xx Million in the last five years. Key M&A activities include:
- Acquisition of xx company by xx company in 2022 (xx Million).
- Strategic partnership between xx and xx in 2023 focused on xx.
These activities are driven by the need to expand market reach, enhance product portfolios, and gain access to innovative technologies.
APAC Open Systems Imaging Industry Industry Trends & Insights
The APAC open systems imaging market is experiencing robust growth, driven by several key factors. The rising prevalence of chronic diseases such as cardiovascular ailments and cancer is increasing the demand for advanced diagnostic imaging technologies. Technological advancements, such as the development of AI-powered image analysis tools and improved resolution scanners, are enhancing the efficiency and accuracy of diagnostic procedures. This is further fueled by increasing healthcare expenditure and government initiatives to improve healthcare infrastructure across the region. Consumer preferences are shifting towards minimally invasive procedures and improved patient comfort, driving demand for advanced imaging techniques. The market is witnessing significant competitive dynamics with established players focusing on product innovation and expansion into emerging markets, while local companies are leveraging cost advantages to compete. The CAGR for the APAC open systems imaging market is projected to be xx% during the forecast period (2025-2033), with a market penetration rate expected to reach xx% by 2033.
Dominant Markets & Segments in APAC Open Systems Imaging Industry
China dominates the APAC open systems imaging market, accounting for approximately xx% of the total market value in 2025. Key drivers include:
- Robust economic growth: Fueling investment in healthcare infrastructure.
- Expanding healthcare access: Increasing the affordability and availability of diagnostic imaging services.
- Government initiatives: Supporting technological advancements and medical device development.
Within segments:
- By Resolution: The high-field scanner segment holds the largest market share, driven by its superior image quality and diagnostic capabilities. The mid-field scanner segment is experiencing faster growth, driven by its cost-effectiveness and suitability for a wider range of applications.
- By Application: Cardiology and Oncology segments are the most dominant, driven by high prevalence of cardiovascular diseases and cancer in APAC. Growth in the Neurology segment is expected to be strong due to increasing awareness and early diagnosis of neurological disorders.
APAC Open Systems Imaging Industry Product Innovations
Recent product innovations focus on improved image quality, faster scan times, and enhanced diagnostic capabilities. The integration of AI and machine learning is enabling automated image analysis and improved diagnostic accuracy. Miniaturization and portability of imaging systems are improving access to care in remote areas. Manufacturers are also focusing on developing cost-effective systems to meet the needs of budget-constrained healthcare providers. These innovations are enhancing the market competitiveness and driving market growth.
Report Segmentation & Scope
The report segments the APAC open systems imaging market by resolution (Low-Field Scanner, Mid-Field Scanner, High-Field Scanner) and application (Neurology, Gastroenterology, Cardiology, Oncology, Others). Each segment is analyzed in detail, with growth projections, market sizes, and competitive dynamics presented.
- By Resolution: Low-field scanners are projected to grow at a xx% CAGR, while mid-field and high-field scanners are expected to grow at xx% and xx% CAGRs, respectively.
- By Application: The Cardiology and Oncology segments exhibit the highest growth potential, with CAGRs of xx% and xx%, respectively.
The competitive landscape varies across segments, with different players dominating specific niches.
Key Drivers of APAC Open Systems Imaging Industry Growth
Several factors drive the growth of the APAC open systems imaging industry. Technological advancements, including AI-powered image analysis and improved scanner resolution, improve diagnostic accuracy and efficiency. Rising healthcare expenditure and increasing government support for healthcare infrastructure enhance accessibility. The growing prevalence of chronic diseases increases the demand for diagnostic imaging services. Favorable regulatory environments in certain countries facilitate market entry and product adoption. These factors collectively contribute to significant market expansion.
Challenges in the APAP Open Systems Imaging Industry Sector
The APAP open systems imaging industry faces challenges, including stringent regulatory approvals that increase time-to-market and development costs. Supply chain disruptions can impact product availability and pricing. Intense competition among established and emerging players puts pressure on profit margins. These factors can hinder market growth and necessitate strategic adaptations for companies operating within this space. The estimated impact of these challenges on the overall market growth is xx% reduction in projected revenue by 2033.
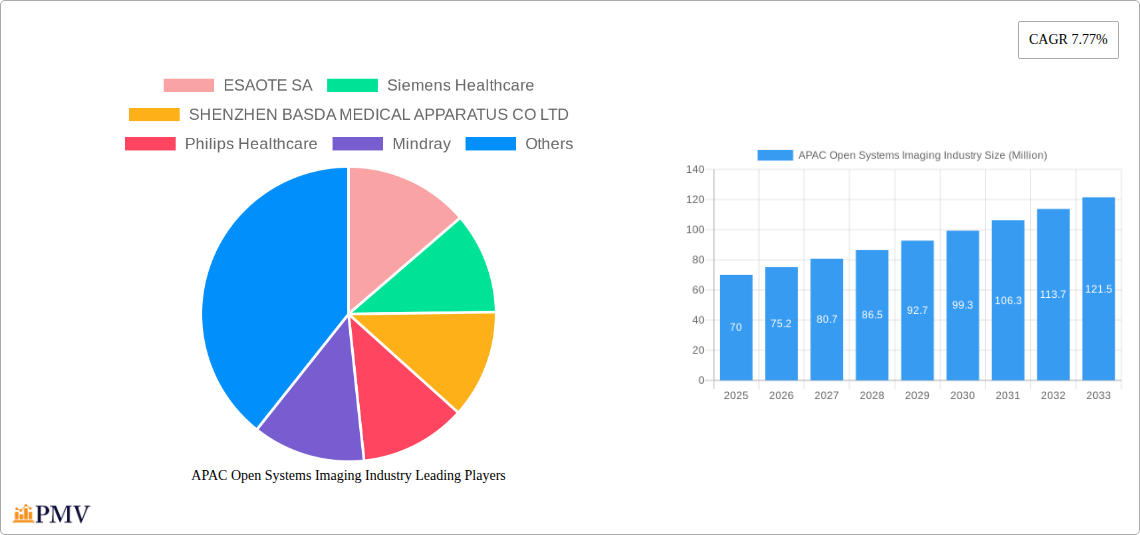
Leading Players in the APAC Open Systems Imaging Industry Market
- ESAOTE SA
- Siemens Healthcare
- SHENZHEN BASDA MEDICAL APPARATUS CO LTD
- Philips Healthcare
- Mindray
- Hitachi Medical Corporation
- Canon Medical Systems Corporation
Key Developments in APAC Open Systems Imaging Industry Sector
- January 2023: Launch of a new AI-powered image analysis software by Mindray.
- March 2022: Acquisition of xx company by Siemens Healthcare.
- June 2021: Approval of a novel high-resolution scanner by the regulatory authority in China.
Strategic APAC Open Systems Imaging Industry Market Outlook
The APAC open systems imaging market presents significant growth opportunities, driven by technological innovation, expanding healthcare infrastructure, and rising prevalence of chronic diseases. Strategic investments in R&D, partnerships with healthcare providers, and expansion into underserved markets are crucial for success. The focus on developing cost-effective and technologically advanced systems will further accelerate market growth and enhance patient care throughout the region. The market's future potential is strong, with continued expansion expected throughout the forecast period.
APAC Open Systems Imaging Industry Segmentation
-
1. Resolution
- 1.1. Low- Field Scanner
- 1.2. Mid-field Scanner
- 1.3. High-Field Scanner
-
2. Application
- 2.1. Neurology
- 2.2. Gastroenterology
- 2.3. Cardiology
- 2.4. Oncology
- 2.5. Others
-
3. Geography
-
3.1. Asia-Pacific
- 3.1.1. China
- 3.1.2. Japan
- 3.1.3. India
- 3.1.4. Australia
- 3.1.5. South Korea
- 3.1.6. Rest of Asia-Pacific
-
3.1. Asia-Pacific
APAC Open Systems Imaging Industry Segmentation By Geography
-
1. Asia Pacific
- 1.1. China
- 1.2. Japan
- 1.3. India
- 1.4. Australia
- 1.5. South Korea
- 1.6. Rest of Asia Pacific
APAC Open Systems Imaging Industry REPORT HIGHLIGHTS
| Aspects | Details |
|---|---|
| Study Period | 2019-2033 |
| Base Year | 2024 |
| Estimated Year | 2025 |
| Forecast Period | 2025-2033 |
| Historical Period | 2019-2024 |
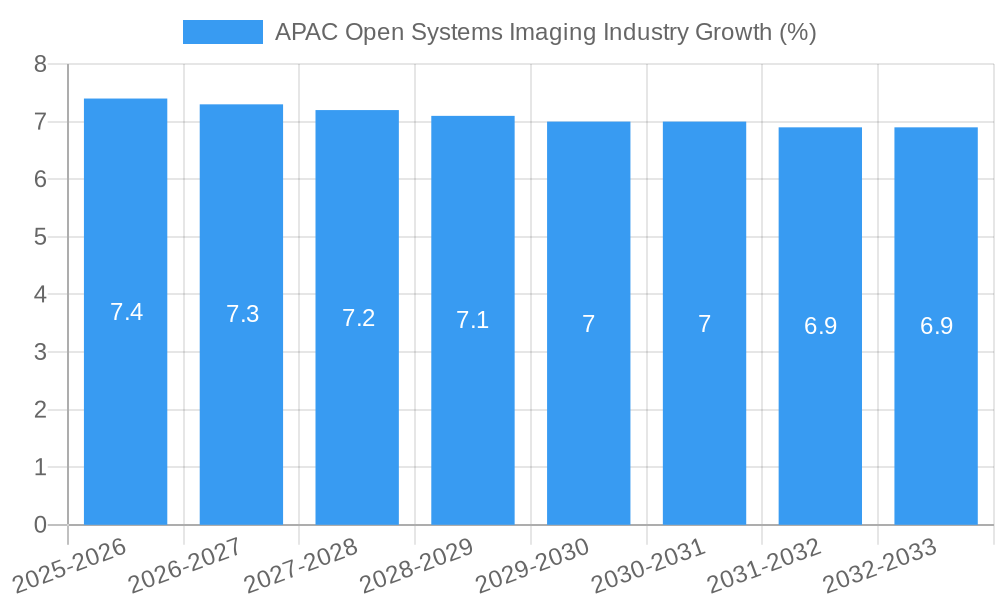
| Growth Rate | CAGR of 7.77% from 2019-2033 |
| Segmentation |
|
Table of Contents
- 1. Introduction
- 1.1. Research Scope
- 1.2. Market Segmentation
- 1.3. Research Methodology
- 1.4. Definitions and Assumptions
- 2. Executive Summary
- 2.1. Introduction
- 3. Market Dynamics
- 3.1. Introduction
- 3.2. Market Drivers
- 3.2.1. ; Increasing Number of MRI Procedures; Increasing Applications in Clinical Diagnosis and Increasing Disease Burden
- 3.3. Market Restrains
- 3.3.1. ; High Cost of Open MRI Systems
- 3.4. Market Trends
- 3.4.1. Application in Neurology is Expected to Dominate the Asia Pacific Open System MRI Market
- 4. Market Factor Analysis
- 4.1. Porters Five Forces
- 4.2. Supply/Value Chain
- 4.3. PESTEL analysis
- 4.4. Market Entropy
- 4.5. Patent/Trademark Analysis
- 5. Global APAC Open Systems Imaging Industry Analysis, Insights and Forecast, 2019-2031
- 5.1. Market Analysis, Insights and Forecast - by Resolution
- 5.1.1. Low- Field Scanner
- 5.1.2. Mid-field Scanner
- 5.1.3. High-Field Scanner
- 5.2. Market Analysis, Insights and Forecast - by Application
- 5.2.1. Neurology
- 5.2.2. Gastroenterology
- 5.2.3. Cardiology
- 5.2.4. Oncology
- 5.2.5. Others
- 5.3. Market Analysis, Insights and Forecast - by Geography
- 5.3.1. Asia-Pacific
- 5.3.1.1. China
- 5.3.1.2. Japan
- 5.3.1.3. India
- 5.3.1.4. Australia
- 5.3.1.5. South Korea
- 5.3.1.6. Rest of Asia-Pacific
- 5.3.1. Asia-Pacific
- 5.4. Market Analysis, Insights and Forecast - by Region
- 5.4.1. Asia Pacific
- 5.1. Market Analysis, Insights and Forecast - by Resolution
- 6. North America APAC Open Systems Imaging Industry Analysis, Insights and Forecast, 2019-2031
- 6.1. Market Analysis, Insights and Forecast - By Country/Sub-region
- 6.1.1 United States
- 6.1.2 Canada
- 6.1.3 Mexico
- 7. Europe APAC Open Systems Imaging Industry Analysis, Insights and Forecast, 2019-2031
- 7.1. Market Analysis, Insights and Forecast - By Country/Sub-region
- 7.1.1 Germany
- 7.1.2 United Kingdom
- 7.1.3 France
- 7.1.4 Spain
- 7.1.5 Italy
- 7.1.6 Spain
- 7.1.7 Belgium
- 7.1.8 Netherland
- 7.1.9 Nordics
- 7.1.10 Rest of Europe
- 8. Asia Pacific APAC Open Systems Imaging Industry Analysis, Insights and Forecast, 2019-2031
- 8.1. Market Analysis, Insights and Forecast - By Country/Sub-region
- 8.1.1 China
- 8.1.2 Japan
- 8.1.3 India
- 8.1.4 South Korea
- 8.1.5 Southeast Asia
- 8.1.6 Australia
- 8.1.7 Indonesia
- 8.1.8 Phillipes
- 8.1.9 Singapore
- 8.1.10 Thailandc
- 8.1.11 Rest of Asia Pacific
- 9. South America APAC Open Systems Imaging Industry Analysis, Insights and Forecast, 2019-2031
- 9.1. Market Analysis, Insights and Forecast - By Country/Sub-region
- 9.1.1 Brazil
- 9.1.2 Argentina
- 9.1.3 Peru
- 9.1.4 Chile
- 9.1.5 Colombia
- 9.1.6 Ecuador
- 9.1.7 Venezuela
- 9.1.8 Rest of South America
- 10. North America APAC Open Systems Imaging Industry Analysis, Insights and Forecast, 2019-2031
- 10.1. Market Analysis, Insights and Forecast - By Country/Sub-region
- 10.1.1 United States
- 10.1.2 Canada
- 10.1.3 Mexico
- 11. MEA APAC Open Systems Imaging Industry Analysis, Insights and Forecast, 2019-2031
- 11.1. Market Analysis, Insights and Forecast - By Country/Sub-region
- 11.1.1 United Arab Emirates
- 11.1.2 Saudi Arabia
- 11.1.3 South Africa
- 11.1.4 Rest of Middle East and Africa
- 12. Competitive Analysis
- 12.1. Global Market Share Analysis 2024
- 12.2. Company Profiles
- 12.2.1 ESAOTE SA
- 12.2.1.1. Overview
- 12.2.1.2. Products
- 12.2.1.3. SWOT Analysis
- 12.2.1.4. Recent Developments
- 12.2.1.5. Financials (Based on Availability)
- 12.2.2 Siemens Healthcare
- 12.2.2.1. Overview
- 12.2.2.2. Products
- 12.2.2.3. SWOT Analysis
- 12.2.2.4. Recent Developments
- 12.2.2.5. Financials (Based on Availability)
- 12.2.3 SHENZHEN BASDA MEDICAL APPARATUS CO LTD
- 12.2.3.1. Overview
- 12.2.3.2. Products
- 12.2.3.3. SWOT Analysis
- 12.2.3.4. Recent Developments
- 12.2.3.5. Financials (Based on Availability)
- 12.2.4 Philips Healthcare
- 12.2.4.1. Overview
- 12.2.4.2. Products
- 12.2.4.3. SWOT Analysis
- 12.2.4.4. Recent Developments
- 12.2.4.5. Financials (Based on Availability)
- 12.2.5 Mindray
- 12.2.5.1. Overview
- 12.2.5.2. Products
- 12.2.5.3. SWOT Analysis
- 12.2.5.4. Recent Developments
- 12.2.5.5. Financials (Based on Availability)
- 12.2.6 Hitachi Medical Corporation
- 12.2.6.1. Overview
- 12.2.6.2. Products
- 12.2.6.3. SWOT Analysis
- 12.2.6.4. Recent Developments
- 12.2.6.5. Financials (Based on Availability)
- 12.2.7 Canon Medical Systems Corporation
- 12.2.7.1. Overview
- 12.2.7.2. Products
- 12.2.7.3. SWOT Analysis
- 12.2.7.4. Recent Developments
- 12.2.7.5. Financials (Based on Availability)
- 12.2.1 ESAOTE SA
List of Figures
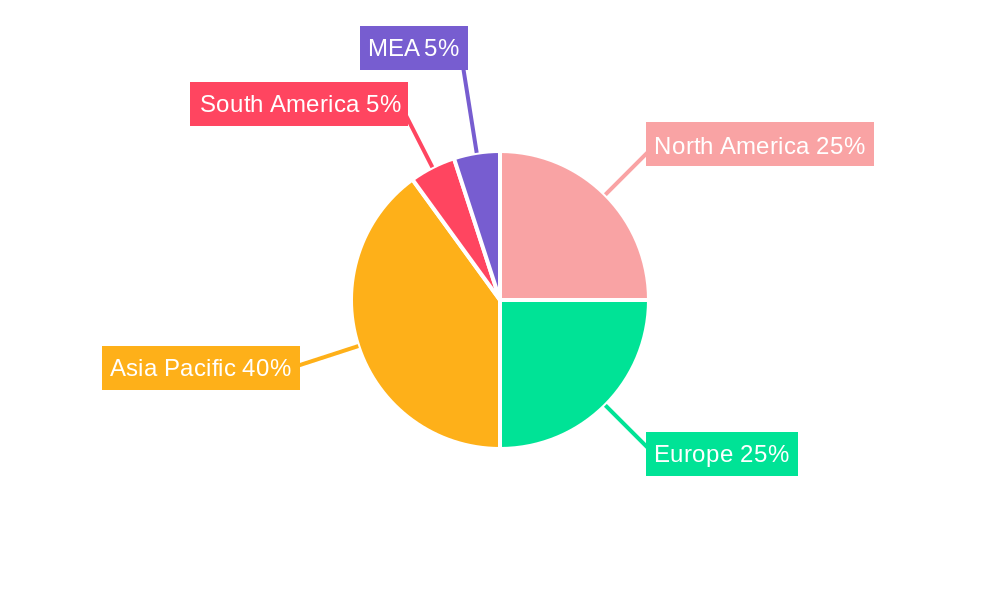
- Figure 1: Global APAC Open Systems Imaging Industry Revenue Breakdown (Million, %) by Region 2024 & 2032
- Figure 2: Global APAC Open Systems Imaging Industry Volume Breakdown (K Unit, %) by Region 2024 & 2032
- Figure 3: North America APAC Open Systems Imaging Industry Revenue (Million), by Country 2024 & 2032
- Figure 4: North America APAC Open Systems Imaging Industry Volume (K Unit), by Country 2024 & 2032
- Figure 5: North America APAC Open Systems Imaging Industry Revenue Share (%), by Country 2024 & 2032
- Figure 6: North America APAC Open Systems Imaging Industry Volume Share (%), by Country 2024 & 2032
- Figure 7: Europe APAC Open Systems Imaging Industry Revenue (Million), by Country 2024 & 2032
- Figure 8: Europe APAC Open Systems Imaging Industry Volume (K Unit), by Country 2024 & 2032
- Figure 9: Europe APAC Open Systems Imaging Industry Revenue Share (%), by Country 2024 & 2032
- Figure 10: Europe APAC Open Systems Imaging Industry Volume Share (%), by Country 2024 & 2032
- Figure 11: Asia Pacific APAC Open Systems Imaging Industry Revenue (Million), by Country 2024 & 2032
- Figure 12: Asia Pacific APAC Open Systems Imaging Industry Volume (K Unit), by Country 2024 & 2032
- Figure 13: Asia Pacific APAC Open Systems Imaging Industry Revenue Share (%), by Country 2024 & 2032
- Figure 14: Asia Pacific APAC Open Systems Imaging Industry Volume Share (%), by Country 2024 & 2032
- Figure 15: South America APAC Open Systems Imaging Industry Revenue (Million), by Country 2024 & 2032
- Figure 16: South America APAC Open Systems Imaging Industry Volume (K Unit), by Country 2024 & 2032
- Figure 17: South America APAC Open Systems Imaging Industry Revenue Share (%), by Country 2024 & 2032
- Figure 18: South America APAC Open Systems Imaging Industry Volume Share (%), by Country 2024 & 2032
- Figure 19: North America APAC Open Systems Imaging Industry Revenue (Million), by Country 2024 & 2032
- Figure 20: North America APAC Open Systems Imaging Industry Volume (K Unit), by Country 2024 & 2032
- Figure 21: North America APAC Open Systems Imaging Industry Revenue Share (%), by Country 2024 & 2032
- Figure 22: North America APAC Open Systems Imaging Industry Volume Share (%), by Country 2024 & 2032
- Figure 23: MEA APAC Open Systems Imaging Industry Revenue (Million), by Country 2024 & 2032
- Figure 24: MEA APAC Open Systems Imaging Industry Volume (K Unit), by Country 2024 & 2032
- Figure 25: MEA APAC Open Systems Imaging Industry Revenue Share (%), by Country 2024 & 2032
- Figure 26: MEA APAC Open Systems Imaging Industry Volume Share (%), by Country 2024 & 2032
- Figure 27: Asia Pacific APAC Open Systems Imaging Industry Revenue (Million), by Resolution 2024 & 2032
- Figure 28: Asia Pacific APAC Open Systems Imaging Industry Volume (K Unit), by Resolution 2024 & 2032
- Figure 29: Asia Pacific APAC Open Systems Imaging Industry Revenue Share (%), by Resolution 2024 & 2032
- Figure 30: Asia Pacific APAC Open Systems Imaging Industry Volume Share (%), by Resolution 2024 & 2032
- Figure 31: Asia Pacific APAC Open Systems Imaging Industry Revenue (Million), by Application 2024 & 2032
- Figure 32: Asia Pacific APAC Open Systems Imaging Industry Volume (K Unit), by Application 2024 & 2032
- Figure 33: Asia Pacific APAC Open Systems Imaging Industry Revenue Share (%), by Application 2024 & 2032
- Figure 34: Asia Pacific APAC Open Systems Imaging Industry Volume Share (%), by Application 2024 & 2032
- Figure 35: Asia Pacific APAC Open Systems Imaging Industry Revenue (Million), by Geography 2024 & 2032
- Figure 36: Asia Pacific APAC Open Systems Imaging Industry Volume (K Unit), by Geography 2024 & 2032
- Figure 37: Asia Pacific APAC Open Systems Imaging Industry Revenue Share (%), by Geography 2024 & 2032
- Figure 38: Asia Pacific APAC Open Systems Imaging Industry Volume Share (%), by Geography 2024 & 2032
- Figure 39: Asia Pacific APAC Open Systems Imaging Industry Revenue (Million), by Country 2024 & 2032
- Figure 40: Asia Pacific APAC Open Systems Imaging Industry Volume (K Unit), by Country 2024 & 2032
- Figure 41: Asia Pacific APAC Open Systems Imaging Industry Revenue Share (%), by Country 2024 & 2032
- Figure 42: Asia Pacific APAC Open Systems Imaging Industry Volume Share (%), by Country 2024 & 2032
List of Tables
- Table 1: Global APAC Open Systems Imaging Industry Revenue Million Forecast, by Region 2019 & 2032
- Table 2: Global APAC Open Systems Imaging Industry Volume K Unit Forecast, by Region 2019 & 2032
- Table 3: Global APAC Open Systems Imaging Industry Revenue Million Forecast, by Resolution 2019 & 2032
- Table 4: Global APAC Open Systems Imaging Industry Volume K Unit Forecast, by Resolution 2019 & 2032
- Table 5: Global APAC Open Systems Imaging Industry Revenue Million Forecast, by Application 2019 & 2032
- Table 6: Global APAC Open Systems Imaging Industry Volume K Unit Forecast, by Application 2019 & 2032
- Table 7: Global APAC Open Systems Imaging Industry Revenue Million Forecast, by Geography 2019 & 2032
- Table 8: Global APAC Open Systems Imaging Industry Volume K Unit Forecast, by Geography 2019 & 2032
- Table 9: Global APAC Open Systems Imaging Industry Revenue Million Forecast, by Region 2019 & 2032
- Table 10: Global APAC Open Systems Imaging Industry Volume K Unit Forecast, by Region 2019 & 2032
- Table 11: Global APAC Open Systems Imaging Industry Revenue Million Forecast, by Country 2019 & 2032
- Table 12: Global APAC Open Systems Imaging Industry Volume K Unit Forecast, by Country 2019 & 2032
- Table 13: United States APAC Open Systems Imaging Industry Revenue (Million) Forecast, by Application 2019 & 2032
- Table 14: United States APAC Open Systems Imaging Industry Volume (K Unit) Forecast, by Application 2019 & 2032
- Table 15: Canada APAC Open Systems Imaging Industry Revenue (Million) Forecast, by Application 2019 & 2032
- Table 16: Canada APAC Open Systems Imaging Industry Volume (K Unit) Forecast, by Application 2019 & 2032
- Table 17: Mexico APAC Open Systems Imaging Industry Revenue (Million) Forecast, by Application 2019 & 2032
- Table 18: Mexico APAC Open Systems Imaging Industry Volume (K Unit) Forecast, by Application 2019 & 2032
- Table 19: Global APAC Open Systems Imaging Industry Revenue Million Forecast, by Country 2019 & 2032
- Table 20: Global APAC Open Systems Imaging Industry Volume K Unit Forecast, by Country 2019 & 2032
- Table 21: Germany APAC Open Systems Imaging Industry Revenue (Million) Forecast, by Application 2019 & 2032
- Table 22: Germany APAC Open Systems Imaging Industry Volume (K Unit) Forecast, by Application 2019 & 2032
- Table 23: United Kingdom APAC Open Systems Imaging Industry Revenue (Million) Forecast, by Application 2019 & 2032
- Table 24: United Kingdom APAC Open Systems Imaging Industry Volume (K Unit) Forecast, by Application 2019 & 2032
- Table 25: France APAC Open Systems Imaging Industry Revenue (Million) Forecast, by Application 2019 & 2032
- Table 26: France APAC Open Systems Imaging Industry Volume (K Unit) Forecast, by Application 2019 & 2032
- Table 27: Spain APAC Open Systems Imaging Industry Revenue (Million) Forecast, by Application 2019 & 2032
- Table 28: Spain APAC Open Systems Imaging Industry Volume (K Unit) Forecast, by Application 2019 & 2032
- Table 29: Italy APAC Open Systems Imaging Industry Revenue (Million) Forecast, by Application 2019 & 2032
- Table 30: Italy APAC Open Systems Imaging Industry Volume (K Unit) Forecast, by Application 2019 & 2032
- Table 31: Spain APAC Open Systems Imaging Industry Revenue (Million) Forecast, by Application 2019 & 2032
- Table 32: Spain APAC Open Systems Imaging Industry Volume (K Unit) Forecast, by Application 2019 & 2032
- Table 33: Belgium APAC Open Systems Imaging Industry Revenue (Million) Forecast, by Application 2019 & 2032
- Table 34: Belgium APAC Open Systems Imaging Industry Volume (K Unit) Forecast, by Application 2019 & 2032
- Table 35: Netherland APAC Open Systems Imaging Industry Revenue (Million) Forecast, by Application 2019 & 2032
- Table 36: Netherland APAC Open Systems Imaging Industry Volume (K Unit) Forecast, by Application 2019 & 2032
- Table 37: Nordics APAC Open Systems Imaging Industry Revenue (Million) Forecast, by Application 2019 & 2032
- Table 38: Nordics APAC Open Systems Imaging Industry Volume (K Unit) Forecast, by Application 2019 & 2032
- Table 39: Rest of Europe APAC Open Systems Imaging Industry Revenue (Million) Forecast, by Application 2019 & 2032
- Table 40: Rest of Europe APAC Open Systems Imaging Industry Volume (K Unit) Forecast, by Application 2019 & 2032
- Table 41: Global APAC Open Systems Imaging Industry Revenue Million Forecast, by Country 2019 & 2032
- Table 42: Global APAC Open Systems Imaging Industry Volume K Unit Forecast, by Country 2019 & 2032
- Table 43: China APAC Open Systems Imaging Industry Revenue (Million) Forecast, by Application 2019 & 2032
- Table 44: China APAC Open Systems Imaging Industry Volume (K Unit) Forecast, by Application 2019 & 2032
- Table 45: Japan APAC Open Systems Imaging Industry Revenue (Million) Forecast, by Application 2019 & 2032
- Table 46: Japan APAC Open Systems Imaging Industry Volume (K Unit) Forecast, by Application 2019 & 2032
- Table 47: India APAC Open Systems Imaging Industry Revenue (Million) Forecast, by Application 2019 & 2032
- Table 48: India APAC Open Systems Imaging Industry Volume (K Unit) Forecast, by Application 2019 & 2032
- Table 49: South Korea APAC Open Systems Imaging Industry Revenue (Million) Forecast, by Application 2019 & 2032
- Table 50: South Korea APAC Open Systems Imaging Industry Volume (K Unit) Forecast, by Application 2019 & 2032
- Table 51: Southeast Asia APAC Open Systems Imaging Industry Revenue (Million) Forecast, by Application 2019 & 2032
- Table 52: Southeast Asia APAC Open Systems Imaging Industry Volume (K Unit) Forecast, by Application 2019 & 2032
- Table 53: Australia APAC Open Systems Imaging Industry Revenue (Million) Forecast, by Application 2019 & 2032
- Table 54: Australia APAC Open Systems Imaging Industry Volume (K Unit) Forecast, by Application 2019 & 2032
- Table 55: Indonesia APAC Open Systems Imaging Industry Revenue (Million) Forecast, by Application 2019 & 2032
- Table 56: Indonesia APAC Open Systems Imaging Industry Volume (K Unit) Forecast, by Application 2019 & 2032
- Table 57: Phillipes APAC Open Systems Imaging Industry Revenue (Million) Forecast, by Application 2019 & 2032
- Table 58: Phillipes APAC Open Systems Imaging Industry Volume (K Unit) Forecast, by Application 2019 & 2032
- Table 59: Singapore APAC Open Systems Imaging Industry Revenue (Million) Forecast, by Application 2019 & 2032
- Table 60: Singapore APAC Open Systems Imaging Industry Volume (K Unit) Forecast, by Application 2019 & 2032
- Table 61: Thailandc APAC Open Systems Imaging Industry Revenue (Million) Forecast, by Application 2019 & 2032
- Table 62: Thailandc APAC Open Systems Imaging Industry Volume (K Unit) Forecast, by Application 2019 & 2032
- Table 63: Rest of Asia Pacific APAC Open Systems Imaging Industry Revenue (Million) Forecast, by Application 2019 & 2032
- Table 64: Rest of Asia Pacific APAC Open Systems Imaging Industry Volume (K Unit) Forecast, by Application 2019 & 2032
- Table 65: Global APAC Open Systems Imaging Industry Revenue Million Forecast, by Country 2019 & 2032
- Table 66: Global APAC Open Systems Imaging Industry Volume K Unit Forecast, by Country 2019 & 2032
- Table 67: Brazil APAC Open Systems Imaging Industry Revenue (Million) Forecast, by Application 2019 & 2032
- Table 68: Brazil APAC Open Systems Imaging Industry Volume (K Unit) Forecast, by Application 2019 & 2032
- Table 69: Argentina APAC Open Systems Imaging Industry Revenue (Million) Forecast, by Application 2019 & 2032
- Table 70: Argentina APAC Open Systems Imaging Industry Volume (K Unit) Forecast, by Application 2019 & 2032
- Table 71: Peru APAC Open Systems Imaging Industry Revenue (Million) Forecast, by Application 2019 & 2032
- Table 72: Peru APAC Open Systems Imaging Industry Volume (K Unit) Forecast, by Application 2019 & 2032
- Table 73: Chile APAC Open Systems Imaging Industry Revenue (Million) Forecast, by Application 2019 & 2032
- Table 74: Chile APAC Open Systems Imaging Industry Volume (K Unit) Forecast, by Application 2019 & 2032
- Table 75: Colombia APAC Open Systems Imaging Industry Revenue (Million) Forecast, by Application 2019 & 2032
- Table 76: Colombia APAC Open Systems Imaging Industry Volume (K Unit) Forecast, by Application 2019 & 2032
- Table 77: Ecuador APAC Open Systems Imaging Industry Revenue (Million) Forecast, by Application 2019 & 2032
- Table 78: Ecuador APAC Open Systems Imaging Industry Volume (K Unit) Forecast, by Application 2019 & 2032
- Table 79: Venezuela APAC Open Systems Imaging Industry Revenue (Million) Forecast, by Application 2019 & 2032
- Table 80: Venezuela APAC Open Systems Imaging Industry Volume (K Unit) Forecast, by Application 2019 & 2032
- Table 81: Rest of South America APAC Open Systems Imaging Industry Revenue (Million) Forecast, by Application 2019 & 2032
- Table 82: Rest of South America APAC Open Systems Imaging Industry Volume (K Unit) Forecast, by Application 2019 & 2032
- Table 83: Global APAC Open Systems Imaging Industry Revenue Million Forecast, by Country 2019 & 2032
- Table 84: Global APAC Open Systems Imaging Industry Volume K Unit Forecast, by Country 2019 & 2032
- Table 85: United States APAC Open Systems Imaging Industry Revenue (Million) Forecast, by Application 2019 & 2032
- Table 86: United States APAC Open Systems Imaging Industry Volume (K Unit) Forecast, by Application 2019 & 2032
- Table 87: Canada APAC Open Systems Imaging Industry Revenue (Million) Forecast, by Application 2019 & 2032
- Table 88: Canada APAC Open Systems Imaging Industry Volume (K Unit) Forecast, by Application 2019 & 2032
- Table 89: Mexico APAC Open Systems Imaging Industry Revenue (Million) Forecast, by Application 2019 & 2032
- Table 90: Mexico APAC Open Systems Imaging Industry Volume (K Unit) Forecast, by Application 2019 & 2032
- Table 91: Global APAC Open Systems Imaging Industry Revenue Million Forecast, by Country 2019 & 2032
- Table 92: Global APAC Open Systems Imaging Industry Volume K Unit Forecast, by Country 2019 & 2032
- Table 93: United Arab Emirates APAC Open Systems Imaging Industry Revenue (Million) Forecast, by Application 2019 & 2032
- Table 94: United Arab Emirates APAC Open Systems Imaging Industry Volume (K Unit) Forecast, by Application 2019 & 2032
- Table 95: Saudi Arabia APAC Open Systems Imaging Industry Revenue (Million) Forecast, by Application 2019 & 2032
- Table 96: Saudi Arabia APAC Open Systems Imaging Industry Volume (K Unit) Forecast, by Application 2019 & 2032
- Table 97: South Africa APAC Open Systems Imaging Industry Revenue (Million) Forecast, by Application 2019 & 2032
- Table 98: South Africa APAC Open Systems Imaging Industry Volume (K Unit) Forecast, by Application 2019 & 2032
- Table 99: Rest of Middle East and Africa APAC Open Systems Imaging Industry Revenue (Million) Forecast, by Application 2019 & 2032
- Table 100: Rest of Middle East and Africa APAC Open Systems Imaging Industry Volume (K Unit) Forecast, by Application 2019 & 2032
- Table 101: Global APAC Open Systems Imaging Industry Revenue Million Forecast, by Resolution 2019 & 2032
- Table 102: Global APAC Open Systems Imaging Industry Volume K Unit Forecast, by Resolution 2019 & 2032
- Table 103: Global APAC Open Systems Imaging Industry Revenue Million Forecast, by Application 2019 & 2032
- Table 104: Global APAC Open Systems Imaging Industry Volume K Unit Forecast, by Application 2019 & 2032
- Table 105: Global APAC Open Systems Imaging Industry Revenue Million Forecast, by Geography 2019 & 2032
- Table 106: Global APAC Open Systems Imaging Industry Volume K Unit Forecast, by Geography 2019 & 2032
- Table 107: Global APAC Open Systems Imaging Industry Revenue Million Forecast, by Country 2019 & 2032
- Table 108: Global APAC Open Systems Imaging Industry Volume K Unit Forecast, by Country 2019 & 2032
- Table 109: China APAC Open Systems Imaging Industry Revenue (Million) Forecast, by Application 2019 & 2032
- Table 110: China APAC Open Systems Imaging Industry Volume (K Unit) Forecast, by Application 2019 & 2032
- Table 111: Japan APAC Open Systems Imaging Industry Revenue (Million) Forecast, by Application 2019 & 2032
- Table 112: Japan APAC Open Systems Imaging Industry Volume (K Unit) Forecast, by Application 2019 & 2032
- Table 113: India APAC Open Systems Imaging Industry Revenue (Million) Forecast, by Application 2019 & 2032
- Table 114: India APAC Open Systems Imaging Industry Volume (K Unit) Forecast, by Application 2019 & 2032
- Table 115: Australia APAC Open Systems Imaging Industry Revenue (Million) Forecast, by Application 2019 & 2032
- Table 116: Australia APAC Open Systems Imaging Industry Volume (K Unit) Forecast, by Application 2019 & 2032
- Table 117: South Korea APAC Open Systems Imaging Industry Revenue (Million) Forecast, by Application 2019 & 2032
- Table 118: South Korea APAC Open Systems Imaging Industry Volume (K Unit) Forecast, by Application 2019 & 2032
- Table 119: Rest of Asia Pacific APAC Open Systems Imaging Industry Revenue (Million) Forecast, by Application 2019 & 2032
- Table 120: Rest of Asia Pacific APAC Open Systems Imaging Industry Volume (K Unit) Forecast, by Application 2019 & 2032
Frequently Asked Questions
1. What is the projected Compound Annual Growth Rate (CAGR) of the APAC Open Systems Imaging Industry?
The projected CAGR is approximately 7.77%.
2. Which companies are prominent players in the APAC Open Systems Imaging Industry?
Key companies in the market include ESAOTE SA, Siemens Healthcare, SHENZHEN BASDA MEDICAL APPARATUS CO LTD, Philips Healthcare, Mindray, Hitachi Medical Corporation, Canon Medical Systems Corporation.
3. What are the main segments of the APAC Open Systems Imaging Industry?
The market segments include Resolution, Application, Geography.
4. Can you provide details about the market size?
The market size is estimated to be USD 338.09 Million as of 2022.
5. What are some drivers contributing to market growth?
; Increasing Number of MRI Procedures; Increasing Applications in Clinical Diagnosis and Increasing Disease Burden.
6. What are the notable trends driving market growth?
Application in Neurology is Expected to Dominate the Asia Pacific Open System MRI Market.
7. Are there any restraints impacting market growth?
; High Cost of Open MRI Systems.
8. Can you provide examples of recent developments in the market?
N/A
9. What pricing options are available for accessing the report?
Pricing options include single-user, multi-user, and enterprise licenses priced at USD 4750, USD 5250, and USD 8750 respectively.
10. Is the market size provided in terms of value or volume?
The market size is provided in terms of value, measured in Million and volume, measured in K Unit.
11. Are there any specific market keywords associated with the report?
Yes, the market keyword associated with the report is "APAC Open Systems Imaging Industry," which aids in identifying and referencing the specific market segment covered.
12. How do I determine which pricing option suits my needs best?
The pricing options vary based on user requirements and access needs. Individual users may opt for single-user licenses, while businesses requiring broader access may choose multi-user or enterprise licenses for cost-effective access to the report.
13. Are there any additional resources or data provided in the APAC Open Systems Imaging Industry report?
While the report offers comprehensive insights, it's advisable to review the specific contents or supplementary materials provided to ascertain if additional resources or data are available.
14. How can I stay updated on further developments or reports in the APAC Open Systems Imaging Industry?
To stay informed about further developments, trends, and reports in the APAC Open Systems Imaging Industry, consider subscribing to industry newsletters, following relevant companies and organizations, or regularly checking reputable industry news sources and publications.
Methodology
Step 1 - Identification of Relevant Samples Size from Population Database


Step 2 - Approaches for Defining Global Market Size (Value, Volume* & Price*)

Note*: In applicable scenarios
Step 3 - Data Sources
Primary Research
- Web Analytics
- Survey Reports
- Research Institute
- Latest Research Reports
- Opinion Leaders
Secondary Research
- Annual Reports
- White Paper
- Latest Press Release
- Industry Association
- Paid Database
- Investor Presentations

Step 4 - Data Triangulation
Involves using different sources of information in order to increase the validity of a study
These sources are likely to be stakeholders in a program - participants, other researchers, program staff, other community members, and so on.
Then we put all data in single framework & apply various statistical tools to find out the dynamic on the market.
During the analysis stage, feedback from the stakeholder groups would be compared to determine areas of agreement as well as areas of divergence


