
Key Insights
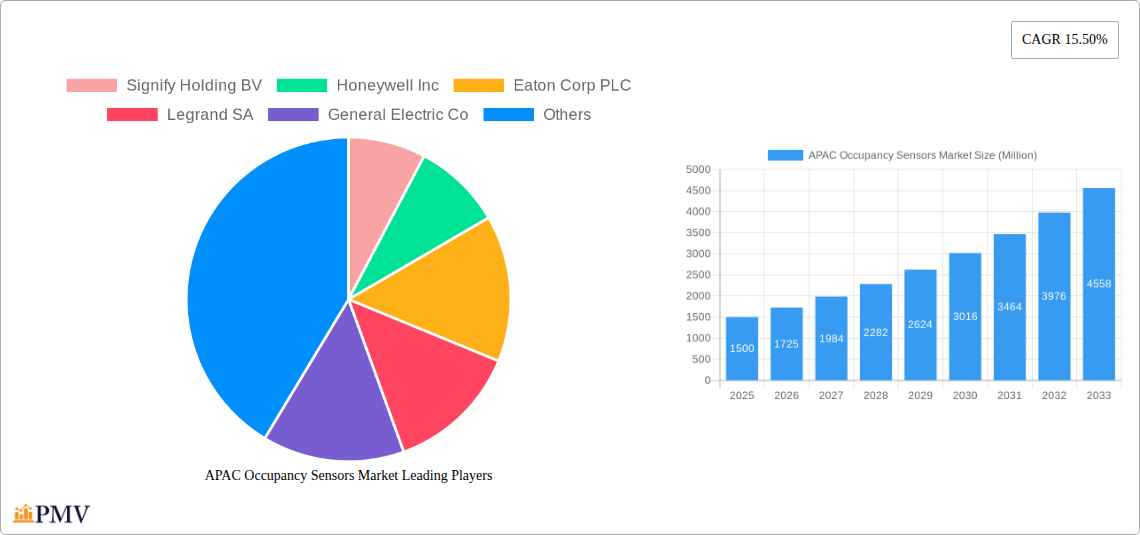
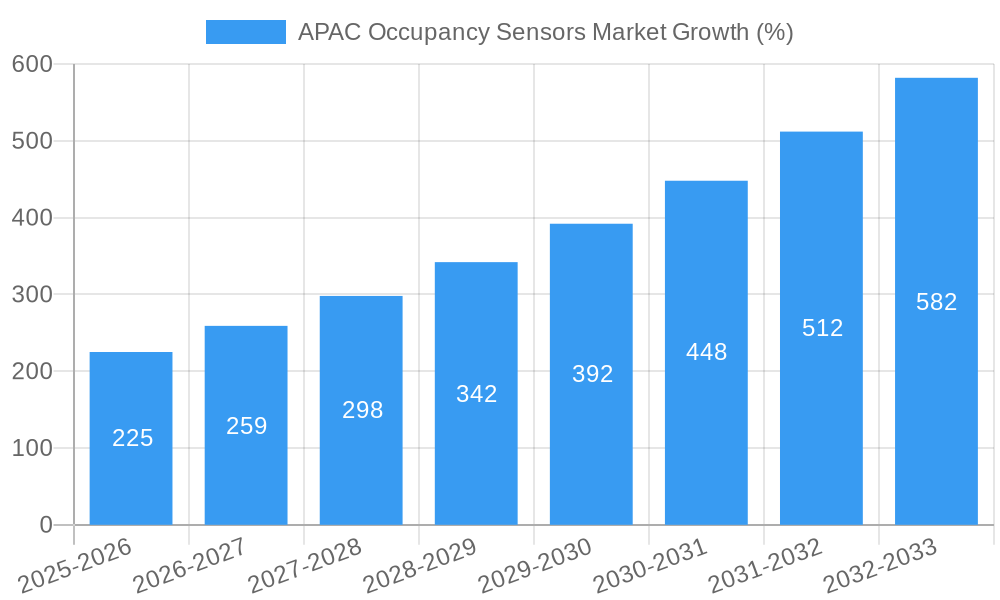
The Asia-Pacific (APAC) occupancy sensor market is experiencing robust growth, driven by increasing energy efficiency concerns, rising adoption of smart building technologies, and stringent government regulations promoting sustainable infrastructure. The market's Compound Annual Growth Rate (CAGR) of 15.50% from 2019 to 2024 indicates a significant upward trajectory. This growth is particularly pronounced in rapidly developing economies like China, India, and Japan, where the construction sector is booming and smart building adoption is accelerating. Key market segments, such as wireless occupancy sensors and those utilized in commercial buildings, are experiencing above-average growth. The preference for wireless solutions stems from their ease of installation and flexibility, while the commercial sector’s high concentration of buildings makes it a lucrative market for occupancy sensor deployments. The integration of occupancy sensors with Building Management Systems (BMS) further enhances their value proposition, enabling real-time monitoring and automated control of lighting, HVAC, and security systems. While the initial investment cost can be a restraint, the long-term cost savings achieved through energy efficiency are compelling businesses and homeowners alike to adopt these technologies. Future growth will likely be fueled by advancements in sensor technology, such as improved accuracy and longer battery life, as well as the increasing adoption of Internet of Things (IoT) platforms for seamless data integration and remote management.
The competitive landscape is characterized by both established players and emerging technology providers. Major players like Signify Holding BV, Honeywell Inc., and Schneider Electric SE are leveraging their existing market presence and expertise to expand their product portfolios. Simultaneously, smaller companies are introducing innovative sensor technologies and solutions. The focus on developing energy-efficient, user-friendly, and cost-effective occupancy sensors will be critical for success in this rapidly evolving market. Considering the market's strong growth drivers and the projected CAGR, the APAC occupancy sensor market is poised for continued expansion throughout the forecast period (2025-2033). Further market segmentation by specific building types (hospitals, schools, etc.) and applications (industrial automation, etc.) would provide even deeper insights into market dynamics and growth potential within individual segments.
APAC Occupancy Sensors Market: A Comprehensive Report (2019-2033)
This in-depth report provides a comprehensive analysis of the Asia-Pacific (APAC) occupancy sensors market, offering invaluable insights for businesses, investors, and stakeholders seeking to navigate this dynamic sector. The report covers the period from 2019 to 2033, with a focus on the forecast period of 2025-2033 and a base year of 2025. Market sizes are presented in Millions.
APAC Occupancy Sensors Market Market Structure & Competitive Dynamics
The APAC occupancy sensors market exhibits a moderately consolidated structure, with several key players vying for market share. Market concentration is influenced by factors such as technological innovation, regulatory frameworks, and the prevalence of mergers and acquisitions (M&A) activities. The market is witnessing a significant influx of innovative solutions, driven by the increasing demand for energy-efficient and smart building technologies. Regulatory frameworks focused on energy conservation and sustainability are further propelling market growth. Product substitution, primarily from legacy technologies to more sophisticated smart sensors, is a notable trend. End-user preferences are shifting towards integrated systems offering enhanced data analytics and automation capabilities.
M&A activities have played a crucial role in shaping the competitive landscape, with deal values ranging from xx Million to xx Million in recent years. Major players are focusing on strategic acquisitions to expand their product portfolios, technological capabilities, and market reach. Key players such as Signify, Honeywell, and Schneider Electric are aggressively pursuing both organic growth and inorganic expansion strategies. The market share distribution is currently estimated as follows: Signify (xx%), Honeywell (xx%), Schneider Electric (xx%), and others (xx%). These figures are subject to change based on future developments.
APAC Occupancy Sensors Market Industry Trends & Insights
The APAC occupancy sensors market is experiencing robust growth, driven by several key factors. The compound annual growth rate (CAGR) is projected to be xx% during the forecast period (2025-2033). This growth is fueled by factors including rising urbanization, increasing construction activities across commercial and residential sectors, growing demand for energy-efficient buildings, and the escalating adoption of smart building technologies. Technological disruptions, particularly advancements in sensor technologies (e.g., improved accuracy, longer battery life), are streamlining integration and enhancing overall performance. Consumer preferences are tilting towards smart and energy-efficient solutions, creating a favorable market environment. The competitive landscape is highly dynamic, with companies constantly innovating to enhance their offerings and expand market reach. Market penetration is expected to increase significantly in the coming years, particularly in developing economies across the APAC region.
Dominant Markets & Segments in APAC Occupancy Sensors Market
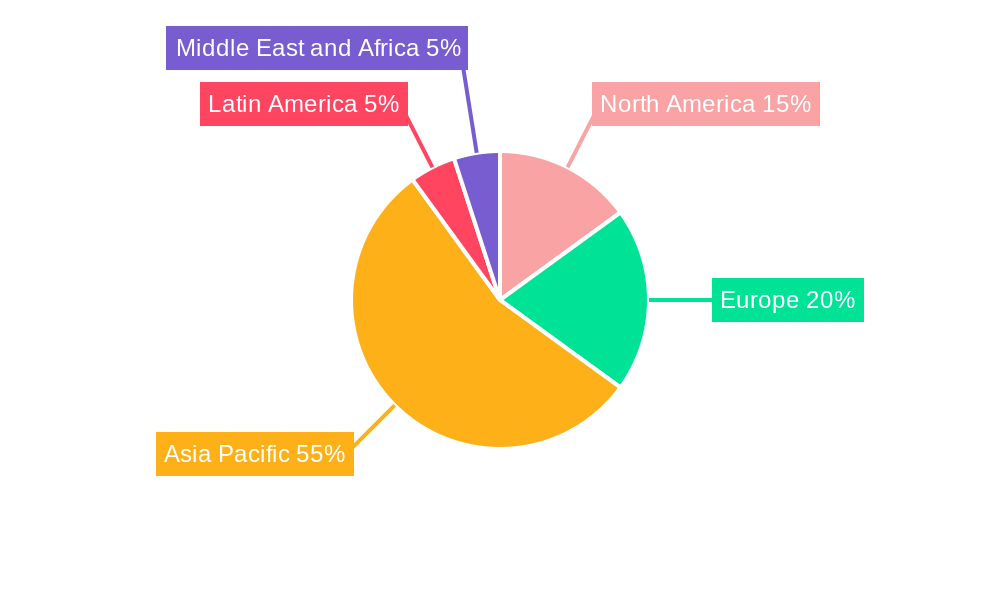
By Country: China remains the dominant market, driven by rapid urbanization, significant construction investments, and government support for smart city initiatives. Japan follows as a significant market due to its advanced building infrastructure and high adoption of smart technologies. India shows high potential for growth due to expanding infrastructure development and burgeoning commercial construction.
By Building Type: The Commercial segment holds the largest market share, driven by the increasing adoption of occupancy sensors in offices, malls, and other commercial establishments to optimize energy consumption and improve operational efficiency. The Residential segment is also witnessing robust growth, fueled by rising disposable incomes and increasing preference for smart homes.
By Technology: Passive Infrared (PIR) sensors dominate the market due to their cost-effectiveness and reliability. However, Ultrasonic and Microwave technologies are gaining traction due to their ability to function effectively in challenging environmental conditions.
By Application: Lighting control applications dominate, reflecting the significant energy savings potential of occupancy-based lighting systems. HVAC and security and surveillance applications are also experiencing substantial growth.
By Network Type: Wireless sensors are witnessing higher adoption rates compared to wired sensors, primarily driven by ease of installation, flexibility, and lower installation costs.
APAC Occupancy Sensors Market Product Innovations
Recent product developments emphasize miniaturization, enhanced accuracy, improved energy efficiency, and seamless integration with building management systems (BMS). Smart sensor technologies with integrated data analytics capabilities are gaining popularity, allowing for better energy optimization, space utilization, and security management. The market is witnessing a shift towards IoT-enabled sensors that offer remote monitoring and control capabilities. The integration of various sensor types within a single unit, such as combined occupancy, temperature, and light sensors, is another notable trend. This trend enhances cost-effectiveness and streamlined installation for building owners and operators.
Report Segmentation & Scope
This report segments the APAC occupancy sensors market across various parameters:
By Network Type: Wired and Wireless, each segment’s growth is analyzed based on market size, adoption rates, and competitive dynamics.
By Technology: Ultrasonic, Passive Infrared (PIR), and Microwave, detailing the strengths, weaknesses, and market share of each technology.
By Application: Lighting Control, HVAC, and Security and Surveillance, projecting growth based on specific industry trends and adoption rates.
By Building Type: Residential and Commercial, providing a detailed analysis of the market size and future growth prospects for each sector.
By Country: China, Japan, India, and the Rest of Asia Pacific, offering a regional breakdown with specific growth projections for each region.
Key Drivers of APAC Occupancy Sensors Market Growth
The APAC occupancy sensors market is driven by several factors, including stringent government regulations promoting energy efficiency, the increasing adoption of smart building technologies, rising urbanization and construction activities, and cost-saving measures encouraged by escalating energy prices. Technological advancements lead to smaller, more accurate, and energy-efficient sensors. The need for improved security and optimized workspace efficiency across commercial establishments is also influencing the expansion of the market.
Challenges in the APAC Occupancy Sensors Market Sector
Despite the promising growth prospects, the APAC occupancy sensors market faces certain challenges. High initial investment costs can hinder adoption, particularly in smaller businesses. Supply chain disruptions and the availability of skilled labor for installation and maintenance can also create constraints. Furthermore, interoperability issues between different sensor systems and building management systems can pose integration challenges. Competitive pressures from numerous manufacturers also exist, leading to price competition and demanding product innovation.
Leading Players in the APAC Occupancy Sensors Market Market
- Signify Holding BV
- Honeywell Inc
- Eaton Corp PLC
- Legrand SA
- General Electric Co
- Dwyer Instruments Inc
- Schneider Electric SE
- Johnson Controls Inc
- Analog Devices Inc
- Texas Instruments Inc
- *List Not Exhaustive
Key Developments in APAC Occupancy Sensors Market Sector
- March 2020: Signify introduced new Philips IoT sensor packages that gather and deliver data via the Interact Office connected lighting system and environmental monitoring APIs. The sensor bundles can observe occupancy, the total of people in the room, temperature (at the room and desk level), noise levels, daylight levels, relative humidity, and are Bluetooth enabled, allowing for indoor positioning and navigation.
Strategic APAC Occupancy Sensors Market Market Outlook
The APAC occupancy sensors market holds significant future potential, fueled by continued urbanization, smart city initiatives, and the increasing focus on energy efficiency and sustainability. Strategic opportunities lie in developing innovative sensor technologies with advanced analytics capabilities, expanding into emerging markets within the APAC region, and forging strategic partnerships to enhance market penetration. The integration of AI and machine learning capabilities into occupancy sensor systems presents a significant avenue for future growth. Companies focusing on developing integrated solutions that offer seamless interoperability with BMS and other building technologies will be well-positioned for success.
APAC Occupancy Sensors Market Segmentation
-
1. Network Type
- 1.1. Wired
- 1.2. Wireless
-
2. Technology
- 2.1. Ultrasonic
- 2.2. Passive Infrared
- 2.3. Microwave
-
3. Application
- 3.1. Lighting Control
- 3.2. HVAC
- 3.3. Security and Surveillance
-
4. Building Type
- 4.1. Residential
- 4.2. Commercial
APAC Occupancy Sensors Market Segmentation By Geography
-
1. North America
- 1.1. United States
- 1.2. Canada
- 1.3. Mexico
-
2. South America
- 2.1. Brazil
- 2.2. Argentina
- 2.3. Rest of South America
-
3. Europe
- 3.1. United Kingdom
- 3.2. Germany
- 3.3. France
- 3.4. Italy
- 3.5. Spain
- 3.6. Russia
- 3.7. Benelux
- 3.8. Nordics
- 3.9. Rest of Europe
-
4. Middle East & Africa
- 4.1. Turkey
- 4.2. Israel
- 4.3. GCC
- 4.4. North Africa
- 4.5. South Africa
- 4.6. Rest of Middle East & Africa
-
5. Asia Pacific
- 5.1. China
- 5.2. India
- 5.3. Japan
- 5.4. South Korea
- 5.5. ASEAN
- 5.6. Oceania
- 5.7. Rest of Asia Pacific
APAC Occupancy Sensors Market REPORT HIGHLIGHTS
| Aspects | Details |
|---|---|
| Study Period | 2019-2033 |
| Base Year | 2024 |
| Estimated Year | 2025 |
| Forecast Period | 2025-2033 |
| Historical Period | 2019-2024 |
| Growth Rate | CAGR of 15.50% from 2019-2033 |
| Segmentation |
|
Table of Contents
- 1. Introduction
- 1.1. Research Scope
- 1.2. Market Segmentation
- 1.3. Research Methodology
- 1.4. Definitions and Assumptions
- 2. Executive Summary
- 2.1. Introduction
- 3. Market Dynamics
- 3.1. Introduction
- 3.2. Market Drivers
- 3.2.1. Rising Demand for Energy Efficient Devices; Demand for Passive Infrared Due to Low Cost and High Energy Efficiency
- 3.3. Market Restrains
- 3.3.1. Cryptojacking Threats
- 3.4. Market Trends
- 3.4.1. Residential Expected to Witness Significant Growth
- 4. Market Factor Analysis
- 4.1. Porters Five Forces
- 4.2. Supply/Value Chain
- 4.3. PESTEL analysis
- 4.4. Market Entropy
- 4.5. Patent/Trademark Analysis
- 5. Global APAC Occupancy Sensors Market Analysis, Insights and Forecast, 2019-2031
- 5.1. Market Analysis, Insights and Forecast - by Network Type
- 5.1.1. Wired
- 5.1.2. Wireless
- 5.2. Market Analysis, Insights and Forecast - by Technology
- 5.2.1. Ultrasonic
- 5.2.2. Passive Infrared
- 5.2.3. Microwave
- 5.3. Market Analysis, Insights and Forecast - by Application
- 5.3.1. Lighting Control
- 5.3.2. HVAC
- 5.3.3. Security and Surveillance
- 5.4. Market Analysis, Insights and Forecast - by Building Type
- 5.4.1. Residential
- 5.4.2. Commercial
- 5.5. Market Analysis, Insights and Forecast - by Region
- 5.5.1. North America
- 5.5.2. South America
- 5.5.3. Europe
- 5.5.4. Middle East & Africa
- 5.5.5. Asia Pacific
- 5.1. Market Analysis, Insights and Forecast - by Network Type
- 6. North America APAC Occupancy Sensors Market Analysis, Insights and Forecast, 2019-2031
- 6.1. Market Analysis, Insights and Forecast - by Network Type
- 6.1.1. Wired
- 6.1.2. Wireless
- 6.2. Market Analysis, Insights and Forecast - by Technology
- 6.2.1. Ultrasonic
- 6.2.2. Passive Infrared
- 6.2.3. Microwave
- 6.3. Market Analysis, Insights and Forecast - by Application
- 6.3.1. Lighting Control
- 6.3.2. HVAC
- 6.3.3. Security and Surveillance
- 6.4. Market Analysis, Insights and Forecast - by Building Type
- 6.4.1. Residential
- 6.4.2. Commercial
- 6.1. Market Analysis, Insights and Forecast - by Network Type
- 7. South America APAC Occupancy Sensors Market Analysis, Insights and Forecast, 2019-2031
- 7.1. Market Analysis, Insights and Forecast - by Network Type
- 7.1.1. Wired
- 7.1.2. Wireless
- 7.2. Market Analysis, Insights and Forecast - by Technology
- 7.2.1. Ultrasonic
- 7.2.2. Passive Infrared
- 7.2.3. Microwave
- 7.3. Market Analysis, Insights and Forecast - by Application
- 7.3.1. Lighting Control
- 7.3.2. HVAC
- 7.3.3. Security and Surveillance
- 7.4. Market Analysis, Insights and Forecast - by Building Type
- 7.4.1. Residential
- 7.4.2. Commercial
- 7.1. Market Analysis, Insights and Forecast - by Network Type
- 8. Europe APAC Occupancy Sensors Market Analysis, Insights and Forecast, 2019-2031
- 8.1. Market Analysis, Insights and Forecast - by Network Type
- 8.1.1. Wired
- 8.1.2. Wireless
- 8.2. Market Analysis, Insights and Forecast - by Technology
- 8.2.1. Ultrasonic
- 8.2.2. Passive Infrared
- 8.2.3. Microwave
- 8.3. Market Analysis, Insights and Forecast - by Application
- 8.3.1. Lighting Control
- 8.3.2. HVAC
- 8.3.3. Security and Surveillance
- 8.4. Market Analysis, Insights and Forecast - by Building Type
- 8.4.1. Residential
- 8.4.2. Commercial
- 8.1. Market Analysis, Insights and Forecast - by Network Type
- 9. Middle East & Africa APAC Occupancy Sensors Market Analysis, Insights and Forecast, 2019-2031
- 9.1. Market Analysis, Insights and Forecast - by Network Type
- 9.1.1. Wired
- 9.1.2. Wireless
- 9.2. Market Analysis, Insights and Forecast - by Technology
- 9.2.1. Ultrasonic
- 9.2.2. Passive Infrared
- 9.2.3. Microwave
- 9.3. Market Analysis, Insights and Forecast - by Application
- 9.3.1. Lighting Control
- 9.3.2. HVAC
- 9.3.3. Security and Surveillance
- 9.4. Market Analysis, Insights and Forecast - by Building Type
- 9.4.1. Residential
- 9.4.2. Commercial
- 9.1. Market Analysis, Insights and Forecast - by Network Type
- 10. Asia Pacific APAC Occupancy Sensors Market Analysis, Insights and Forecast, 2019-2031
- 10.1. Market Analysis, Insights and Forecast - by Network Type
- 10.1.1. Wired
- 10.1.2. Wireless
- 10.2. Market Analysis, Insights and Forecast - by Technology
- 10.2.1. Ultrasonic
- 10.2.2. Passive Infrared
- 10.2.3. Microwave
- 10.3. Market Analysis, Insights and Forecast - by Application
- 10.3.1. Lighting Control
- 10.3.2. HVAC
- 10.3.3. Security and Surveillance
- 10.4. Market Analysis, Insights and Forecast - by Building Type
- 10.4.1. Residential
- 10.4.2. Commercial
- 10.1. Market Analysis, Insights and Forecast - by Network Type
- 11. North America APAC Occupancy Sensors Market Analysis, Insights and Forecast, 2019-2031
- 11.1. Market Analysis, Insights and Forecast - By Country/Sub-region
- 11.1.1.
- 12. Europe APAC Occupancy Sensors Market Analysis, Insights and Forecast, 2019-2031
- 12.1. Market Analysis, Insights and Forecast - By Country/Sub-region
- 12.1.1.
- 13. Asia Pacific APAC Occupancy Sensors Market Analysis, Insights and Forecast, 2019-2031
- 13.1. Market Analysis, Insights and Forecast - By Country/Sub-region
- 13.1.1.
- 14. Latin America APAC Occupancy Sensors Market Analysis, Insights and Forecast, 2019-2031
- 14.1. Market Analysis, Insights and Forecast - By Country/Sub-region
- 14.1.1.
- 15. Middle East and Africa APAC Occupancy Sensors Market Analysis, Insights and Forecast, 2019-2031
- 15.1. Market Analysis, Insights and Forecast - By Country/Sub-region
- 15.1.1.
- 16. Competitive Analysis
- 16.1. Global Market Share Analysis 2024
- 16.2. Company Profiles
- 16.2.1 Signify Holding BV
- 16.2.1.1. Overview
- 16.2.1.2. Products
- 16.2.1.3. SWOT Analysis
- 16.2.1.4. Recent Developments
- 16.2.1.5. Financials (Based on Availability)
- 16.2.2 Honeywell Inc
- 16.2.2.1. Overview
- 16.2.2.2. Products
- 16.2.2.3. SWOT Analysis
- 16.2.2.4. Recent Developments
- 16.2.2.5. Financials (Based on Availability)
- 16.2.3 Eaton Corp PLC
- 16.2.3.1. Overview
- 16.2.3.2. Products
- 16.2.3.3. SWOT Analysis
- 16.2.3.4. Recent Developments
- 16.2.3.5. Financials (Based on Availability)
- 16.2.4 Legrand SA
- 16.2.4.1. Overview
- 16.2.4.2. Products
- 16.2.4.3. SWOT Analysis
- 16.2.4.4. Recent Developments
- 16.2.4.5. Financials (Based on Availability)
- 16.2.5 General Electric Co
- 16.2.5.1. Overview
- 16.2.5.2. Products
- 16.2.5.3. SWOT Analysis
- 16.2.5.4. Recent Developments
- 16.2.5.5. Financials (Based on Availability)
- 16.2.6 Dwyer Instruments Inc
- 16.2.6.1. Overview
- 16.2.6.2. Products
- 16.2.6.3. SWOT Analysis
- 16.2.6.4. Recent Developments
- 16.2.6.5. Financials (Based on Availability)
- 16.2.7 Schneider Electric SE
- 16.2.7.1. Overview
- 16.2.7.2. Products
- 16.2.7.3. SWOT Analysis
- 16.2.7.4. Recent Developments
- 16.2.7.5. Financials (Based on Availability)
- 16.2.8 Johnson Controls Inc
- 16.2.8.1. Overview
- 16.2.8.2. Products
- 16.2.8.3. SWOT Analysis
- 16.2.8.4. Recent Developments
- 16.2.8.5. Financials (Based on Availability)
- 16.2.9 Analog Devices Inc
- 16.2.9.1. Overview
- 16.2.9.2. Products
- 16.2.9.3. SWOT Analysis
- 16.2.9.4. Recent Developments
- 16.2.9.5. Financials (Based on Availability)
- 16.2.10 Texas Instruments Inc*List Not Exhaustive
- 16.2.10.1. Overview
- 16.2.10.2. Products
- 16.2.10.3. SWOT Analysis
- 16.2.10.4. Recent Developments
- 16.2.10.5. Financials (Based on Availability)
- 16.2.1 Signify Holding BV
List of Figures
- Figure 1: Global APAC Occupancy Sensors Market Revenue Breakdown (Million, %) by Region 2024 & 2032
- Figure 2: North America APAC Occupancy Sensors Market Revenue (Million), by Country 2024 & 2032
- Figure 3: North America APAC Occupancy Sensors Market Revenue Share (%), by Country 2024 & 2032
- Figure 4: Europe APAC Occupancy Sensors Market Revenue (Million), by Country 2024 & 2032
- Figure 5: Europe APAC Occupancy Sensors Market Revenue Share (%), by Country 2024 & 2032
- Figure 6: Asia Pacific APAC Occupancy Sensors Market Revenue (Million), by Country 2024 & 2032
- Figure 7: Asia Pacific APAC Occupancy Sensors Market Revenue Share (%), by Country 2024 & 2032
- Figure 8: Latin America APAC Occupancy Sensors Market Revenue (Million), by Country 2024 & 2032
- Figure 9: Latin America APAC Occupancy Sensors Market Revenue Share (%), by Country 2024 & 2032
- Figure 10: Middle East and Africa APAC Occupancy Sensors Market Revenue (Million), by Country 2024 & 2032
- Figure 11: Middle East and Africa APAC Occupancy Sensors Market Revenue Share (%), by Country 2024 & 2032
- Figure 12: North America APAC Occupancy Sensors Market Revenue (Million), by Network Type 2024 & 2032
- Figure 13: North America APAC Occupancy Sensors Market Revenue Share (%), by Network Type 2024 & 2032
- Figure 14: North America APAC Occupancy Sensors Market Revenue (Million), by Technology 2024 & 2032
- Figure 15: North America APAC Occupancy Sensors Market Revenue Share (%), by Technology 2024 & 2032
- Figure 16: North America APAC Occupancy Sensors Market Revenue (Million), by Application 2024 & 2032
- Figure 17: North America APAC Occupancy Sensors Market Revenue Share (%), by Application 2024 & 2032
- Figure 18: North America APAC Occupancy Sensors Market Revenue (Million), by Building Type 2024 & 2032
- Figure 19: North America APAC Occupancy Sensors Market Revenue Share (%), by Building Type 2024 & 2032
- Figure 20: North America APAC Occupancy Sensors Market Revenue (Million), by Country 2024 & 2032
- Figure 21: North America APAC Occupancy Sensors Market Revenue Share (%), by Country 2024 & 2032
- Figure 22: South America APAC Occupancy Sensors Market Revenue (Million), by Network Type 2024 & 2032
- Figure 23: South America APAC Occupancy Sensors Market Revenue Share (%), by Network Type 2024 & 2032
- Figure 24: South America APAC Occupancy Sensors Market Revenue (Million), by Technology 2024 & 2032
- Figure 25: South America APAC Occupancy Sensors Market Revenue Share (%), by Technology 2024 & 2032
- Figure 26: South America APAC Occupancy Sensors Market Revenue (Million), by Application 2024 & 2032
- Figure 27: South America APAC Occupancy Sensors Market Revenue Share (%), by Application 2024 & 2032
- Figure 28: South America APAC Occupancy Sensors Market Revenue (Million), by Building Type 2024 & 2032
- Figure 29: South America APAC Occupancy Sensors Market Revenue Share (%), by Building Type 2024 & 2032
- Figure 30: South America APAC Occupancy Sensors Market Revenue (Million), by Country 2024 & 2032
- Figure 31: South America APAC Occupancy Sensors Market Revenue Share (%), by Country 2024 & 2032
- Figure 32: Europe APAC Occupancy Sensors Market Revenue (Million), by Network Type 2024 & 2032
- Figure 33: Europe APAC Occupancy Sensors Market Revenue Share (%), by Network Type 2024 & 2032
- Figure 34: Europe APAC Occupancy Sensors Market Revenue (Million), by Technology 2024 & 2032
- Figure 35: Europe APAC Occupancy Sensors Market Revenue Share (%), by Technology 2024 & 2032
- Figure 36: Europe APAC Occupancy Sensors Market Revenue (Million), by Application 2024 & 2032
- Figure 37: Europe APAC Occupancy Sensors Market Revenue Share (%), by Application 2024 & 2032
- Figure 38: Europe APAC Occupancy Sensors Market Revenue (Million), by Building Type 2024 & 2032
- Figure 39: Europe APAC Occupancy Sensors Market Revenue Share (%), by Building Type 2024 & 2032
- Figure 40: Europe APAC Occupancy Sensors Market Revenue (Million), by Country 2024 & 2032
- Figure 41: Europe APAC Occupancy Sensors Market Revenue Share (%), by Country 2024 & 2032
- Figure 42: Middle East & Africa APAC Occupancy Sensors Market Revenue (Million), by Network Type 2024 & 2032
- Figure 43: Middle East & Africa APAC Occupancy Sensors Market Revenue Share (%), by Network Type 2024 & 2032
- Figure 44: Middle East & Africa APAC Occupancy Sensors Market Revenue (Million), by Technology 2024 & 2032
- Figure 45: Middle East & Africa APAC Occupancy Sensors Market Revenue Share (%), by Technology 2024 & 2032
- Figure 46: Middle East & Africa APAC Occupancy Sensors Market Revenue (Million), by Application 2024 & 2032
- Figure 47: Middle East & Africa APAC Occupancy Sensors Market Revenue Share (%), by Application 2024 & 2032
- Figure 48: Middle East & Africa APAC Occupancy Sensors Market Revenue (Million), by Building Type 2024 & 2032
- Figure 49: Middle East & Africa APAC Occupancy Sensors Market Revenue Share (%), by Building Type 2024 & 2032
- Figure 50: Middle East & Africa APAC Occupancy Sensors Market Revenue (Million), by Country 2024 & 2032
- Figure 51: Middle East & Africa APAC Occupancy Sensors Market Revenue Share (%), by Country 2024 & 2032
- Figure 52: Asia Pacific APAC Occupancy Sensors Market Revenue (Million), by Network Type 2024 & 2032
- Figure 53: Asia Pacific APAC Occupancy Sensors Market Revenue Share (%), by Network Type 2024 & 2032
- Figure 54: Asia Pacific APAC Occupancy Sensors Market Revenue (Million), by Technology 2024 & 2032
- Figure 55: Asia Pacific APAC Occupancy Sensors Market Revenue Share (%), by Technology 2024 & 2032
- Figure 56: Asia Pacific APAC Occupancy Sensors Market Revenue (Million), by Application 2024 & 2032
- Figure 57: Asia Pacific APAC Occupancy Sensors Market Revenue Share (%), by Application 2024 & 2032
- Figure 58: Asia Pacific APAC Occupancy Sensors Market Revenue (Million), by Building Type 2024 & 2032
- Figure 59: Asia Pacific APAC Occupancy Sensors Market Revenue Share (%), by Building Type 2024 & 2032
- Figure 60: Asia Pacific APAC Occupancy Sensors Market Revenue (Million), by Country 2024 & 2032
- Figure 61: Asia Pacific APAC Occupancy Sensors Market Revenue Share (%), by Country 2024 & 2032
List of Tables
- Table 1: Global APAC Occupancy Sensors Market Revenue Million Forecast, by Region 2019 & 2032
- Table 2: Global APAC Occupancy Sensors Market Revenue Million Forecast, by Network Type 2019 & 2032
- Table 3: Global APAC Occupancy Sensors Market Revenue Million Forecast, by Technology 2019 & 2032
- Table 4: Global APAC Occupancy Sensors Market Revenue Million Forecast, by Application 2019 & 2032
- Table 5: Global APAC Occupancy Sensors Market Revenue Million Forecast, by Building Type 2019 & 2032
- Table 6: Global APAC Occupancy Sensors Market Revenue Million Forecast, by Region 2019 & 2032
- Table 7: Global APAC Occupancy Sensors Market Revenue Million Forecast, by Country 2019 & 2032
- Table 8: APAC Occupancy Sensors Market Revenue (Million) Forecast, by Application 2019 & 2032
- Table 9: Global APAC Occupancy Sensors Market Revenue Million Forecast, by Country 2019 & 2032
- Table 10: APAC Occupancy Sensors Market Revenue (Million) Forecast, by Application 2019 & 2032
- Table 11: Global APAC Occupancy Sensors Market Revenue Million Forecast, by Country 2019 & 2032
- Table 12: APAC Occupancy Sensors Market Revenue (Million) Forecast, by Application 2019 & 2032
- Table 13: Global APAC Occupancy Sensors Market Revenue Million Forecast, by Country 2019 & 2032
- Table 14: APAC Occupancy Sensors Market Revenue (Million) Forecast, by Application 2019 & 2032
- Table 15: Global APAC Occupancy Sensors Market Revenue Million Forecast, by Country 2019 & 2032
- Table 16: APAC Occupancy Sensors Market Revenue (Million) Forecast, by Application 2019 & 2032
- Table 17: Global APAC Occupancy Sensors Market Revenue Million Forecast, by Network Type 2019 & 2032
- Table 18: Global APAC Occupancy Sensors Market Revenue Million Forecast, by Technology 2019 & 2032
- Table 19: Global APAC Occupancy Sensors Market Revenue Million Forecast, by Application 2019 & 2032
- Table 20: Global APAC Occupancy Sensors Market Revenue Million Forecast, by Building Type 2019 & 2032
- Table 21: Global APAC Occupancy Sensors Market Revenue Million Forecast, by Country 2019 & 2032
- Table 22: United States APAC Occupancy Sensors Market Revenue (Million) Forecast, by Application 2019 & 2032
- Table 23: Canada APAC Occupancy Sensors Market Revenue (Million) Forecast, by Application 2019 & 2032
- Table 24: Mexico APAC Occupancy Sensors Market Revenue (Million) Forecast, by Application 2019 & 2032
- Table 25: Global APAC Occupancy Sensors Market Revenue Million Forecast, by Network Type 2019 & 2032
- Table 26: Global APAC Occupancy Sensors Market Revenue Million Forecast, by Technology 2019 & 2032
- Table 27: Global APAC Occupancy Sensors Market Revenue Million Forecast, by Application 2019 & 2032
- Table 28: Global APAC Occupancy Sensors Market Revenue Million Forecast, by Building Type 2019 & 2032
- Table 29: Global APAC Occupancy Sensors Market Revenue Million Forecast, by Country 2019 & 2032
- Table 30: Brazil APAC Occupancy Sensors Market Revenue (Million) Forecast, by Application 2019 & 2032
- Table 31: Argentina APAC Occupancy Sensors Market Revenue (Million) Forecast, by Application 2019 & 2032
- Table 32: Rest of South America APAC Occupancy Sensors Market Revenue (Million) Forecast, by Application 2019 & 2032
- Table 33: Global APAC Occupancy Sensors Market Revenue Million Forecast, by Network Type 2019 & 2032
- Table 34: Global APAC Occupancy Sensors Market Revenue Million Forecast, by Technology 2019 & 2032
- Table 35: Global APAC Occupancy Sensors Market Revenue Million Forecast, by Application 2019 & 2032
- Table 36: Global APAC Occupancy Sensors Market Revenue Million Forecast, by Building Type 2019 & 2032
- Table 37: Global APAC Occupancy Sensors Market Revenue Million Forecast, by Country 2019 & 2032
- Table 38: United Kingdom APAC Occupancy Sensors Market Revenue (Million) Forecast, by Application 2019 & 2032
- Table 39: Germany APAC Occupancy Sensors Market Revenue (Million) Forecast, by Application 2019 & 2032
- Table 40: France APAC Occupancy Sensors Market Revenue (Million) Forecast, by Application 2019 & 2032
- Table 41: Italy APAC Occupancy Sensors Market Revenue (Million) Forecast, by Application 2019 & 2032
- Table 42: Spain APAC Occupancy Sensors Market Revenue (Million) Forecast, by Application 2019 & 2032
- Table 43: Russia APAC Occupancy Sensors Market Revenue (Million) Forecast, by Application 2019 & 2032
- Table 44: Benelux APAC Occupancy Sensors Market Revenue (Million) Forecast, by Application 2019 & 2032
- Table 45: Nordics APAC Occupancy Sensors Market Revenue (Million) Forecast, by Application 2019 & 2032
- Table 46: Rest of Europe APAC Occupancy Sensors Market Revenue (Million) Forecast, by Application 2019 & 2032
- Table 47: Global APAC Occupancy Sensors Market Revenue Million Forecast, by Network Type 2019 & 2032
- Table 48: Global APAC Occupancy Sensors Market Revenue Million Forecast, by Technology 2019 & 2032
- Table 49: Global APAC Occupancy Sensors Market Revenue Million Forecast, by Application 2019 & 2032
- Table 50: Global APAC Occupancy Sensors Market Revenue Million Forecast, by Building Type 2019 & 2032
- Table 51: Global APAC Occupancy Sensors Market Revenue Million Forecast, by Country 2019 & 2032
- Table 52: Turkey APAC Occupancy Sensors Market Revenue (Million) Forecast, by Application 2019 & 2032
- Table 53: Israel APAC Occupancy Sensors Market Revenue (Million) Forecast, by Application 2019 & 2032
- Table 54: GCC APAC Occupancy Sensors Market Revenue (Million) Forecast, by Application 2019 & 2032
- Table 55: North Africa APAC Occupancy Sensors Market Revenue (Million) Forecast, by Application 2019 & 2032
- Table 56: South Africa APAC Occupancy Sensors Market Revenue (Million) Forecast, by Application 2019 & 2032
- Table 57: Rest of Middle East & Africa APAC Occupancy Sensors Market Revenue (Million) Forecast, by Application 2019 & 2032
- Table 58: Global APAC Occupancy Sensors Market Revenue Million Forecast, by Network Type 2019 & 2032
- Table 59: Global APAC Occupancy Sensors Market Revenue Million Forecast, by Technology 2019 & 2032
- Table 60: Global APAC Occupancy Sensors Market Revenue Million Forecast, by Application 2019 & 2032
- Table 61: Global APAC Occupancy Sensors Market Revenue Million Forecast, by Building Type 2019 & 2032
- Table 62: Global APAC Occupancy Sensors Market Revenue Million Forecast, by Country 2019 & 2032
- Table 63: China APAC Occupancy Sensors Market Revenue (Million) Forecast, by Application 2019 & 2032
- Table 64: India APAC Occupancy Sensors Market Revenue (Million) Forecast, by Application 2019 & 2032
- Table 65: Japan APAC Occupancy Sensors Market Revenue (Million) Forecast, by Application 2019 & 2032
- Table 66: South Korea APAC Occupancy Sensors Market Revenue (Million) Forecast, by Application 2019 & 2032
- Table 67: ASEAN APAC Occupancy Sensors Market Revenue (Million) Forecast, by Application 2019 & 2032
- Table 68: Oceania APAC Occupancy Sensors Market Revenue (Million) Forecast, by Application 2019 & 2032
- Table 69: Rest of Asia Pacific APAC Occupancy Sensors Market Revenue (Million) Forecast, by Application 2019 & 2032
Frequently Asked Questions
1. What is the projected Compound Annual Growth Rate (CAGR) of the APAC Occupancy Sensors Market?
The projected CAGR is approximately 15.50%.
2. Which companies are prominent players in the APAC Occupancy Sensors Market?
Key companies in the market include Signify Holding BV, Honeywell Inc, Eaton Corp PLC, Legrand SA, General Electric Co, Dwyer Instruments Inc, Schneider Electric SE, Johnson Controls Inc, Analog Devices Inc, Texas Instruments Inc*List Not Exhaustive.
3. What are the main segments of the APAC Occupancy Sensors Market?
The market segments include Network Type, Technology, Application, Building Type.
4. Can you provide details about the market size?
The market size is estimated to be USD XX Million as of 2022.
5. What are some drivers contributing to market growth?
Rising Demand for Energy Efficient Devices; Demand for Passive Infrared Due to Low Cost and High Energy Efficiency.
6. What are the notable trends driving market growth?
Residential Expected to Witness Significant Growth.
7. Are there any restraints impacting market growth?
Cryptojacking Threats.
8. Can you provide examples of recent developments in the market?
March 2020 - Signify introduced new Philips IoT sensor packages that gather and deliver data via the Interact Office connected lighting system and environmental monitoring APIs. The sensor bundles can observe occupancy, the total of people in the room, temperature (at the room and desk level), noise levels, daylight levels, relative humidity, and are Bluetooth enabled, allowing for indoor positioning and navigation.
9. What pricing options are available for accessing the report?
Pricing options include single-user, multi-user, and enterprise licenses priced at USD 4750, USD 4950, and USD 6800 respectively.
10. Is the market size provided in terms of value or volume?
The market size is provided in terms of value, measured in Million.
11. Are there any specific market keywords associated with the report?
Yes, the market keyword associated with the report is "APAC Occupancy Sensors Market," which aids in identifying and referencing the specific market segment covered.
12. How do I determine which pricing option suits my needs best?
The pricing options vary based on user requirements and access needs. Individual users may opt for single-user licenses, while businesses requiring broader access may choose multi-user or enterprise licenses for cost-effective access to the report.
13. Are there any additional resources or data provided in the APAC Occupancy Sensors Market report?
While the report offers comprehensive insights, it's advisable to review the specific contents or supplementary materials provided to ascertain if additional resources or data are available.
14. How can I stay updated on further developments or reports in the APAC Occupancy Sensors Market?
To stay informed about further developments, trends, and reports in the APAC Occupancy Sensors Market, consider subscribing to industry newsletters, following relevant companies and organizations, or regularly checking reputable industry news sources and publications.
Methodology
Step 1 - Identification of Relevant Samples Size from Population Database


Step 2 - Approaches for Defining Global Market Size (Value, Volume* & Price*)

Note*: In applicable scenarios
Step 3 - Data Sources
Primary Research
- Web Analytics
- Survey Reports
- Research Institute
- Latest Research Reports
- Opinion Leaders
Secondary Research
- Annual Reports
- White Paper
- Latest Press Release
- Industry Association
- Paid Database
- Investor Presentations

Step 4 - Data Triangulation
Involves using different sources of information in order to increase the validity of a study
These sources are likely to be stakeholders in a program - participants, other researchers, program staff, other community members, and so on.
Then we put all data in single framework & apply various statistical tools to find out the dynamic on the market.
During the analysis stage, feedback from the stakeholder groups would be compared to determine areas of agreement as well as areas of divergence


