
Key Insights
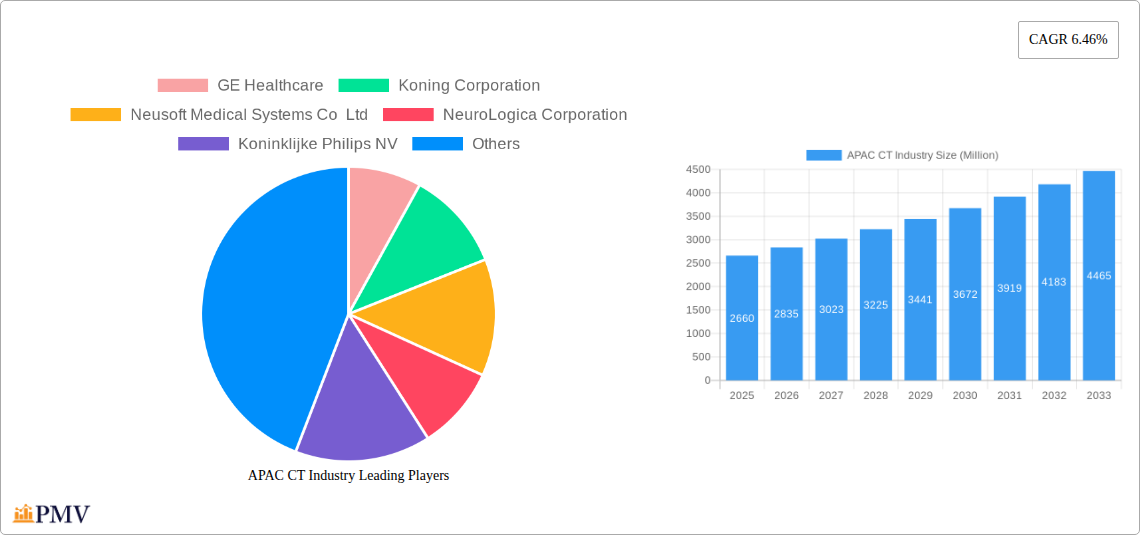
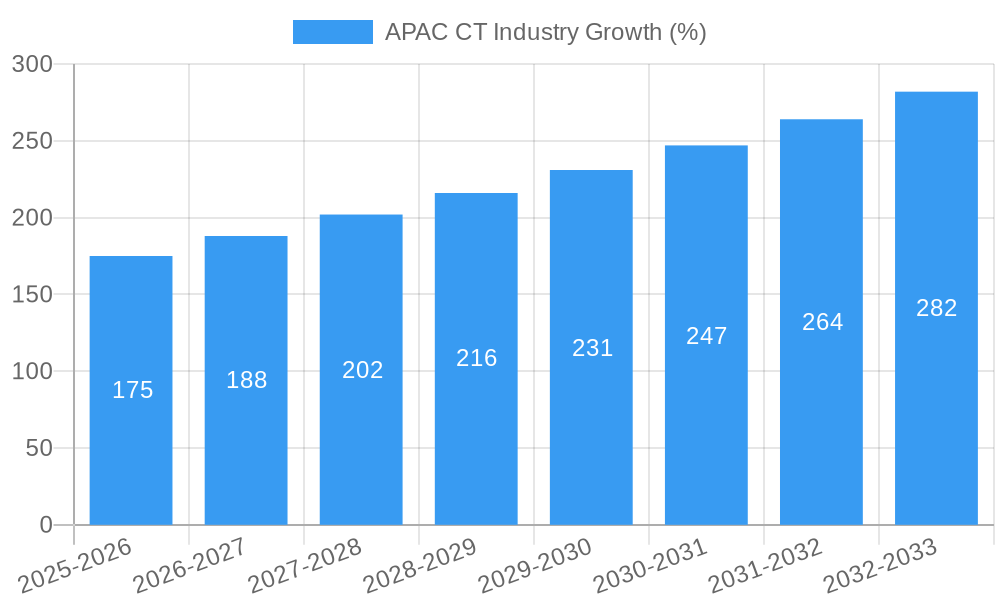
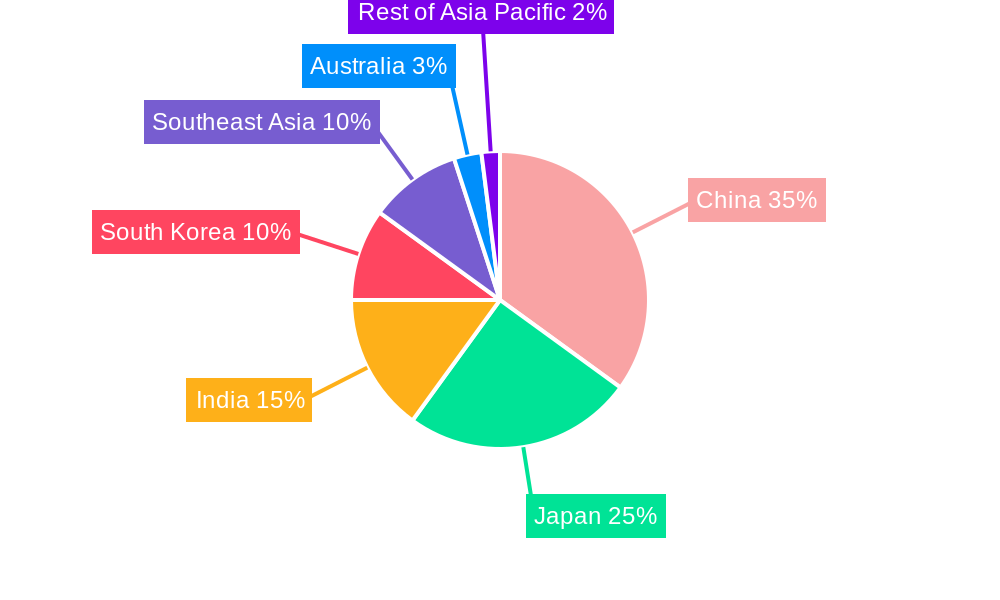
The Asia-Pacific (APAC) computed tomography (CT) market, valued at $2.66 billion in 2025, is projected to experience robust growth, driven by factors such as rising prevalence of chronic diseases (cancer, cardiovascular diseases, neurological disorders), increasing healthcare expenditure, and technological advancements leading to improved image quality and faster scan times. The market's Compound Annual Growth Rate (CAGR) of 6.46% from 2025 to 2033 indicates a significant expansion, with the market size exceeding $4 billion by 2033. This growth is fueled by increasing demand for advanced CT scanners in hospitals and specialized diagnostic centers across major economies like China, Japan, India, and South Korea. Furthermore, the rising adoption of minimally invasive surgical procedures and the growing geriatric population contribute to higher demand for accurate and timely diagnoses provided by CT scans. Segmentation analysis reveals significant contributions from the oncology, neurology, and cardiovascular application segments, reflecting the high prevalence of related diseases in the region.
However, the market faces certain challenges. High initial investment costs for advanced CT scanners, coupled with the need for skilled professionals for operation and maintenance, can limit market penetration in smaller clinics and healthcare facilities. Furthermore, the increasing competition among established players and the emergence of new technologies require continuous innovation and strategic partnerships to maintain market share. Nevertheless, the long-term growth outlook for the APAC CT industry remains positive, supported by government initiatives promoting healthcare infrastructure development and the rising awareness about preventive healthcare in the region. The market's diverse end-user segments, including hospitals, clinics, and diagnostic services, offer numerous opportunities for expansion and diversification of product offerings.
APAC CT Industry Market Report: 2019-2033 Forecast
This comprehensive report provides an in-depth analysis of the Asia-Pacific (APAC) Computed Tomography (CT) industry, offering invaluable insights for stakeholders seeking to navigate this dynamic market. The report covers the period from 2019 to 2033, with a focus on the 2025-2033 forecast period. The study incorporates data from the historical period (2019-2024) and utilizes 2025 as the base year and estimated year. The APAC CT market is projected to reach xx Million by 2033, exhibiting a CAGR of xx% during the forecast period.
APAC CT Industry Market Structure & Competitive Dynamics
The APAC CT industry is characterized by a moderately concentrated market structure, with key players such as GE Healthcare, Koninklijke Philips NV, Canon Medical Systems Corporation, Siemens Healthineers, Hitachi Healthcare Systems, Neusoft Medical Systems Co Ltd, NeuroLogica Corporation, Shenzhen Anke High-Tech Co Ltd, and Fujifilm Holdings Corporation holding significant market share. However, the presence of numerous smaller players and emerging technologies fosters a competitive landscape. Innovation ecosystems are robust, driven by ongoing R&D in areas like AI-powered image analysis and improved radiation dose reduction. Regulatory frameworks vary across APAC nations, influencing market access and product approvals. The market witnesses continuous M&A activities, with deal values reaching xx Million in the past few years. Substitutes like MRI and ultrasound imaging exert competitive pressure, while end-user trends toward minimally invasive procedures and personalized medicine influence the demand for CT scans.
- Market Concentration: Moderately concentrated, with top players holding xx% market share.
- M&A Activity: Significant activity with total deal values exceeding xx Million during 2019-2024.
- Regulatory Landscape: Varied across APAC nations, impacting product approvals and market access.
- Technological Disruption: AI-powered image analysis and radiation dose reduction technologies driving innovation.
APAC CT Industry Industry Trends & Insights
The APAC CT industry is experiencing robust growth, propelled by factors such as rising prevalence of chronic diseases, increasing healthcare expenditure, expanding healthcare infrastructure, and technological advancements. The market’s growth is further boosted by the increasing adoption of advanced imaging techniques, improved diagnostic capabilities, and the growing demand for minimally invasive procedures. Consumer preferences are shifting towards high-quality, efficient, and cost-effective imaging solutions. The competitive dynamics are shaping the market, with players focusing on innovation, strategic partnerships, and expansion into new markets. The CAGR for the APAC CT market is projected at xx% during the forecast period, driven by the factors listed above. Market penetration is anticipated to increase from xx% in 2025 to xx% by 2033.
Dominant Markets & Segments in APAC CT Industry
China and India represent the dominant markets within the APAC region, driven by their large populations, increasing healthcare spending, and government initiatives promoting healthcare infrastructure development. Among the segments, the high-slice CT scanner segment holds the largest market share due to its advanced capabilities and high diagnostic accuracy. In terms of application, Oncology and Cardiovascular applications dominate, fuelled by the growing prevalence of cancer and cardiovascular diseases. Hospitals account for the largest end-user segment, followed by diagnostic imaging centers.
- Key Drivers for China and India:
- Large and growing populations.
- Rising healthcare expenditure.
- Government initiatives supporting healthcare infrastructure development.
- Dominant Segments: High-Slice CT scanners, Oncology and Cardiovascular applications, and Hospitals.
APAC CT Industry Product Innovations
Recent advancements in CT technology include AI-powered image reconstruction and analysis, improved radiation dose reduction techniques, and multi-slice CT scanners with faster scan speeds. These innovations offer enhanced diagnostic accuracy, reduced patient radiation exposure, and improved workflow efficiency. The market is witnessing the integration of CT with other imaging modalities, such as PET and MRI, to provide comprehensive diagnostic information. These advancements cater to the growing demand for high-quality, efficient, and cost-effective imaging solutions.
Report Segmentation & Scope
This report segments the APAC CT market by Type (Low Slice, Medium Slice, High Slice), Application (Oncology, Neurology, Cardiovascular, Musculoskeletal, Other Applications), and End-User (Hospitals, Clinics, Diagnostic Services, Other End-Users). Each segment’s growth trajectory, market size (in Millions), and competitive landscape are meticulously analyzed. For example, the high-slice CT segment is expected to exhibit the highest growth rate due to its advanced capabilities, while the oncology application segment is projected to dominate due to the increasing prevalence of cancer.
Key Drivers of APAC CT Industry Growth
The APAC CT industry’s growth is driven by several factors, including technological advancements such as AI-powered image analysis and reduced radiation dose, increasing prevalence of chronic diseases leading to a surge in diagnostic needs, rising healthcare expenditure in many APAC nations, and supportive government policies promoting healthcare infrastructure development. The increasing adoption of advanced imaging technologies in developing economies further accelerates market expansion.
Challenges in the APAP CT Industry Sector
Challenges confronting the APAC CT industry include the high cost of advanced CT scanners limiting accessibility in certain regions, stringent regulatory approvals and compliance requirements varying across different countries, and the competitive pressure from substitute imaging modalities such as MRI and ultrasound. Supply chain disruptions can also impact the availability and cost of CT equipment and related services. These factors collectively impede market growth to some degree.
Leading Players in the APAC CT Industry Market
- GE Healthcare
- Koning Corporation
- Neusoft Medical Systems Co Ltd
- NeuroLogica Corporation
- Koninklijke Philips NV
- Canon Medical Systems Corporation
- Hitachi Healthcare Systems
- Siemens Healthineers
- Shenzhen Anke High-Tech Co Ltd
- Fujifilm Holdings Corporation
Key Developments in APAC CT Industry Sector
- December 2022: Fujifilm India partnered with Soorya Diagnostics LLP Center in Tirur, Kerala, installing a new CT scanner to improve healthcare access. This collaboration highlights the strategic focus on expanding market reach and promoting screening culture.
- May 2022: Bayer Korea launched MEDRAD Centargo, a CT injection device, approved by the Ministry of Food and Drug Safety. This product launch reflects the increasing demand for advanced medical devices in the APAC region.
Strategic APAC CT Industry Market Outlook
The APAC CT industry holds substantial growth potential, fueled by increasing healthcare spending, technological advancements, and favorable government policies. Strategic opportunities lie in focusing on cost-effective solutions, expanding into underserved markets, and developing innovative products tailored to regional needs. Partnerships and collaborations will play a crucial role in enhancing market penetration and driving growth. The focus on AI and improved radiation reduction will remain key to future market dominance.
APAC CT Industry Segmentation
-
1. Type
- 1.1. Low Slice
- 1.2. Medium Slice
- 1.3. High Slice
-
2. Application
- 2.1. Oncology
- 2.2. Neurology
- 2.3. Cardiovascular
- 2.4. Musculoskeletal
- 2.5. Other Applications
-
3. End-User
- 3.1. Hospitals
- 3.2. Clinics
- 3.3. Diagnostic Services
- 3.4. Other End-Users
-
4. Geography
- 4.1. China
- 4.2. Japan
- 4.3. India
- 4.4. Australia
- 4.5. South Korea
- 4.6. Rest of Asia-Pacific
APAC CT Industry Segmentation By Geography
- 1. China
- 2. Japan
- 3. India
- 4. Australia
- 5. South Korea
- 6. Rest of Asia Pacific
APAC CT Industry REPORT HIGHLIGHTS
| Aspects | Details |
|---|---|
| Study Period | 2019-2033 |
| Base Year | 2024 |
| Estimated Year | 2025 |
| Forecast Period | 2025-2033 |
| Historical Period | 2019-2024 |
| Growth Rate | CAGR of 6.46% from 2019-2033 |
| Segmentation |
|
Table of Contents
- 1. Introduction
- 1.1. Research Scope
- 1.2. Market Segmentation
- 1.3. Research Methodology
- 1.4. Definitions and Assumptions
- 2. Executive Summary
- 2.1. Introduction
- 3. Market Dynamics
- 3.1. Introduction
- 3.2. Market Drivers
- 3.2.1. Rising Geriatric Population and Increase in Incidences of Chronic Diseases; Increase in Shift of Medical Care Toward Image-guided Interventions; Technological Advancements
- 3.3. Market Restrains
- 3.3.1. Lack of Adequate Reimbursement; Stringent Regulatory Framework
- 3.4. Market Trends
- 3.4.1. Oncology Segment is Expected to Account for Largest Market Share During the Forecast Period
- 4. Market Factor Analysis
- 4.1. Porters Five Forces
- 4.2. Supply/Value Chain
- 4.3. PESTEL analysis
- 4.4. Market Entropy
- 4.5. Patent/Trademark Analysis
- 5. Global APAC CT Industry Analysis, Insights and Forecast, 2019-2031
- 5.1. Market Analysis, Insights and Forecast - by Type
- 5.1.1. Low Slice
- 5.1.2. Medium Slice
- 5.1.3. High Slice
- 5.2. Market Analysis, Insights and Forecast - by Application
- 5.2.1. Oncology
- 5.2.2. Neurology
- 5.2.3. Cardiovascular
- 5.2.4. Musculoskeletal
- 5.2.5. Other Applications
- 5.3. Market Analysis, Insights and Forecast - by End-User
- 5.3.1. Hospitals
- 5.3.2. Clinics
- 5.3.3. Diagnostic Services
- 5.3.4. Other End-Users
- 5.4. Market Analysis, Insights and Forecast - by Geography
- 5.4.1. China
- 5.4.2. Japan
- 5.4.3. India
- 5.4.4. Australia
- 5.4.5. South Korea
- 5.4.6. Rest of Asia-Pacific
- 5.5. Market Analysis, Insights and Forecast - by Region
- 5.5.1. China
- 5.5.2. Japan
- 5.5.3. India
- 5.5.4. Australia
- 5.5.5. South Korea
- 5.5.6. Rest of Asia Pacific
- 5.1. Market Analysis, Insights and Forecast - by Type
- 6. China APAC CT Industry Analysis, Insights and Forecast, 2019-2031
- 6.1. Market Analysis, Insights and Forecast - by Type
- 6.1.1. Low Slice
- 6.1.2. Medium Slice
- 6.1.3. High Slice
- 6.2. Market Analysis, Insights and Forecast - by Application
- 6.2.1. Oncology
- 6.2.2. Neurology
- 6.2.3. Cardiovascular
- 6.2.4. Musculoskeletal
- 6.2.5. Other Applications
- 6.3. Market Analysis, Insights and Forecast - by End-User
- 6.3.1. Hospitals
- 6.3.2. Clinics
- 6.3.3. Diagnostic Services
- 6.3.4. Other End-Users
- 6.4. Market Analysis, Insights and Forecast - by Geography
- 6.4.1. China
- 6.4.2. Japan
- 6.4.3. India
- 6.4.4. Australia
- 6.4.5. South Korea
- 6.4.6. Rest of Asia-Pacific
- 6.1. Market Analysis, Insights and Forecast - by Type
- 7. Japan APAC CT Industry Analysis, Insights and Forecast, 2019-2031
- 7.1. Market Analysis, Insights and Forecast - by Type
- 7.1.1. Low Slice
- 7.1.2. Medium Slice
- 7.1.3. High Slice
- 7.2. Market Analysis, Insights and Forecast - by Application
- 7.2.1. Oncology
- 7.2.2. Neurology
- 7.2.3. Cardiovascular
- 7.2.4. Musculoskeletal
- 7.2.5. Other Applications
- 7.3. Market Analysis, Insights and Forecast - by End-User
- 7.3.1. Hospitals
- 7.3.2. Clinics
- 7.3.3. Diagnostic Services
- 7.3.4. Other End-Users
- 7.4. Market Analysis, Insights and Forecast - by Geography
- 7.4.1. China
- 7.4.2. Japan
- 7.4.3. India
- 7.4.4. Australia
- 7.4.5. South Korea
- 7.4.6. Rest of Asia-Pacific
- 7.1. Market Analysis, Insights and Forecast - by Type
- 8. India APAC CT Industry Analysis, Insights and Forecast, 2019-2031
- 8.1. Market Analysis, Insights and Forecast - by Type
- 8.1.1. Low Slice
- 8.1.2. Medium Slice
- 8.1.3. High Slice
- 8.2. Market Analysis, Insights and Forecast - by Application
- 8.2.1. Oncology
- 8.2.2. Neurology
- 8.2.3. Cardiovascular
- 8.2.4. Musculoskeletal
- 8.2.5. Other Applications
- 8.3. Market Analysis, Insights and Forecast - by End-User
- 8.3.1. Hospitals
- 8.3.2. Clinics
- 8.3.3. Diagnostic Services
- 8.3.4. Other End-Users
- 8.4. Market Analysis, Insights and Forecast - by Geography
- 8.4.1. China
- 8.4.2. Japan
- 8.4.3. India
- 8.4.4. Australia
- 8.4.5. South Korea
- 8.4.6. Rest of Asia-Pacific
- 8.1. Market Analysis, Insights and Forecast - by Type
- 9. Australia APAC CT Industry Analysis, Insights and Forecast, 2019-2031
- 9.1. Market Analysis, Insights and Forecast - by Type
- 9.1.1. Low Slice
- 9.1.2. Medium Slice
- 9.1.3. High Slice
- 9.2. Market Analysis, Insights and Forecast - by Application
- 9.2.1. Oncology
- 9.2.2. Neurology
- 9.2.3. Cardiovascular
- 9.2.4. Musculoskeletal
- 9.2.5. Other Applications
- 9.3. Market Analysis, Insights and Forecast - by End-User
- 9.3.1. Hospitals
- 9.3.2. Clinics
- 9.3.3. Diagnostic Services
- 9.3.4. Other End-Users
- 9.4. Market Analysis, Insights and Forecast - by Geography
- 9.4.1. China
- 9.4.2. Japan
- 9.4.3. India
- 9.4.4. Australia
- 9.4.5. South Korea
- 9.4.6. Rest of Asia-Pacific
- 9.1. Market Analysis, Insights and Forecast - by Type
- 10. South Korea APAC CT Industry Analysis, Insights and Forecast, 2019-2031
- 10.1. Market Analysis, Insights and Forecast - by Type
- 10.1.1. Low Slice
- 10.1.2. Medium Slice
- 10.1.3. High Slice
- 10.2. Market Analysis, Insights and Forecast - by Application
- 10.2.1. Oncology
- 10.2.2. Neurology
- 10.2.3. Cardiovascular
- 10.2.4. Musculoskeletal
- 10.2.5. Other Applications
- 10.3. Market Analysis, Insights and Forecast - by End-User
- 10.3.1. Hospitals
- 10.3.2. Clinics
- 10.3.3. Diagnostic Services
- 10.3.4. Other End-Users
- 10.4. Market Analysis, Insights and Forecast - by Geography
- 10.4.1. China
- 10.4.2. Japan
- 10.4.3. India
- 10.4.4. Australia
- 10.4.5. South Korea
- 10.4.6. Rest of Asia-Pacific
- 10.1. Market Analysis, Insights and Forecast - by Type
- 11. Rest of Asia Pacific APAC CT Industry Analysis, Insights and Forecast, 2019-2031
- 11.1. Market Analysis, Insights and Forecast - by Type
- 11.1.1. Low Slice
- 11.1.2. Medium Slice
- 11.1.3. High Slice
- 11.2. Market Analysis, Insights and Forecast - by Application
- 11.2.1. Oncology
- 11.2.2. Neurology
- 11.2.3. Cardiovascular
- 11.2.4. Musculoskeletal
- 11.2.5. Other Applications
- 11.3. Market Analysis, Insights and Forecast - by End-User
- 11.3.1. Hospitals
- 11.3.2. Clinics
- 11.3.3. Diagnostic Services
- 11.3.4. Other End-Users
- 11.4. Market Analysis, Insights and Forecast - by Geography
- 11.4.1. China
- 11.4.2. Japan
- 11.4.3. India
- 11.4.4. Australia
- 11.4.5. South Korea
- 11.4.6. Rest of Asia-Pacific
- 11.1. Market Analysis, Insights and Forecast - by Type
- 12. China APAC CT Industry Analysis, Insights and Forecast, 2019-2031
- 13. Japan APAC CT Industry Analysis, Insights and Forecast, 2019-2031
- 14. India APAC CT Industry Analysis, Insights and Forecast, 2019-2031
- 15. South Korea APAC CT Industry Analysis, Insights and Forecast, 2019-2031
- 16. Southeast Asia APAC CT Industry Analysis, Insights and Forecast, 2019-2031
- 17. Australia APAC CT Industry Analysis, Insights and Forecast, 2019-2031
- 18. Rest of Asia Pacific APAC CT Industry Analysis, Insights and Forecast, 2019-2031
- 19. Competitive Analysis
- 19.1. Global Market Share Analysis 2024
- 19.2. Company Profiles
- 19.2.1 GE Healthcare
- 19.2.1.1. Overview
- 19.2.1.2. Products
- 19.2.1.3. SWOT Analysis
- 19.2.1.4. Recent Developments
- 19.2.1.5. Financials (Based on Availability)
- 19.2.2 Koning Corporation
- 19.2.2.1. Overview
- 19.2.2.2. Products
- 19.2.2.3. SWOT Analysis
- 19.2.2.4. Recent Developments
- 19.2.2.5. Financials (Based on Availability)
- 19.2.3 Neusoft Medical Systems Co Ltd
- 19.2.3.1. Overview
- 19.2.3.2. Products
- 19.2.3.3. SWOT Analysis
- 19.2.3.4. Recent Developments
- 19.2.3.5. Financials (Based on Availability)
- 19.2.4 NeuroLogica Corporation
- 19.2.4.1. Overview
- 19.2.4.2. Products
- 19.2.4.3. SWOT Analysis
- 19.2.4.4. Recent Developments
- 19.2.4.5. Financials (Based on Availability)
- 19.2.5 Koninklijke Philips NV
- 19.2.5.1. Overview
- 19.2.5.2. Products
- 19.2.5.3. SWOT Analysis
- 19.2.5.4. Recent Developments
- 19.2.5.5. Financials (Based on Availability)
- 19.2.6 Canon Medical Systems Corporation
- 19.2.6.1. Overview
- 19.2.6.2. Products
- 19.2.6.3. SWOT Analysis
- 19.2.6.4. Recent Developments
- 19.2.6.5. Financials (Based on Availability)
- 19.2.7 Hitachi Healthcare Systems
- 19.2.7.1. Overview
- 19.2.7.2. Products
- 19.2.7.3. SWOT Analysis
- 19.2.7.4. Recent Developments
- 19.2.7.5. Financials (Based on Availability)
- 19.2.8 Siemens Healthineers*List Not Exhaustive
- 19.2.8.1. Overview
- 19.2.8.2. Products
- 19.2.8.3. SWOT Analysis
- 19.2.8.4. Recent Developments
- 19.2.8.5. Financials (Based on Availability)
- 19.2.9 Shenzhen Anke High-Tech Co Ltd
- 19.2.9.1. Overview
- 19.2.9.2. Products
- 19.2.9.3. SWOT Analysis
- 19.2.9.4. Recent Developments
- 19.2.9.5. Financials (Based on Availability)
- 19.2.10 Fujifilm Holdings Corporation
- 19.2.10.1. Overview
- 19.2.10.2. Products
- 19.2.10.3. SWOT Analysis
- 19.2.10.4. Recent Developments
- 19.2.10.5. Financials (Based on Availability)
- 19.2.1 GE Healthcare
List of Figures
- Figure 1: Global APAC CT Industry Revenue Breakdown (Million, %) by Region 2024 & 2032
- Figure 2: Asia Pacific APAC CT Industry Revenue (Million), by Country 2024 & 2032
- Figure 3: Asia Pacific APAC CT Industry Revenue Share (%), by Country 2024 & 2032
- Figure 4: China APAC CT Industry Revenue (Million), by Type 2024 & 2032
- Figure 5: China APAC CT Industry Revenue Share (%), by Type 2024 & 2032
- Figure 6: China APAC CT Industry Revenue (Million), by Application 2024 & 2032
- Figure 7: China APAC CT Industry Revenue Share (%), by Application 2024 & 2032
- Figure 8: China APAC CT Industry Revenue (Million), by End-User 2024 & 2032
- Figure 9: China APAC CT Industry Revenue Share (%), by End-User 2024 & 2032
- Figure 10: China APAC CT Industry Revenue (Million), by Geography 2024 & 2032
- Figure 11: China APAC CT Industry Revenue Share (%), by Geography 2024 & 2032
- Figure 12: China APAC CT Industry Revenue (Million), by Country 2024 & 2032
- Figure 13: China APAC CT Industry Revenue Share (%), by Country 2024 & 2032
- Figure 14: Japan APAC CT Industry Revenue (Million), by Type 2024 & 2032
- Figure 15: Japan APAC CT Industry Revenue Share (%), by Type 2024 & 2032
- Figure 16: Japan APAC CT Industry Revenue (Million), by Application 2024 & 2032
- Figure 17: Japan APAC CT Industry Revenue Share (%), by Application 2024 & 2032
- Figure 18: Japan APAC CT Industry Revenue (Million), by End-User 2024 & 2032
- Figure 19: Japan APAC CT Industry Revenue Share (%), by End-User 2024 & 2032
- Figure 20: Japan APAC CT Industry Revenue (Million), by Geography 2024 & 2032
- Figure 21: Japan APAC CT Industry Revenue Share (%), by Geography 2024 & 2032
- Figure 22: Japan APAC CT Industry Revenue (Million), by Country 2024 & 2032
- Figure 23: Japan APAC CT Industry Revenue Share (%), by Country 2024 & 2032
- Figure 24: India APAC CT Industry Revenue (Million), by Type 2024 & 2032
- Figure 25: India APAC CT Industry Revenue Share (%), by Type 2024 & 2032
- Figure 26: India APAC CT Industry Revenue (Million), by Application 2024 & 2032
- Figure 27: India APAC CT Industry Revenue Share (%), by Application 2024 & 2032
- Figure 28: India APAC CT Industry Revenue (Million), by End-User 2024 & 2032
- Figure 29: India APAC CT Industry Revenue Share (%), by End-User 2024 & 2032
- Figure 30: India APAC CT Industry Revenue (Million), by Geography 2024 & 2032
- Figure 31: India APAC CT Industry Revenue Share (%), by Geography 2024 & 2032
- Figure 32: India APAC CT Industry Revenue (Million), by Country 2024 & 2032
- Figure 33: India APAC CT Industry Revenue Share (%), by Country 2024 & 2032
- Figure 34: Australia APAC CT Industry Revenue (Million), by Type 2024 & 2032
- Figure 35: Australia APAC CT Industry Revenue Share (%), by Type 2024 & 2032
- Figure 36: Australia APAC CT Industry Revenue (Million), by Application 2024 & 2032
- Figure 37: Australia APAC CT Industry Revenue Share (%), by Application 2024 & 2032
- Figure 38: Australia APAC CT Industry Revenue (Million), by End-User 2024 & 2032
- Figure 39: Australia APAC CT Industry Revenue Share (%), by End-User 2024 & 2032
- Figure 40: Australia APAC CT Industry Revenue (Million), by Geography 2024 & 2032
- Figure 41: Australia APAC CT Industry Revenue Share (%), by Geography 2024 & 2032
- Figure 42: Australia APAC CT Industry Revenue (Million), by Country 2024 & 2032
- Figure 43: Australia APAC CT Industry Revenue Share (%), by Country 2024 & 2032
- Figure 44: South Korea APAC CT Industry Revenue (Million), by Type 2024 & 2032
- Figure 45: South Korea APAC CT Industry Revenue Share (%), by Type 2024 & 2032
- Figure 46: South Korea APAC CT Industry Revenue (Million), by Application 2024 & 2032
- Figure 47: South Korea APAC CT Industry Revenue Share (%), by Application 2024 & 2032
- Figure 48: South Korea APAC CT Industry Revenue (Million), by End-User 2024 & 2032
- Figure 49: South Korea APAC CT Industry Revenue Share (%), by End-User 2024 & 2032
- Figure 50: South Korea APAC CT Industry Revenue (Million), by Geography 2024 & 2032
- Figure 51: South Korea APAC CT Industry Revenue Share (%), by Geography 2024 & 2032
- Figure 52: South Korea APAC CT Industry Revenue (Million), by Country 2024 & 2032
- Figure 53: South Korea APAC CT Industry Revenue Share (%), by Country 2024 & 2032
- Figure 54: Rest of Asia Pacific APAC CT Industry Revenue (Million), by Type 2024 & 2032
- Figure 55: Rest of Asia Pacific APAC CT Industry Revenue Share (%), by Type 2024 & 2032
- Figure 56: Rest of Asia Pacific APAC CT Industry Revenue (Million), by Application 2024 & 2032
- Figure 57: Rest of Asia Pacific APAC CT Industry Revenue Share (%), by Application 2024 & 2032
- Figure 58: Rest of Asia Pacific APAC CT Industry Revenue (Million), by End-User 2024 & 2032
- Figure 59: Rest of Asia Pacific APAC CT Industry Revenue Share (%), by End-User 2024 & 2032
- Figure 60: Rest of Asia Pacific APAC CT Industry Revenue (Million), by Geography 2024 & 2032
- Figure 61: Rest of Asia Pacific APAC CT Industry Revenue Share (%), by Geography 2024 & 2032
- Figure 62: Rest of Asia Pacific APAC CT Industry Revenue (Million), by Country 2024 & 2032
- Figure 63: Rest of Asia Pacific APAC CT Industry Revenue Share (%), by Country 2024 & 2032
List of Tables
- Table 1: Global APAC CT Industry Revenue Million Forecast, by Region 2019 & 2032
- Table 2: Global APAC CT Industry Revenue Million Forecast, by Type 2019 & 2032
- Table 3: Global APAC CT Industry Revenue Million Forecast, by Application 2019 & 2032
- Table 4: Global APAC CT Industry Revenue Million Forecast, by End-User 2019 & 2032
- Table 5: Global APAC CT Industry Revenue Million Forecast, by Geography 2019 & 2032
- Table 6: Global APAC CT Industry Revenue Million Forecast, by Region 2019 & 2032
- Table 7: Global APAC CT Industry Revenue Million Forecast, by Country 2019 & 2032
- Table 8: China APAC CT Industry Revenue (Million) Forecast, by Application 2019 & 2032
- Table 9: Japan APAC CT Industry Revenue (Million) Forecast, by Application 2019 & 2032
- Table 10: India APAC CT Industry Revenue (Million) Forecast, by Application 2019 & 2032
- Table 11: South Korea APAC CT Industry Revenue (Million) Forecast, by Application 2019 & 2032
- Table 12: Southeast Asia APAC CT Industry Revenue (Million) Forecast, by Application 2019 & 2032
- Table 13: Australia APAC CT Industry Revenue (Million) Forecast, by Application 2019 & 2032
- Table 14: Rest of Asia Pacific APAC CT Industry Revenue (Million) Forecast, by Application 2019 & 2032
- Table 15: Global APAC CT Industry Revenue Million Forecast, by Type 2019 & 2032
- Table 16: Global APAC CT Industry Revenue Million Forecast, by Application 2019 & 2032
- Table 17: Global APAC CT Industry Revenue Million Forecast, by End-User 2019 & 2032
- Table 18: Global APAC CT Industry Revenue Million Forecast, by Geography 2019 & 2032
- Table 19: Global APAC CT Industry Revenue Million Forecast, by Country 2019 & 2032
- Table 20: Global APAC CT Industry Revenue Million Forecast, by Type 2019 & 2032
- Table 21: Global APAC CT Industry Revenue Million Forecast, by Application 2019 & 2032
- Table 22: Global APAC CT Industry Revenue Million Forecast, by End-User 2019 & 2032
- Table 23: Global APAC CT Industry Revenue Million Forecast, by Geography 2019 & 2032
- Table 24: Global APAC CT Industry Revenue Million Forecast, by Country 2019 & 2032
- Table 25: Global APAC CT Industry Revenue Million Forecast, by Type 2019 & 2032
- Table 26: Global APAC CT Industry Revenue Million Forecast, by Application 2019 & 2032
- Table 27: Global APAC CT Industry Revenue Million Forecast, by End-User 2019 & 2032
- Table 28: Global APAC CT Industry Revenue Million Forecast, by Geography 2019 & 2032
- Table 29: Global APAC CT Industry Revenue Million Forecast, by Country 2019 & 2032
- Table 30: Global APAC CT Industry Revenue Million Forecast, by Type 2019 & 2032
- Table 31: Global APAC CT Industry Revenue Million Forecast, by Application 2019 & 2032
- Table 32: Global APAC CT Industry Revenue Million Forecast, by End-User 2019 & 2032
- Table 33: Global APAC CT Industry Revenue Million Forecast, by Geography 2019 & 2032
- Table 34: Global APAC CT Industry Revenue Million Forecast, by Country 2019 & 2032
- Table 35: Global APAC CT Industry Revenue Million Forecast, by Type 2019 & 2032
- Table 36: Global APAC CT Industry Revenue Million Forecast, by Application 2019 & 2032
- Table 37: Global APAC CT Industry Revenue Million Forecast, by End-User 2019 & 2032
- Table 38: Global APAC CT Industry Revenue Million Forecast, by Geography 2019 & 2032
- Table 39: Global APAC CT Industry Revenue Million Forecast, by Country 2019 & 2032
- Table 40: Global APAC CT Industry Revenue Million Forecast, by Type 2019 & 2032
- Table 41: Global APAC CT Industry Revenue Million Forecast, by Application 2019 & 2032
- Table 42: Global APAC CT Industry Revenue Million Forecast, by End-User 2019 & 2032
- Table 43: Global APAC CT Industry Revenue Million Forecast, by Geography 2019 & 2032
- Table 44: Global APAC CT Industry Revenue Million Forecast, by Country 2019 & 2032
Frequently Asked Questions
1. What is the projected Compound Annual Growth Rate (CAGR) of the APAC CT Industry?
The projected CAGR is approximately 6.46%.
2. Which companies are prominent players in the APAC CT Industry?
Key companies in the market include GE Healthcare, Koning Corporation, Neusoft Medical Systems Co Ltd, NeuroLogica Corporation, Koninklijke Philips NV, Canon Medical Systems Corporation, Hitachi Healthcare Systems, Siemens Healthineers*List Not Exhaustive, Shenzhen Anke High-Tech Co Ltd, Fujifilm Holdings Corporation.
3. What are the main segments of the APAC CT Industry?
The market segments include Type, Application, End-User, Geography.
4. Can you provide details about the market size?
The market size is estimated to be USD 2.66 Million as of 2022.
5. What are some drivers contributing to market growth?
Rising Geriatric Population and Increase in Incidences of Chronic Diseases; Increase in Shift of Medical Care Toward Image-guided Interventions; Technological Advancements.
6. What are the notable trends driving market growth?
Oncology Segment is Expected to Account for Largest Market Share During the Forecast Period.
7. Are there any restraints impacting market growth?
Lack of Adequate Reimbursement; Stringent Regulatory Framework.
8. Can you provide examples of recent developments in the market?
Dec 2022: Fujifilm India partnered with Soorya Diagnostics LLP Center in Tirur, Kerala. As part of this collaboration, Fujifilm installed its most recent CT Scan machine at Soorya Diagnostics Center in order to promote screening culture and provide people in the region with access to quality healthcare services.
9. What pricing options are available for accessing the report?
Pricing options include single-user, multi-user, and enterprise licenses priced at USD 4750, USD 5250, and USD 8750 respectively.
10. Is the market size provided in terms of value or volume?
The market size is provided in terms of value, measured in Million.
11. Are there any specific market keywords associated with the report?
Yes, the market keyword associated with the report is "APAC CT Industry," which aids in identifying and referencing the specific market segment covered.
12. How do I determine which pricing option suits my needs best?
The pricing options vary based on user requirements and access needs. Individual users may opt for single-user licenses, while businesses requiring broader access may choose multi-user or enterprise licenses for cost-effective access to the report.
13. Are there any additional resources or data provided in the APAC CT Industry report?
While the report offers comprehensive insights, it's advisable to review the specific contents or supplementary materials provided to ascertain if additional resources or data are available.
14. How can I stay updated on further developments or reports in the APAC CT Industry?
To stay informed about further developments, trends, and reports in the APAC CT Industry, consider subscribing to industry newsletters, following relevant companies and organizations, or regularly checking reputable industry news sources and publications.
Methodology
Step 1 - Identification of Relevant Samples Size from Population Database


Step 2 - Approaches for Defining Global Market Size (Value, Volume* & Price*)

Note*: In applicable scenarios
Step 3 - Data Sources
Primary Research
- Web Analytics
- Survey Reports
- Research Institute
- Latest Research Reports
- Opinion Leaders
Secondary Research
- Annual Reports
- White Paper
- Latest Press Release
- Industry Association
- Paid Database
- Investor Presentations

Step 4 - Data Triangulation
Involves using different sources of information in order to increase the validity of a study
These sources are likely to be stakeholders in a program - participants, other researchers, program staff, other community members, and so on.
Then we put all data in single framework & apply various statistical tools to find out the dynamic on the market.
During the analysis stage, feedback from the stakeholder groups would be compared to determine areas of agreement as well as areas of divergence


