
Key Insights
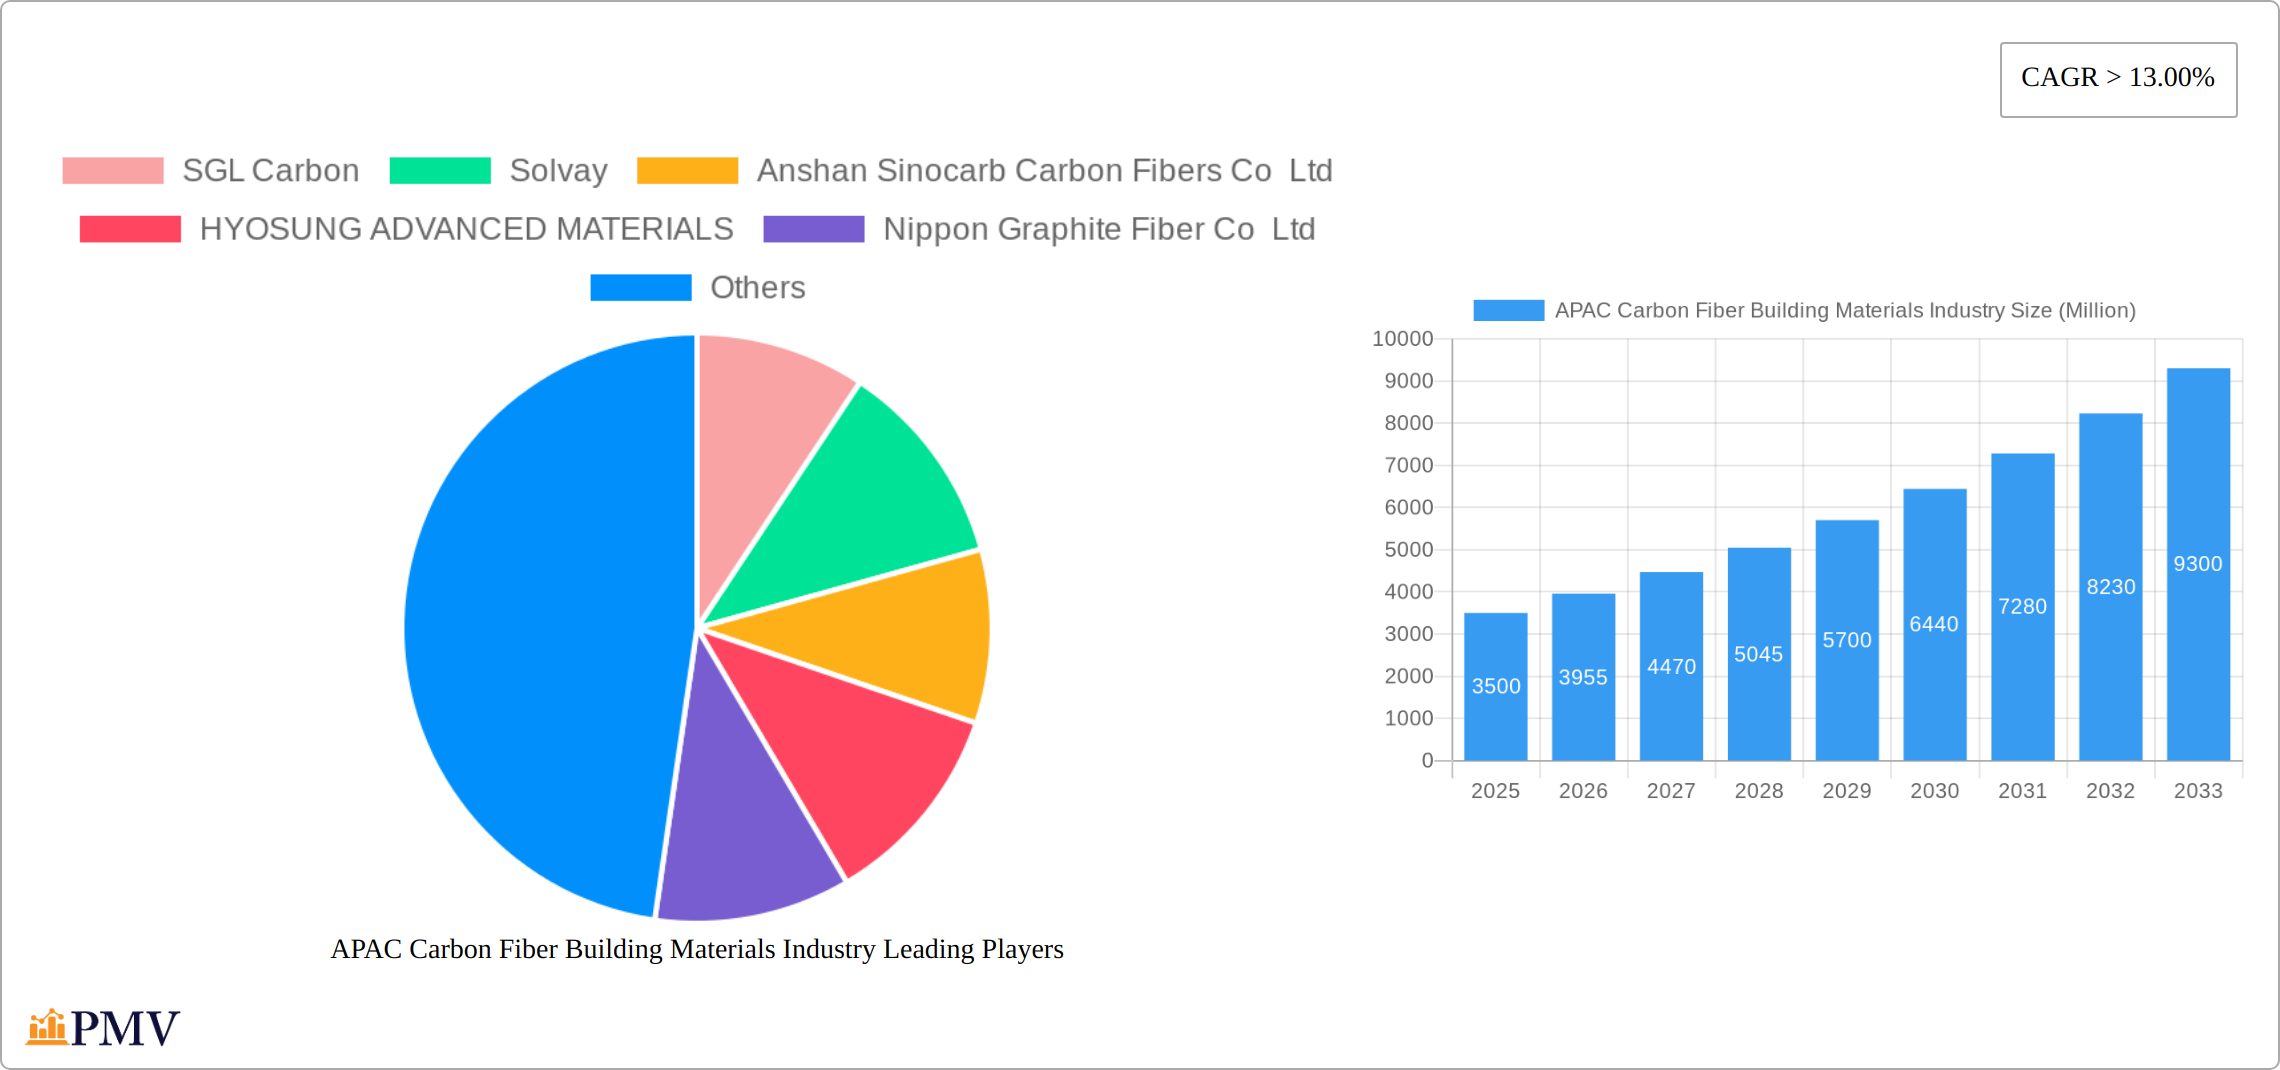
The APAC Carbon Fiber Building Materials Industry is poised for significant growth, driven by the increasing demand for lightweight and high-strength materials across various end-user industries such as aerospace, automotive, and alternative energy. The market size is projected to reach USD 3,500 million by 2025, with a Compound Annual Growth Rate (CAGR) exceeding 13.00% during the forecast period from 2025 to 2033. Key drivers include the rising adoption of carbon fiber composites in the aerospace and defense sector, spurred by the need for fuel-efficient aircraft, and the growing application in the automotive industry to meet stringent emission regulations. Additionally, the expansion of renewable energy sectors, particularly wind energy, further propels the demand for carbon fiber in turbine blades.
Trends in the APAC market are characterized by technological advancements in raw materials, with Polyacrylonitrile (PAN) being the dominant raw material due to its superior properties and cost-effectiveness. The market is segmented by type into Virgin Fiber (VCF) and Recycled Fiber (RCF), with VCF holding a larger share owing to its performance benefits. Application areas are expanding, with composite materials and textiles leading the market, followed by emerging segments like microelectrodes and catalysis. The region's leading companies, including Toray Industries Inc., Mitsubishi Chemical Carbon Fiber and Composites Inc., and Hyosung Advanced Materials, are investing heavily in R&D to innovate and capture a larger market share. Despite the promising growth, challenges such as high production costs and the need for specialized manufacturing processes remain key restraints.
APAC Carbon Fiber Building Materials Industry Market Structure & Competitive Dynamics
The APAC carbon fiber building materials industry is characterized by a competitive landscape with a mix of global and regional players. Market concentration is moderate, with key players such as SGL Carbon, Solvay, and TORAY INDUSTRIES INC holding significant market shares. Innovation ecosystems are thriving, particularly in Japan and South Korea, where companies like HYOSUNG ADVANCED MATERIALS are pushing the boundaries of carbon fiber technology.
Regulatory frameworks in the APAC region vary, with countries like China imposing strict environmental regulations that affect production costs and market entry. Product substitutes such as glass fiber and metal composites pose a challenge, yet carbon fiber's superior strength-to-weight ratio continues to drive demand. End-user trends indicate a growing preference for lightweight and durable materials across sectors like aerospace, automotive, and construction.
Mergers and acquisitions (M&A) are pivotal in shaping market dynamics. Recent M&A activities include the acquisition of carbon fiber businesses by major conglomerates to expand their portfolios and enhance technological capabilities. Notable deals include the acquisition of a carbon fiber manufacturer by a leading aerospace company for approximately USD 500 million, reflecting the strategic importance of carbon fiber in high-growth industries.
- Market Share: Top three companies hold approximately 35% of the market.
- M&A Deal Values: Recent acquisitions valued at USD 500 million to USD 1 billion.
APAC Carbon Fiber Building Materials Industry Industry Trends & Insights
The APAC carbon fiber building materials industry is experiencing robust growth, fueled by several converging factors. The region's burgeoning aerospace and automotive sectors are significant catalysts, with a projected compound annual growth rate (CAGR) of 8.5% from 2025 to 2033. This expansion is further accelerated by technological advancements, most notably the increasing adoption of recycled carbon fiber (RCF). RCF provides a more sustainable alternative to virgin carbon fiber (VCF), aligning with global sustainability initiatives and offering potential cost reductions in production.
Consumer demand is shifting towards high-performance materials, particularly within the sporting goods and construction industries. The need for lightweight yet durable materials is driving market penetration, with carbon fiber poised to capture a significant 20% market share in sporting goods by 2033. The competitive landscape is dynamic, characterized by substantial R&D investments from companies striving to develop innovative products and expand into new applications. This competitive pressure fosters continuous improvement and innovation within the industry.
The rise of alternative energy sources, especially wind energy, presents another substantial growth driver. The utilization of carbon fiber in wind turbine blades is steadily increasing, with market penetration projected to climb from 10% in 2025 to 15% by 2033. Furthermore, the integration of carbon fiber into hydrogen fuel cell technology is gaining momentum, supported by government incentives and growing investments in green technologies. This synergy between environmental concerns and technological advancement positions carbon fiber for significant future growth.
Dominant Markets & Segments in APAC Carbon Fiber Building Materials Industry
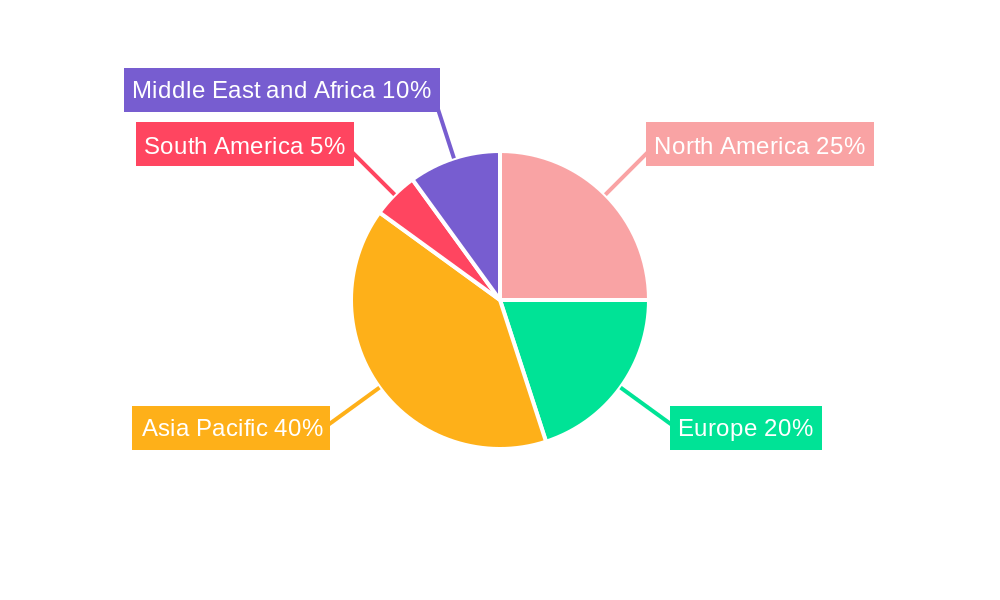
The APAC carbon fiber building materials industry demonstrates significant market dominance across diverse segments and geographical regions. China leads the market, leveraging its extensive manufacturing capabilities and substantial investments in the aerospace and automotive sectors. Japan and South Korea follow closely, distinguished by their strong focus on technological innovation and high-quality production processes.
- Raw Material: Polyacrylonitrile (PAN) remains the dominant raw material, comprising over 90% of the market due to its superior properties and cost-effectiveness. While less prevalent, petroleum pitch and rayon are gaining traction in specialized applications.
- Type: Virgin Fiber (VCF) currently holds the largest market share at approximately 70%, driven by its superior performance and reliability. However, Recycled Fiber (RCF) is experiencing rapid growth, projected at a CAGR of 10% from 2025 to 2033, reflecting the increasing emphasis on sustainability.
- Application: Composite materials constitute the leading application segment, exceeding 60% market share. The use of carbon fiber in textiles, microelectrodes, and catalysis is also expanding, propelled by technological advancements and the development of novel product applications.
- End-user Industry: The aerospace and defense sectors lead the market, followed by the automotive industry. Alternative energy, particularly wind energy, represents a rapidly expanding segment, with a projected market size of USD 2 billion by 2033. Construction and infrastructure, sporting goods, and other sectors such as marine, electrical, and electronics also contribute significantly to market growth.
The dominance of these segments is influenced by several key drivers:
- Economic Policies: Supportive government incentives for renewable energy and lightweight materials in the transportation sector.
- Infrastructure Development: Rapid urbanization and infrastructure projects in countries like China and India.
- Technological Advancements: Continuous R&D investments leading to new applications and enhanced material performance.
APAC Carbon Fiber Building Materials Industry Product Innovations
Product innovations in the APAC carbon fiber building materials industry are centered around enhancing performance and sustainability. Recent developments include the introduction of high-strength carbon fiber for hydrogen fuel tanks, as seen in Hyosung Advanced Materials' supply contract with Hanwha Solutions. Technological trends such as the use of recycled carbon fiber (RCF) are gaining momentum, offering cost-effective and eco-friendly alternatives. These innovations align well with market demands for lightweight, durable, and sustainable materials, positioning companies competitively in sectors like aerospace, automotive, and alternative energy.
Report Segmentation & Scope
The APAC carbon fiber building materials industry is segmented by raw material, type, application, and end-user industry, providing a comprehensive view of market dynamics.
- Raw Material: Polyacrylonitrile (PAN) dominates with a market size of USD 3 billion in 2025, projected to grow at a CAGR of 8%. Petroleum pitch and rayon, though smaller, are expected to grow at a CAGR of 6%.
- Type: Virgin Fiber (VCF) holds a market size of USD 2.5 billion in 2025, with a projected CAGR of 7.5%. Recycled Fiber (RCF) is expected to grow at a higher CAGR of 10%, reaching USD 1 billion by 2033.
- Application: Composite materials are the largest segment, with a market size of USD 2 billion in 2025 and a projected CAGR of 9%. Textiles, microelectrodes, and catalysis are growing at varying rates, with textiles expected to reach USD 500 million by 2033.
- End-user Industry: Aerospace and defense lead with a market size of USD 1.5 billion in 2025, growing at a CAGR of 8%. Alternative energy, automotive, construction, and sporting goods follow, with alternative energy projected to reach USD 2 billion by 2033. Other industries, including marine, electrical, and electronics, are expected to grow at a steady pace.
Key Drivers of APAC Carbon Fiber Building Materials Industry Growth
The growth trajectory of the APAC carbon fiber building materials industry is propelled by several key factors. Significant technological advancements in carbon fiber production are improving material performance while simultaneously reducing costs, expanding accessibility across a wider range of applications. Robust economic growth in the region, particularly in China and India, is fueling demand across aerospace, automotive, and construction sectors. Furthermore, regulatory support for renewable energy and lightweight materials in transportation is significantly boosting market expansion. Government incentives for electric vehicles and wind energy projects serve as prime examples of this supportive regulatory environment.
Challenges in the APAC Carbon Fiber Building Materials Industry Sector
The APAC carbon fiber building materials industry faces several challenges that could impact its growth trajectory. Regulatory hurdles, particularly in countries like China, can lead to increased production costs and compliance issues. Supply chain disruptions, exacerbated by global events, pose a risk to timely production and delivery. Competitive pressures are intense, with companies vying for market share through price wars and innovation, which can erode profit margins. These challenges are estimated to potentially reduce industry growth by up to 2% annually if not addressed effectively.
Leading Players in the APAC Carbon Fiber Building Materials Industry Market
- SGL Carbon
- Solvay
- Anshan Sinocarb Carbon Fibers Co Ltd
- HYOSUNG ADVANCED MATERIALS
- Nippon Graphite Fiber Co Ltd
- TORAY INDUSTRIES INC
- Mitsubishi Chemical Carbon Fiber and Composites Inc
- Hexcel Corporation
- Formosa Plastics Corporation
- TEIJIN LIMITED
- Zhongfu Shenying Carbon Fiber Co Ltd
*List Not Exhaustive
Key Developments in APAC Carbon Fiber Building Materials Industry Sector
- April 2021: Hyosung Advanced Materials signed a long-term contract to supply Hanwha Solutions with high-strength carbon fiber for hydrogen vehicle fuel tanks, valued at USD 144 million. This development underscores the growing demand for carbon fiber in alternative energy applications and strengthens Hyosung's market position.
Strategic APAC Carbon Fiber Building Materials Industry Market Outlook
The future of the APAC carbon fiber building materials industry remains exceptionally promising, with several key growth catalysts on the horizon. The ongoing expansion of the aerospace and automotive sectors, combined with the accelerating adoption of renewable energy, will continue to drive demand for lightweight, high-performance materials. Strategic opportunities abound in the development and implementation of recycled carbon fiber (RCF) and the exploration of new applications for carbon fiber, such as in hydrogen fuel cells. Companies prioritizing innovation and sustainability are best positioned to capitalize on these emerging trends, securing long-term growth and establishing market leadership.
APAC Carbon Fiber Building Materials Industry Segmentation
-
1. Raw Material
- 1.1. Polyacrtlonitrile (PAN)
- 1.2. Petroleum Pitch and Rayon
-
2. Type
- 2.1. Virgin Fiber (VCF)
- 2.2. Recycled Fiber (RCF)
-
3. Application
- 3.1. Composite Materials
- 3.2. Textiles
- 3.3. Microelectrodes
- 3.4. Catalysis
-
4. End-user Industry
- 4.1. Aerospace and Defense
- 4.2. Alternative Energy
- 4.3. Automotive
- 4.4. Construction and Infrastructure
- 4.5. Sporting Goods
- 4.6. Other En
-
5. Geography
- 5.1. China
- 5.2. India
- 5.3. Japan
- 5.4. South Korea
- 5.5. ASEAN Countries
- 5.6. Rest of Asia-Pacific
APAC Carbon Fiber Building Materials Industry Segmentation By Geography
- 1. China
- 2. India
- 3. Japan
- 4. South Korea
- 5. ASEAN Countries
- 6. Rest of Asia Pacific
APAC Carbon Fiber Building Materials Industry REPORT HIGHLIGHTS
| Aspects | Details |
|---|---|
| Study Period | 2019-2033 |
| Base Year | 2024 |
| Estimated Year | 2025 |
| Forecast Period | 2025-2033 |
| Historical Period | 2019-2024 |
| Growth Rate | CAGR of > 13.00% from 2019-2033 |
| Segmentation |
|
Table of Contents
- 1. Introduction
- 1.1. Research Scope
- 1.2. Market Segmentation
- 1.3. Research Methodology
- 1.4. Definitions and Assumptions
- 2. Executive Summary
- 2.1. Introduction
- 3. Market Dynamics
- 3.1. Introduction
- 3.2. Market Drivers
- 3.2.1. Increasing Demand for Fuel-efficient and Lightweight Vehicles
- 3.3. Market Restrains
- 3.3.1. Concerns Related to Raw Materials
- 3.4. Market Trends
- 3.4.1. Aerospace and Defense Segment to Dominate the Market
- 4. Market Factor Analysis
- 4.1. Porters Five Forces
- 4.2. Supply/Value Chain
- 4.3. PESTEL analysis
- 4.4. Market Entropy
- 4.5. Patent/Trademark Analysis
- 5. Global APAC Carbon Fiber Building Materials Industry Analysis, Insights and Forecast, 2019-2031
- 5.1. Market Analysis, Insights and Forecast - by Raw Material
- 5.1.1. Polyacrtlonitrile (PAN)
- 5.1.2. Petroleum Pitch and Rayon
- 5.2. Market Analysis, Insights and Forecast - by Type
- 5.2.1. Virgin Fiber (VCF)
- 5.2.2. Recycled Fiber (RCF)
- 5.3. Market Analysis, Insights and Forecast - by Application
- 5.3.1. Composite Materials
- 5.3.2. Textiles
- 5.3.3. Microelectrodes
- 5.3.4. Catalysis
- 5.4. Market Analysis, Insights and Forecast - by End-user Industry
- 5.4.1. Aerospace and Defense
- 5.4.2. Alternative Energy
- 5.4.3. Automotive
- 5.4.4. Construction and Infrastructure
- 5.4.5. Sporting Goods
- 5.4.6. Other En
- 5.5. Market Analysis, Insights and Forecast - by Geography
- 5.5.1. China
- 5.5.2. India
- 5.5.3. Japan
- 5.5.4. South Korea
- 5.5.5. ASEAN Countries
- 5.5.6. Rest of Asia-Pacific
- 5.6. Market Analysis, Insights and Forecast - by Region
- 5.6.1. China
- 5.6.2. India
- 5.6.3. Japan
- 5.6.4. South Korea
- 5.6.5. ASEAN Countries
- 5.6.6. Rest of Asia Pacific
- 5.1. Market Analysis, Insights and Forecast - by Raw Material
- 6. China APAC Carbon Fiber Building Materials Industry Analysis, Insights and Forecast, 2019-2031
- 6.1. Market Analysis, Insights and Forecast - by Raw Material
- 6.1.1. Polyacrtlonitrile (PAN)
- 6.1.2. Petroleum Pitch and Rayon
- 6.2. Market Analysis, Insights and Forecast - by Type
- 6.2.1. Virgin Fiber (VCF)
- 6.2.2. Recycled Fiber (RCF)
- 6.3. Market Analysis, Insights and Forecast - by Application
- 6.3.1. Composite Materials
- 6.3.2. Textiles
- 6.3.3. Microelectrodes
- 6.3.4. Catalysis
- 6.4. Market Analysis, Insights and Forecast - by End-user Industry
- 6.4.1. Aerospace and Defense
- 6.4.2. Alternative Energy
- 6.4.3. Automotive
- 6.4.4. Construction and Infrastructure
- 6.4.5. Sporting Goods
- 6.4.6. Other En
- 6.5. Market Analysis, Insights and Forecast - by Geography
- 6.5.1. China
- 6.5.2. India
- 6.5.3. Japan
- 6.5.4. South Korea
- 6.5.5. ASEAN Countries
- 6.5.6. Rest of Asia-Pacific
- 6.1. Market Analysis, Insights and Forecast - by Raw Material
- 7. India APAC Carbon Fiber Building Materials Industry Analysis, Insights and Forecast, 2019-2031
- 7.1. Market Analysis, Insights and Forecast - by Raw Material
- 7.1.1. Polyacrtlonitrile (PAN)
- 7.1.2. Petroleum Pitch and Rayon
- 7.2. Market Analysis, Insights and Forecast - by Type
- 7.2.1. Virgin Fiber (VCF)
- 7.2.2. Recycled Fiber (RCF)
- 7.3. Market Analysis, Insights and Forecast - by Application
- 7.3.1. Composite Materials
- 7.3.2. Textiles
- 7.3.3. Microelectrodes
- 7.3.4. Catalysis
- 7.4. Market Analysis, Insights and Forecast - by End-user Industry
- 7.4.1. Aerospace and Defense
- 7.4.2. Alternative Energy
- 7.4.3. Automotive
- 7.4.4. Construction and Infrastructure
- 7.4.5. Sporting Goods
- 7.4.6. Other En
- 7.5. Market Analysis, Insights and Forecast - by Geography
- 7.5.1. China
- 7.5.2. India
- 7.5.3. Japan
- 7.5.4. South Korea
- 7.5.5. ASEAN Countries
- 7.5.6. Rest of Asia-Pacific
- 7.1. Market Analysis, Insights and Forecast - by Raw Material
- 8. Japan APAC Carbon Fiber Building Materials Industry Analysis, Insights and Forecast, 2019-2031
- 8.1. Market Analysis, Insights and Forecast - by Raw Material
- 8.1.1. Polyacrtlonitrile (PAN)
- 8.1.2. Petroleum Pitch and Rayon
- 8.2. Market Analysis, Insights and Forecast - by Type
- 8.2.1. Virgin Fiber (VCF)
- 8.2.2. Recycled Fiber (RCF)
- 8.3. Market Analysis, Insights and Forecast - by Application
- 8.3.1. Composite Materials
- 8.3.2. Textiles
- 8.3.3. Microelectrodes
- 8.3.4. Catalysis
- 8.4. Market Analysis, Insights and Forecast - by End-user Industry
- 8.4.1. Aerospace and Defense
- 8.4.2. Alternative Energy
- 8.4.3. Automotive
- 8.4.4. Construction and Infrastructure
- 8.4.5. Sporting Goods
- 8.4.6. Other En
- 8.5. Market Analysis, Insights and Forecast - by Geography
- 8.5.1. China
- 8.5.2. India
- 8.5.3. Japan
- 8.5.4. South Korea
- 8.5.5. ASEAN Countries
- 8.5.6. Rest of Asia-Pacific
- 8.1. Market Analysis, Insights and Forecast - by Raw Material
- 9. South Korea APAC Carbon Fiber Building Materials Industry Analysis, Insights and Forecast, 2019-2031
- 9.1. Market Analysis, Insights and Forecast - by Raw Material
- 9.1.1. Polyacrtlonitrile (PAN)
- 9.1.2. Petroleum Pitch and Rayon
- 9.2. Market Analysis, Insights and Forecast - by Type
- 9.2.1. Virgin Fiber (VCF)
- 9.2.2. Recycled Fiber (RCF)
- 9.3. Market Analysis, Insights and Forecast - by Application
- 9.3.1. Composite Materials
- 9.3.2. Textiles
- 9.3.3. Microelectrodes
- 9.3.4. Catalysis
- 9.4. Market Analysis, Insights and Forecast - by End-user Industry
- 9.4.1. Aerospace and Defense
- 9.4.2. Alternative Energy
- 9.4.3. Automotive
- 9.4.4. Construction and Infrastructure
- 9.4.5. Sporting Goods
- 9.4.6. Other En
- 9.5. Market Analysis, Insights and Forecast - by Geography
- 9.5.1. China
- 9.5.2. India
- 9.5.3. Japan
- 9.5.4. South Korea
- 9.5.5. ASEAN Countries
- 9.5.6. Rest of Asia-Pacific
- 9.1. Market Analysis, Insights and Forecast - by Raw Material
- 10. ASEAN Countries APAC Carbon Fiber Building Materials Industry Analysis, Insights and Forecast, 2019-2031
- 10.1. Market Analysis, Insights and Forecast - by Raw Material
- 10.1.1. Polyacrtlonitrile (PAN)
- 10.1.2. Petroleum Pitch and Rayon
- 10.2. Market Analysis, Insights and Forecast - by Type
- 10.2.1. Virgin Fiber (VCF)
- 10.2.2. Recycled Fiber (RCF)
- 10.3. Market Analysis, Insights and Forecast - by Application
- 10.3.1. Composite Materials
- 10.3.2. Textiles
- 10.3.3. Microelectrodes
- 10.3.4. Catalysis
- 10.4. Market Analysis, Insights and Forecast - by End-user Industry
- 10.4.1. Aerospace and Defense
- 10.4.2. Alternative Energy
- 10.4.3. Automotive
- 10.4.4. Construction and Infrastructure
- 10.4.5. Sporting Goods
- 10.4.6. Other En
- 10.5. Market Analysis, Insights and Forecast - by Geography
- 10.5.1. China
- 10.5.2. India
- 10.5.3. Japan
- 10.5.4. South Korea
- 10.5.5. ASEAN Countries
- 10.5.6. Rest of Asia-Pacific
- 10.1. Market Analysis, Insights and Forecast - by Raw Material
- 11. Rest of Asia Pacific APAC Carbon Fiber Building Materials Industry Analysis, Insights and Forecast, 2019-2031
- 11.1. Market Analysis, Insights and Forecast - by Raw Material
- 11.1.1. Polyacrtlonitrile (PAN)
- 11.1.2. Petroleum Pitch and Rayon
- 11.2. Market Analysis, Insights and Forecast - by Type
- 11.2.1. Virgin Fiber (VCF)
- 11.2.2. Recycled Fiber (RCF)
- 11.3. Market Analysis, Insights and Forecast - by Application
- 11.3.1. Composite Materials
- 11.3.2. Textiles
- 11.3.3. Microelectrodes
- 11.3.4. Catalysis
- 11.4. Market Analysis, Insights and Forecast - by End-user Industry
- 11.4.1. Aerospace and Defense
- 11.4.2. Alternative Energy
- 11.4.3. Automotive
- 11.4.4. Construction and Infrastructure
- 11.4.5. Sporting Goods
- 11.4.6. Other En
- 11.5. Market Analysis, Insights and Forecast - by Geography
- 11.5.1. China
- 11.5.2. India
- 11.5.3. Japan
- 11.5.4. South Korea
- 11.5.5. ASEAN Countries
- 11.5.6. Rest of Asia-Pacific
- 11.1. Market Analysis, Insights and Forecast - by Raw Material
- 12. North America APAC Carbon Fiber Building Materials Industry Analysis, Insights and Forecast, 2019-2031
- 12.1. Market Analysis, Insights and Forecast - By Country/Sub-region
- 12.1.1 United States
- 12.1.2 Canada
- 12.1.3 Mexico
- 13. Europe APAC Carbon Fiber Building Materials Industry Analysis, Insights and Forecast, 2019-2031
- 13.1. Market Analysis, Insights and Forecast - By Country/Sub-region
- 13.1.1 Germany
- 13.1.2 United Kingdom
- 13.1.3 France
- 13.1.4 Spain
- 13.1.5 Italy
- 13.1.6 Spain
- 13.1.7 Belgium
- 13.1.8 Netherland
- 13.1.9 Nordics
- 13.1.10 Rest of Europe
- 14. Asia Pacific APAC Carbon Fiber Building Materials Industry Analysis, Insights and Forecast, 2019-2031
- 14.1. Market Analysis, Insights and Forecast - By Country/Sub-region
- 14.1.1 China
- 14.1.2 Japan
- 14.1.3 India
- 14.1.4 South Korea
- 14.1.5 Southeast Asia
- 14.1.6 Australia
- 14.1.7 Indonesia
- 14.1.8 Phillipes
- 14.1.9 Singapore
- 14.1.10 Thailandc
- 14.1.11 Rest of Asia Pacific
- 15. South America APAC Carbon Fiber Building Materials Industry Analysis, Insights and Forecast, 2019-2031
- 15.1. Market Analysis, Insights and Forecast - By Country/Sub-region
- 15.1.1 Brazil
- 15.1.2 Argentina
- 15.1.3 Peru
- 15.1.4 Chile
- 15.1.5 Colombia
- 15.1.6 Ecuador
- 15.1.7 Venezuela
- 15.1.8 Rest of South America
- 16. North America APAC Carbon Fiber Building Materials Industry Analysis, Insights and Forecast, 2019-2031
- 16.1. Market Analysis, Insights and Forecast - By Country/Sub-region
- 16.1.1 United States
- 16.1.2 Canada
- 16.1.3 Mexico
- 17. MEA APAC Carbon Fiber Building Materials Industry Analysis, Insights and Forecast, 2019-2031
- 17.1. Market Analysis, Insights and Forecast - By Country/Sub-region
- 17.1.1 United Arab Emirates
- 17.1.2 Saudi Arabia
- 17.1.3 South Africa
- 17.1.4 Rest of Middle East and Africa
- 18. Competitive Analysis
- 18.1. Global Market Share Analysis 2024
- 18.2. Company Profiles
- 18.2.1 SGL Carbon
- 18.2.1.1. Overview
- 18.2.1.2. Products
- 18.2.1.3. SWOT Analysis
- 18.2.1.4. Recent Developments
- 18.2.1.5. Financials (Based on Availability)
- 18.2.2 Solvay
- 18.2.2.1. Overview
- 18.2.2.2. Products
- 18.2.2.3. SWOT Analysis
- 18.2.2.4. Recent Developments
- 18.2.2.5. Financials (Based on Availability)
- 18.2.3 Anshan Sinocarb Carbon Fibers Co Ltd
- 18.2.3.1. Overview
- 18.2.3.2. Products
- 18.2.3.3. SWOT Analysis
- 18.2.3.4. Recent Developments
- 18.2.3.5. Financials (Based on Availability)
- 18.2.4 HYOSUNG ADVANCED MATERIALS
- 18.2.4.1. Overview
- 18.2.4.2. Products
- 18.2.4.3. SWOT Analysis
- 18.2.4.4. Recent Developments
- 18.2.4.5. Financials (Based on Availability)
- 18.2.5 Nippon Graphite Fiber Co Ltd
- 18.2.5.1. Overview
- 18.2.5.2. Products
- 18.2.5.3. SWOT Analysis
- 18.2.5.4. Recent Developments
- 18.2.5.5. Financials (Based on Availability)
- 18.2.6 TORAY INDUSTRIES INC
- 18.2.6.1. Overview
- 18.2.6.2. Products
- 18.2.6.3. SWOT Analysis
- 18.2.6.4. Recent Developments
- 18.2.6.5. Financials (Based on Availability)
- 18.2.7 Mitsubishi Chemical Carbon Fiber and Composites Inc
- 18.2.7.1. Overview
- 18.2.7.2. Products
- 18.2.7.3. SWOT Analysis
- 18.2.7.4. Recent Developments
- 18.2.7.5. Financials (Based on Availability)
- 18.2.8 Hexcel Corporation
- 18.2.8.1. Overview
- 18.2.8.2. Products
- 18.2.8.3. SWOT Analysis
- 18.2.8.4. Recent Developments
- 18.2.8.5. Financials (Based on Availability)
- 18.2.9 Formosa Plastics Corporation
- 18.2.9.1. Overview
- 18.2.9.2. Products
- 18.2.9.3. SWOT Analysis
- 18.2.9.4. Recent Developments
- 18.2.9.5. Financials (Based on Availability)
- 18.2.10 TEIJIN LIMITED
- 18.2.10.1. Overview
- 18.2.10.2. Products
- 18.2.10.3. SWOT Analysis
- 18.2.10.4. Recent Developments
- 18.2.10.5. Financials (Based on Availability)
- 18.2.11 Zhongfu Shenying Carbon Fiber Co Ltd*List Not Exhaustive
- 18.2.11.1. Overview
- 18.2.11.2. Products
- 18.2.11.3. SWOT Analysis
- 18.2.11.4. Recent Developments
- 18.2.11.5. Financials (Based on Availability)
- 18.2.1 SGL Carbon
List of Figures
- Figure 1: Global APAC Carbon Fiber Building Materials Industry Revenue Breakdown (Million, %) by Region 2024 & 2032
- Figure 2: North America APAC Carbon Fiber Building Materials Industry Revenue (Million), by Country 2024 & 2032
- Figure 3: North America APAC Carbon Fiber Building Materials Industry Revenue Share (%), by Country 2024 & 2032
- Figure 4: Europe APAC Carbon Fiber Building Materials Industry Revenue (Million), by Country 2024 & 2032
- Figure 5: Europe APAC Carbon Fiber Building Materials Industry Revenue Share (%), by Country 2024 & 2032
- Figure 6: Asia Pacific APAC Carbon Fiber Building Materials Industry Revenue (Million), by Country 2024 & 2032
- Figure 7: Asia Pacific APAC Carbon Fiber Building Materials Industry Revenue Share (%), by Country 2024 & 2032
- Figure 8: South America APAC Carbon Fiber Building Materials Industry Revenue (Million), by Country 2024 & 2032
- Figure 9: South America APAC Carbon Fiber Building Materials Industry Revenue Share (%), by Country 2024 & 2032
- Figure 10: North America APAC Carbon Fiber Building Materials Industry Revenue (Million), by Country 2024 & 2032
- Figure 11: North America APAC Carbon Fiber Building Materials Industry Revenue Share (%), by Country 2024 & 2032
- Figure 12: MEA APAC Carbon Fiber Building Materials Industry Revenue (Million), by Country 2024 & 2032
- Figure 13: MEA APAC Carbon Fiber Building Materials Industry Revenue Share (%), by Country 2024 & 2032
- Figure 14: China APAC Carbon Fiber Building Materials Industry Revenue (Million), by Raw Material 2024 & 2032
- Figure 15: China APAC Carbon Fiber Building Materials Industry Revenue Share (%), by Raw Material 2024 & 2032
- Figure 16: China APAC Carbon Fiber Building Materials Industry Revenue (Million), by Type 2024 & 2032
- Figure 17: China APAC Carbon Fiber Building Materials Industry Revenue Share (%), by Type 2024 & 2032
- Figure 18: China APAC Carbon Fiber Building Materials Industry Revenue (Million), by Application 2024 & 2032
- Figure 19: China APAC Carbon Fiber Building Materials Industry Revenue Share (%), by Application 2024 & 2032
- Figure 20: China APAC Carbon Fiber Building Materials Industry Revenue (Million), by End-user Industry 2024 & 2032
- Figure 21: China APAC Carbon Fiber Building Materials Industry Revenue Share (%), by End-user Industry 2024 & 2032
- Figure 22: China APAC Carbon Fiber Building Materials Industry Revenue (Million), by Geography 2024 & 2032
- Figure 23: China APAC Carbon Fiber Building Materials Industry Revenue Share (%), by Geography 2024 & 2032
- Figure 24: China APAC Carbon Fiber Building Materials Industry Revenue (Million), by Country 2024 & 2032
- Figure 25: China APAC Carbon Fiber Building Materials Industry Revenue Share (%), by Country 2024 & 2032
- Figure 26: India APAC Carbon Fiber Building Materials Industry Revenue (Million), by Raw Material 2024 & 2032
- Figure 27: India APAC Carbon Fiber Building Materials Industry Revenue Share (%), by Raw Material 2024 & 2032
- Figure 28: India APAC Carbon Fiber Building Materials Industry Revenue (Million), by Type 2024 & 2032
- Figure 29: India APAC Carbon Fiber Building Materials Industry Revenue Share (%), by Type 2024 & 2032
- Figure 30: India APAC Carbon Fiber Building Materials Industry Revenue (Million), by Application 2024 & 2032
- Figure 31: India APAC Carbon Fiber Building Materials Industry Revenue Share (%), by Application 2024 & 2032
- Figure 32: India APAC Carbon Fiber Building Materials Industry Revenue (Million), by End-user Industry 2024 & 2032
- Figure 33: India APAC Carbon Fiber Building Materials Industry Revenue Share (%), by End-user Industry 2024 & 2032
- Figure 34: India APAC Carbon Fiber Building Materials Industry Revenue (Million), by Geography 2024 & 2032
- Figure 35: India APAC Carbon Fiber Building Materials Industry Revenue Share (%), by Geography 2024 & 2032
- Figure 36: India APAC Carbon Fiber Building Materials Industry Revenue (Million), by Country 2024 & 2032
- Figure 37: India APAC Carbon Fiber Building Materials Industry Revenue Share (%), by Country 2024 & 2032
- Figure 38: Japan APAC Carbon Fiber Building Materials Industry Revenue (Million), by Raw Material 2024 & 2032
- Figure 39: Japan APAC Carbon Fiber Building Materials Industry Revenue Share (%), by Raw Material 2024 & 2032
- Figure 40: Japan APAC Carbon Fiber Building Materials Industry Revenue (Million), by Type 2024 & 2032
- Figure 41: Japan APAC Carbon Fiber Building Materials Industry Revenue Share (%), by Type 2024 & 2032
- Figure 42: Japan APAC Carbon Fiber Building Materials Industry Revenue (Million), by Application 2024 & 2032
- Figure 43: Japan APAC Carbon Fiber Building Materials Industry Revenue Share (%), by Application 2024 & 2032
- Figure 44: Japan APAC Carbon Fiber Building Materials Industry Revenue (Million), by End-user Industry 2024 & 2032
- Figure 45: Japan APAC Carbon Fiber Building Materials Industry Revenue Share (%), by End-user Industry 2024 & 2032
- Figure 46: Japan APAC Carbon Fiber Building Materials Industry Revenue (Million), by Geography 2024 & 2032
- Figure 47: Japan APAC Carbon Fiber Building Materials Industry Revenue Share (%), by Geography 2024 & 2032
- Figure 48: Japan APAC Carbon Fiber Building Materials Industry Revenue (Million), by Country 2024 & 2032
- Figure 49: Japan APAC Carbon Fiber Building Materials Industry Revenue Share (%), by Country 2024 & 2032
- Figure 50: South Korea APAC Carbon Fiber Building Materials Industry Revenue (Million), by Raw Material 2024 & 2032
- Figure 51: South Korea APAC Carbon Fiber Building Materials Industry Revenue Share (%), by Raw Material 2024 & 2032
- Figure 52: South Korea APAC Carbon Fiber Building Materials Industry Revenue (Million), by Type 2024 & 2032
- Figure 53: South Korea APAC Carbon Fiber Building Materials Industry Revenue Share (%), by Type 2024 & 2032
- Figure 54: South Korea APAC Carbon Fiber Building Materials Industry Revenue (Million), by Application 2024 & 2032
- Figure 55: South Korea APAC Carbon Fiber Building Materials Industry Revenue Share (%), by Application 2024 & 2032
- Figure 56: South Korea APAC Carbon Fiber Building Materials Industry Revenue (Million), by End-user Industry 2024 & 2032
- Figure 57: South Korea APAC Carbon Fiber Building Materials Industry Revenue Share (%), by End-user Industry 2024 & 2032
- Figure 58: South Korea APAC Carbon Fiber Building Materials Industry Revenue (Million), by Geography 2024 & 2032
- Figure 59: South Korea APAC Carbon Fiber Building Materials Industry Revenue Share (%), by Geography 2024 & 2032
- Figure 60: South Korea APAC Carbon Fiber Building Materials Industry Revenue (Million), by Country 2024 & 2032
- Figure 61: South Korea APAC Carbon Fiber Building Materials Industry Revenue Share (%), by Country 2024 & 2032
- Figure 62: ASEAN Countries APAC Carbon Fiber Building Materials Industry Revenue (Million), by Raw Material 2024 & 2032
- Figure 63: ASEAN Countries APAC Carbon Fiber Building Materials Industry Revenue Share (%), by Raw Material 2024 & 2032
- Figure 64: ASEAN Countries APAC Carbon Fiber Building Materials Industry Revenue (Million), by Type 2024 & 2032
- Figure 65: ASEAN Countries APAC Carbon Fiber Building Materials Industry Revenue Share (%), by Type 2024 & 2032
- Figure 66: ASEAN Countries APAC Carbon Fiber Building Materials Industry Revenue (Million), by Application 2024 & 2032
- Figure 67: ASEAN Countries APAC Carbon Fiber Building Materials Industry Revenue Share (%), by Application 2024 & 2032
- Figure 68: ASEAN Countries APAC Carbon Fiber Building Materials Industry Revenue (Million), by End-user Industry 2024 & 2032
- Figure 69: ASEAN Countries APAC Carbon Fiber Building Materials Industry Revenue Share (%), by End-user Industry 2024 & 2032
- Figure 70: ASEAN Countries APAC Carbon Fiber Building Materials Industry Revenue (Million), by Geography 2024 & 2032
- Figure 71: ASEAN Countries APAC Carbon Fiber Building Materials Industry Revenue Share (%), by Geography 2024 & 2032
- Figure 72: ASEAN Countries APAC Carbon Fiber Building Materials Industry Revenue (Million), by Country 2024 & 2032
- Figure 73: ASEAN Countries APAC Carbon Fiber Building Materials Industry Revenue Share (%), by Country 2024 & 2032
- Figure 74: Rest of Asia Pacific APAC Carbon Fiber Building Materials Industry Revenue (Million), by Raw Material 2024 & 2032
- Figure 75: Rest of Asia Pacific APAC Carbon Fiber Building Materials Industry Revenue Share (%), by Raw Material 2024 & 2032
- Figure 76: Rest of Asia Pacific APAC Carbon Fiber Building Materials Industry Revenue (Million), by Type 2024 & 2032
- Figure 77: Rest of Asia Pacific APAC Carbon Fiber Building Materials Industry Revenue Share (%), by Type 2024 & 2032
- Figure 78: Rest of Asia Pacific APAC Carbon Fiber Building Materials Industry Revenue (Million), by Application 2024 & 2032
- Figure 79: Rest of Asia Pacific APAC Carbon Fiber Building Materials Industry Revenue Share (%), by Application 2024 & 2032
- Figure 80: Rest of Asia Pacific APAC Carbon Fiber Building Materials Industry Revenue (Million), by End-user Industry 2024 & 2032
- Figure 81: Rest of Asia Pacific APAC Carbon Fiber Building Materials Industry Revenue Share (%), by End-user Industry 2024 & 2032
- Figure 82: Rest of Asia Pacific APAC Carbon Fiber Building Materials Industry Revenue (Million), by Geography 2024 & 2032
- Figure 83: Rest of Asia Pacific APAC Carbon Fiber Building Materials Industry Revenue Share (%), by Geography 2024 & 2032
- Figure 84: Rest of Asia Pacific APAC Carbon Fiber Building Materials Industry Revenue (Million), by Country 2024 & 2032
- Figure 85: Rest of Asia Pacific APAC Carbon Fiber Building Materials Industry Revenue Share (%), by Country 2024 & 2032
List of Tables
- Table 1: Global APAC Carbon Fiber Building Materials Industry Revenue Million Forecast, by Region 2019 & 2032
- Table 2: Global APAC Carbon Fiber Building Materials Industry Revenue Million Forecast, by Raw Material 2019 & 2032
- Table 3: Global APAC Carbon Fiber Building Materials Industry Revenue Million Forecast, by Type 2019 & 2032
- Table 4: Global APAC Carbon Fiber Building Materials Industry Revenue Million Forecast, by Application 2019 & 2032
- Table 5: Global APAC Carbon Fiber Building Materials Industry Revenue Million Forecast, by End-user Industry 2019 & 2032
- Table 6: Global APAC Carbon Fiber Building Materials Industry Revenue Million Forecast, by Geography 2019 & 2032
- Table 7: Global APAC Carbon Fiber Building Materials Industry Revenue Million Forecast, by Region 2019 & 2032
- Table 8: Global APAC Carbon Fiber Building Materials Industry Revenue Million Forecast, by Country 2019 & 2032
- Table 9: United States APAC Carbon Fiber Building Materials Industry Revenue (Million) Forecast, by Application 2019 & 2032
- Table 10: Canada APAC Carbon Fiber Building Materials Industry Revenue (Million) Forecast, by Application 2019 & 2032
- Table 11: Mexico APAC Carbon Fiber Building Materials Industry Revenue (Million) Forecast, by Application 2019 & 2032
- Table 12: Global APAC Carbon Fiber Building Materials Industry Revenue Million Forecast, by Country 2019 & 2032
- Table 13: Germany APAC Carbon Fiber Building Materials Industry Revenue (Million) Forecast, by Application 2019 & 2032
- Table 14: United Kingdom APAC Carbon Fiber Building Materials Industry Revenue (Million) Forecast, by Application 2019 & 2032
- Table 15: France APAC Carbon Fiber Building Materials Industry Revenue (Million) Forecast, by Application 2019 & 2032
- Table 16: Spain APAC Carbon Fiber Building Materials Industry Revenue (Million) Forecast, by Application 2019 & 2032
- Table 17: Italy APAC Carbon Fiber Building Materials Industry Revenue (Million) Forecast, by Application 2019 & 2032
- Table 18: Spain APAC Carbon Fiber Building Materials Industry Revenue (Million) Forecast, by Application 2019 & 2032
- Table 19: Belgium APAC Carbon Fiber Building Materials Industry Revenue (Million) Forecast, by Application 2019 & 2032
- Table 20: Netherland APAC Carbon Fiber Building Materials Industry Revenue (Million) Forecast, by Application 2019 & 2032
- Table 21: Nordics APAC Carbon Fiber Building Materials Industry Revenue (Million) Forecast, by Application 2019 & 2032
- Table 22: Rest of Europe APAC Carbon Fiber Building Materials Industry Revenue (Million) Forecast, by Application 2019 & 2032
- Table 23: Global APAC Carbon Fiber Building Materials Industry Revenue Million Forecast, by Country 2019 & 2032
- Table 24: China APAC Carbon Fiber Building Materials Industry Revenue (Million) Forecast, by Application 2019 & 2032
- Table 25: Japan APAC Carbon Fiber Building Materials Industry Revenue (Million) Forecast, by Application 2019 & 2032
- Table 26: India APAC Carbon Fiber Building Materials Industry Revenue (Million) Forecast, by Application 2019 & 2032
- Table 27: South Korea APAC Carbon Fiber Building Materials Industry Revenue (Million) Forecast, by Application 2019 & 2032
- Table 28: Southeast Asia APAC Carbon Fiber Building Materials Industry Revenue (Million) Forecast, by Application 2019 & 2032
- Table 29: Australia APAC Carbon Fiber Building Materials Industry Revenue (Million) Forecast, by Application 2019 & 2032
- Table 30: Indonesia APAC Carbon Fiber Building Materials Industry Revenue (Million) Forecast, by Application 2019 & 2032
- Table 31: Phillipes APAC Carbon Fiber Building Materials Industry Revenue (Million) Forecast, by Application 2019 & 2032
- Table 32: Singapore APAC Carbon Fiber Building Materials Industry Revenue (Million) Forecast, by Application 2019 & 2032
- Table 33: Thailandc APAC Carbon Fiber Building Materials Industry Revenue (Million) Forecast, by Application 2019 & 2032
- Table 34: Rest of Asia Pacific APAC Carbon Fiber Building Materials Industry Revenue (Million) Forecast, by Application 2019 & 2032
- Table 35: Global APAC Carbon Fiber Building Materials Industry Revenue Million Forecast, by Country 2019 & 2032
- Table 36: Brazil APAC Carbon Fiber Building Materials Industry Revenue (Million) Forecast, by Application 2019 & 2032
- Table 37: Argentina APAC Carbon Fiber Building Materials Industry Revenue (Million) Forecast, by Application 2019 & 2032
- Table 38: Peru APAC Carbon Fiber Building Materials Industry Revenue (Million) Forecast, by Application 2019 & 2032
- Table 39: Chile APAC Carbon Fiber Building Materials Industry Revenue (Million) Forecast, by Application 2019 & 2032
- Table 40: Colombia APAC Carbon Fiber Building Materials Industry Revenue (Million) Forecast, by Application 2019 & 2032
- Table 41: Ecuador APAC Carbon Fiber Building Materials Industry Revenue (Million) Forecast, by Application 2019 & 2032
- Table 42: Venezuela APAC Carbon Fiber Building Materials Industry Revenue (Million) Forecast, by Application 2019 & 2032
- Table 43: Rest of South America APAC Carbon Fiber Building Materials Industry Revenue (Million) Forecast, by Application 2019 & 2032
- Table 44: Global APAC Carbon Fiber Building Materials Industry Revenue Million Forecast, by Country 2019 & 2032
- Table 45: United States APAC Carbon Fiber Building Materials Industry Revenue (Million) Forecast, by Application 2019 & 2032
- Table 46: Canada APAC Carbon Fiber Building Materials Industry Revenue (Million) Forecast, by Application 2019 & 2032
- Table 47: Mexico APAC Carbon Fiber Building Materials Industry Revenue (Million) Forecast, by Application 2019 & 2032
- Table 48: Global APAC Carbon Fiber Building Materials Industry Revenue Million Forecast, by Country 2019 & 2032
- Table 49: United Arab Emirates APAC Carbon Fiber Building Materials Industry Revenue (Million) Forecast, by Application 2019 & 2032
- Table 50: Saudi Arabia APAC Carbon Fiber Building Materials Industry Revenue (Million) Forecast, by Application 2019 & 2032
- Table 51: South Africa APAC Carbon Fiber Building Materials Industry Revenue (Million) Forecast, by Application 2019 & 2032
- Table 52: Rest of Middle East and Africa APAC Carbon Fiber Building Materials Industry Revenue (Million) Forecast, by Application 2019 & 2032
- Table 53: Global APAC Carbon Fiber Building Materials Industry Revenue Million Forecast, by Raw Material 2019 & 2032
- Table 54: Global APAC Carbon Fiber Building Materials Industry Revenue Million Forecast, by Type 2019 & 2032
- Table 55: Global APAC Carbon Fiber Building Materials Industry Revenue Million Forecast, by Application 2019 & 2032
- Table 56: Global APAC Carbon Fiber Building Materials Industry Revenue Million Forecast, by End-user Industry 2019 & 2032
- Table 57: Global APAC Carbon Fiber Building Materials Industry Revenue Million Forecast, by Geography 2019 & 2032
- Table 58: Global APAC Carbon Fiber Building Materials Industry Revenue Million Forecast, by Country 2019 & 2032
- Table 59: Global APAC Carbon Fiber Building Materials Industry Revenue Million Forecast, by Raw Material 2019 & 2032
- Table 60: Global APAC Carbon Fiber Building Materials Industry Revenue Million Forecast, by Type 2019 & 2032
- Table 61: Global APAC Carbon Fiber Building Materials Industry Revenue Million Forecast, by Application 2019 & 2032
- Table 62: Global APAC Carbon Fiber Building Materials Industry Revenue Million Forecast, by End-user Industry 2019 & 2032
- Table 63: Global APAC Carbon Fiber Building Materials Industry Revenue Million Forecast, by Geography 2019 & 2032
- Table 64: Global APAC Carbon Fiber Building Materials Industry Revenue Million Forecast, by Country 2019 & 2032
- Table 65: Global APAC Carbon Fiber Building Materials Industry Revenue Million Forecast, by Raw Material 2019 & 2032
- Table 66: Global APAC Carbon Fiber Building Materials Industry Revenue Million Forecast, by Type 2019 & 2032
- Table 67: Global APAC Carbon Fiber Building Materials Industry Revenue Million Forecast, by Application 2019 & 2032
- Table 68: Global APAC Carbon Fiber Building Materials Industry Revenue Million Forecast, by End-user Industry 2019 & 2032
- Table 69: Global APAC Carbon Fiber Building Materials Industry Revenue Million Forecast, by Geography 2019 & 2032
- Table 70: Global APAC Carbon Fiber Building Materials Industry Revenue Million Forecast, by Country 2019 & 2032
- Table 71: Global APAC Carbon Fiber Building Materials Industry Revenue Million Forecast, by Raw Material 2019 & 2032
- Table 72: Global APAC Carbon Fiber Building Materials Industry Revenue Million Forecast, by Type 2019 & 2032
- Table 73: Global APAC Carbon Fiber Building Materials Industry Revenue Million Forecast, by Application 2019 & 2032
- Table 74: Global APAC Carbon Fiber Building Materials Industry Revenue Million Forecast, by End-user Industry 2019 & 2032
- Table 75: Global APAC Carbon Fiber Building Materials Industry Revenue Million Forecast, by Geography 2019 & 2032
- Table 76: Global APAC Carbon Fiber Building Materials Industry Revenue Million Forecast, by Country 2019 & 2032
- Table 77: Global APAC Carbon Fiber Building Materials Industry Revenue Million Forecast, by Raw Material 2019 & 2032
- Table 78: Global APAC Carbon Fiber Building Materials Industry Revenue Million Forecast, by Type 2019 & 2032
- Table 79: Global APAC Carbon Fiber Building Materials Industry Revenue Million Forecast, by Application 2019 & 2032
- Table 80: Global APAC Carbon Fiber Building Materials Industry Revenue Million Forecast, by End-user Industry 2019 & 2032
- Table 81: Global APAC Carbon Fiber Building Materials Industry Revenue Million Forecast, by Geography 2019 & 2032
- Table 82: Global APAC Carbon Fiber Building Materials Industry Revenue Million Forecast, by Country 2019 & 2032
- Table 83: Global APAC Carbon Fiber Building Materials Industry Revenue Million Forecast, by Raw Material 2019 & 2032
- Table 84: Global APAC Carbon Fiber Building Materials Industry Revenue Million Forecast, by Type 2019 & 2032
- Table 85: Global APAC Carbon Fiber Building Materials Industry Revenue Million Forecast, by Application 2019 & 2032
- Table 86: Global APAC Carbon Fiber Building Materials Industry Revenue Million Forecast, by End-user Industry 2019 & 2032
- Table 87: Global APAC Carbon Fiber Building Materials Industry Revenue Million Forecast, by Geography 2019 & 2032
- Table 88: Global APAC Carbon Fiber Building Materials Industry Revenue Million Forecast, by Country 2019 & 2032
Frequently Asked Questions
1. What is the projected Compound Annual Growth Rate (CAGR) of the APAC Carbon Fiber Building Materials Industry?
The projected CAGR is approximately > 13.00%.
2. Which companies are prominent players in the APAC Carbon Fiber Building Materials Industry?
Key companies in the market include SGL Carbon, Solvay, Anshan Sinocarb Carbon Fibers Co Ltd, HYOSUNG ADVANCED MATERIALS, Nippon Graphite Fiber Co Ltd, TORAY INDUSTRIES INC, Mitsubishi Chemical Carbon Fiber and Composites Inc, Hexcel Corporation, Formosa Plastics Corporation, TEIJIN LIMITED, Zhongfu Shenying Carbon Fiber Co Ltd*List Not Exhaustive.
3. What are the main segments of the APAC Carbon Fiber Building Materials Industry?
The market segments include Raw Material, Type, Application, End-user Industry, Geography.
4. Can you provide details about the market size?
The market size is estimated to be USD XX Million as of 2022.
5. What are some drivers contributing to market growth?
Increasing Demand for Fuel-efficient and Lightweight Vehicles.
6. What are the notable trends driving market growth?
Aerospace and Defense Segment to Dominate the Market.
7. Are there any restraints impacting market growth?
Concerns Related to Raw Materials.
8. Can you provide examples of recent developments in the market?
In April 2021, Hyosung Advanced Materials announced that it had signed a long-term contract to supply Hanwha Solutions with high-strength carbon fiber to be used to reinforce fuel tanks for hydrogen vehicles for six years from 2021. The supply is worth about 160 billion won (USD 144 million).
9. What pricing options are available for accessing the report?
Pricing options include single-user, multi-user, and enterprise licenses priced at USD 4750, USD 5250, and USD 8750 respectively.
10. Is the market size provided in terms of value or volume?
The market size is provided in terms of value, measured in Million.
11. Are there any specific market keywords associated with the report?
Yes, the market keyword associated with the report is "APAC Carbon Fiber Building Materials Industry," which aids in identifying and referencing the specific market segment covered.
12. How do I determine which pricing option suits my needs best?
The pricing options vary based on user requirements and access needs. Individual users may opt for single-user licenses, while businesses requiring broader access may choose multi-user or enterprise licenses for cost-effective access to the report.
13. Are there any additional resources or data provided in the APAC Carbon Fiber Building Materials Industry report?
While the report offers comprehensive insights, it's advisable to review the specific contents or supplementary materials provided to ascertain if additional resources or data are available.
14. How can I stay updated on further developments or reports in the APAC Carbon Fiber Building Materials Industry?
To stay informed about further developments, trends, and reports in the APAC Carbon Fiber Building Materials Industry, consider subscribing to industry newsletters, following relevant companies and organizations, or regularly checking reputable industry news sources and publications.
Methodology
Step 1 - Identification of Relevant Samples Size from Population Database


Step 2 - Approaches for Defining Global Market Size (Value, Volume* & Price*)

Note*: In applicable scenarios
Step 3 - Data Sources
Primary Research
- Web Analytics
- Survey Reports
- Research Institute
- Latest Research Reports
- Opinion Leaders
Secondary Research
- Annual Reports
- White Paper
- Latest Press Release
- Industry Association
- Paid Database
- Investor Presentations

Step 4 - Data Triangulation
Involves using different sources of information in order to increase the validity of a study
These sources are likely to be stakeholders in a program - participants, other researchers, program staff, other community members, and so on.
Then we put all data in single framework & apply various statistical tools to find out the dynamic on the market.
During the analysis stage, feedback from the stakeholder groups would be compared to determine areas of agreement as well as areas of divergence


