
Key Insights
The Asia-Pacific (APAC) 3D telepresence market is experiencing robust growth, driven by increasing demand for immersive communication solutions across diverse sectors. The region's burgeoning economies, coupled with rapid technological advancements, are fueling this expansion. Education, advertising, and conferencing are key application areas witnessing significant adoption. Software solutions currently dominate the market share, but the hardware segment is expected to experience substantial growth fueled by advancements in display technology and improved user experiences. China, Japan, South Korea, and India are leading the market, with China holding the largest market share due to its massive population and robust digital infrastructure. However, other countries within the region are also showing promising growth potential, driven by increasing investments in infrastructure and digital literacy initiatives. The market's growth is further propelled by the need for enhanced collaboration and reduced travel costs, especially within large multinational corporations and educational institutions. Challenges include the high initial investment costs associated with 3D telepresence systems, along with the need for robust internet bandwidth and technical expertise.
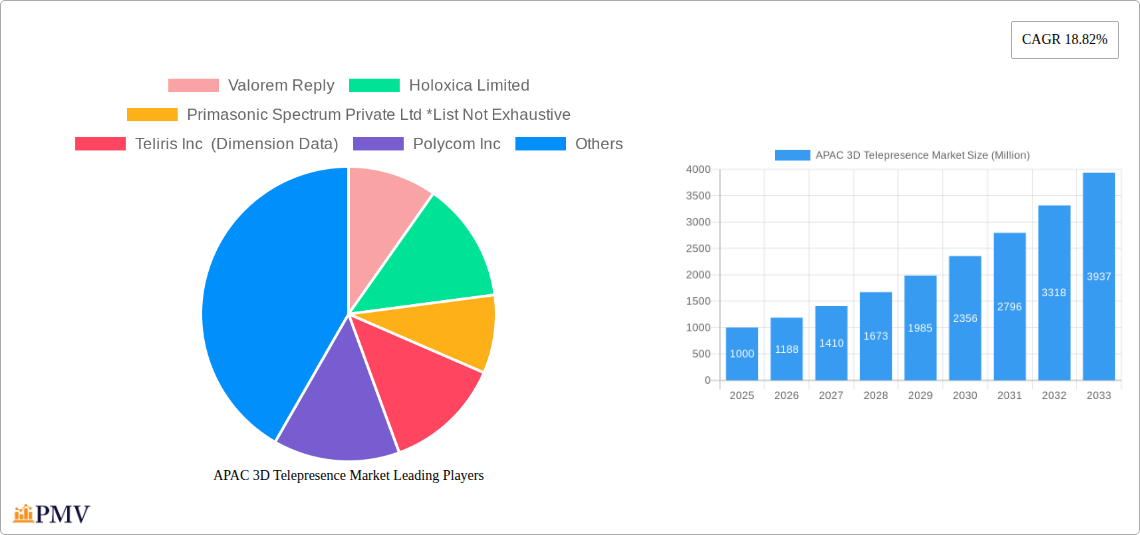
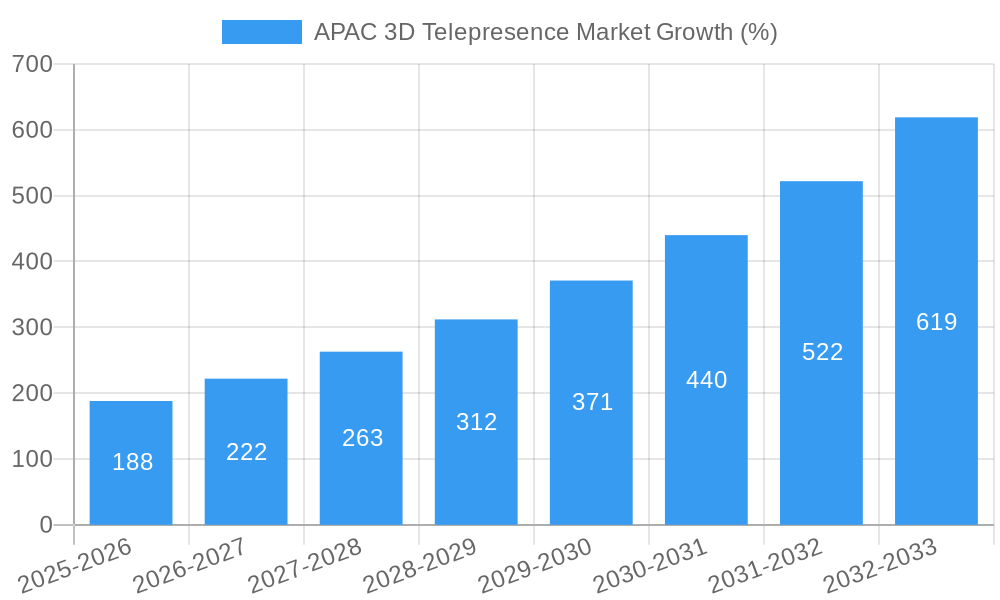
Despite these restraints, the forecast for the APAC 3D telepresence market from 2025 to 2033 is highly positive. The compound annual growth rate (CAGR) of 18.82% suggests substantial expansion, translating into a significant increase in market value within the forecast period. To support this growth, companies like Valorem Reply, Holoxica Limited, and others are continuously innovating, releasing enhanced software, and developing more user-friendly hardware. As costs decrease and technology matures, wider adoption across various industries and consumer segments is expected, further solidifying the APAC region's position as a key player in the global 3D telepresence market. This sustained growth will be driven by continuous technological advancements, creating increasingly immersive and accessible solutions for a wider range of users.
APAC 3D Telepresence Market: A Comprehensive Report (2019-2033)
This in-depth report provides a comprehensive analysis of the Asia-Pacific (APAC) 3D telepresence market, offering invaluable insights for businesses, investors, and stakeholders seeking to understand this rapidly evolving sector. The report covers the period from 2019 to 2033, with a focus on the estimated year 2025 and a forecast period extending to 2033. Key market segments, competitive dynamics, and future growth prospects are thoroughly examined. The market size is expected to reach xx Million by 2033.
APAC 3D Telepresence Market Structure & Competitive Dynamics
The APAC 3D telepresence market exhibits a moderately concentrated structure, with several key players vying for market share. The market is characterized by a dynamic innovation ecosystem, driven by ongoing technological advancements in areas like augmented reality (AR), virtual reality (VR), and holographic projection. Regulatory frameworks vary across APAC countries, influencing market entry and operations. Product substitutes, such as traditional video conferencing solutions, present ongoing competitive pressure. End-user trends, particularly the increasing adoption of remote work and collaboration tools, significantly impact market growth. Mergers and acquisitions (M&A) activity within the sector is relatively moderate; however, strategic partnerships are increasingly prevalent.
- Market Concentration: Moderately concentrated, with a few dominant players holding significant market share. The top five players account for approximately xx% of the market.
- Innovation Ecosystems: Strong focus on AR/VR integration and development of advanced holographic technologies.
- Regulatory Frameworks: Vary across countries, impacting market access and compliance requirements.
- Product Substitutes: Traditional video conferencing technologies pose a significant competitive threat.
- End-User Trends: Growing preference for remote work and collaboration fuels demand for 3D telepresence solutions.
- M&A Activity: Moderate M&A activity; valued at approximately xx Million in the historical period (2019-2024).
APAC 3D Telepresence Market Industry Trends & Insights
The APAC 3D telepresence market is witnessing significant growth, driven by several key factors. Technological advancements in areas such as higher-resolution displays, improved bandwidth capabilities, and more sophisticated software are enabling more immersive and realistic 3D telepresence experiences. Increased adoption of cloud-based solutions is streamlining deployment and reducing infrastructure costs. The rising demand for remote collaboration across various industries, from education and healthcare to business and entertainment, is further propelling market expansion. Consumer preferences are shifting towards more interactive and engaging communication tools, leading to greater demand for immersive technologies like 3D telepresence. The competitive landscape is dynamic, with companies continuously innovating to offer superior solutions and capture market share. The market is expected to register a Compound Annual Growth Rate (CAGR) of xx% during the forecast period (2025-2033), with market penetration steadily increasing across various segments.
Dominant Markets & Segments in APAC 3D Telepresence Market
China currently dominates the APAC 3D telepresence market, driven by its large economy, robust technological infrastructure, and significant investments in digital transformation initiatives. However, other countries like Japan, India, and South Korea are experiencing considerable growth.
- By Solution Type: The hardware segment holds a larger market share currently, due to higher initial investment costs, but the software segment is projected to experience faster growth due to increasing cloud adoption and SaaS solutions.
- By Application: The conferencing segment currently holds the largest market share driven by its application in businesses, but the education and advertising sectors show immense potential for future growth.
- By Country:
- China: Dominant market share due to its large economy and robust digital infrastructure. Key drivers include substantial government investments in technology and a rapidly growing enterprise sector.
- Japan: Strong growth driven by its advanced technological capabilities and adoption of cutting-edge communication solutions.
- India: Rapidly expanding market fuelled by increasing internet penetration, expanding IT sector, and rising demand for efficient communication solutions.
- South Korea: Significant market presence with strong government support and a technologically savvy population.
- Rest of Asia Pacific: Displays moderate growth potential with several countries progressively adopting 3D telepresence technologies.
APAC 3D Telepresence Market Product Innovations
Recent product innovations focus on enhanced realism, improved interactivity, and seamless integration with existing communication platforms. Advances in holographic projection, AR/VR overlays, and AI-powered features are enhancing user experiences. Companies are emphasizing user-friendly interfaces, improved network optimization, and cost-effective solutions to broaden market adoption. The market trend is toward greater affordability and accessibility, making 3D telepresence technology more attractive to a wider range of users.
Report Segmentation & Scope
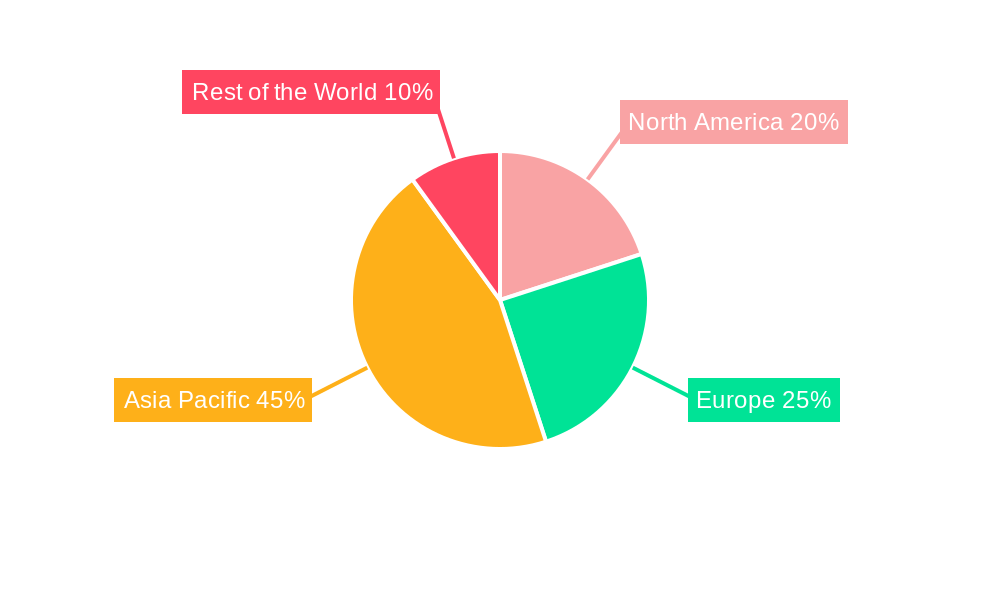
This report segments the APAC 3D telepresence market based on solution type (software and hardware), application (education, advertising, conferencing), and country (China, Japan, India, South Korea, and the Rest of Asia Pacific). Each segment's growth projections, market sizes, and competitive dynamics are analyzed separately. The report provides a detailed breakdown of the market's current status and future growth potential across all these segments. For example, the software segment is anticipated to grow at a faster rate than hardware, driven by SaaS and cloud solutions. Similarly, while conferencing currently dominates, education and advertising applications are expected to see significant expansion in the coming years.
Key Drivers of APAC 3D Telepresence Market Growth
Several factors fuel the growth of the APAC 3D telepresence market. Technological advancements, including improved resolution, bandwidth, and user interfaces, make 3D telepresence more accessible and engaging. The increasing adoption of remote work and the need for efficient collaboration across diverse geographical locations drive demand. Government initiatives promoting digital transformation in various sectors further support market expansion. The growing popularity of immersive technologies is a powerful driver of growth. Economic growth and increasing disposable incomes in many APAC countries contribute to greater investment in advanced communication technologies.
Challenges in the APAC 3D Telepresence Market Sector
Despite its potential, the APAC 3D telepresence market faces challenges. High initial investment costs can hinder wider adoption, particularly for smaller businesses. Network infrastructure limitations in certain regions can impact the quality and reliability of 3D telepresence services. Regulatory hurdles and data privacy concerns can complicate market penetration in some countries. Furthermore, competition from traditional video conferencing solutions and the need for skilled technical support pose significant challenges. These factors combine to restrict the overall market penetration.
Leading Players in the APAC 3D Telepresence Market Market
- Valorem Reply
- Holoxica Limited
- Primasonic Spectrum Private Ltd
- Teliris Inc (Dimension Data)
- Polycom Inc
- Cisco Systems Inc
- Microsoft Corporation
- MDH Hologram Ltd
- ZTE Corporation
- Musion 3D
- TelePresence Tech
- Digital Video Enterprises Inc
Key Developments in APAC 3D Telepresence Market Sector
- June 2023: The Pro Integration Future Asia 2023 (PIFA2023) conference highlighted the increasing interest in unified communications and immersive technologies within the APAC region, signaling strong potential for 3D telepresence solutions.
- November 2022: Medtronic's launch of its Customer eXperience Center (MCXC) in Singapore showcases the growing adoption of extended reality (XR) and virtual technologies for remote training and collaboration within the healthcare sector, impacting the market dynamics for 3D telepresence solutions in healthcare applications.
Strategic APAC 3D Telepresence Market Outlook
The APAC 3D telepresence market presents significant growth opportunities. Future growth will be driven by continued technological innovation, increasing demand for remote collaboration, and rising investments in digital infrastructure. Strategic partnerships between technology providers and industry players will be crucial for expanding market reach and developing tailored solutions for various applications. The focus will shift towards making 3D telepresence more affordable, user-friendly, and accessible to a wider range of users across diverse sectors. The market's future is bright, with substantial potential for expansion in the years to come.
APAC 3D Telepresence Market Segmentation
-
1. Solution Type
- 1.1. Software
- 1.2. Hardware
-
2. Application
- 2.1. Education
- 2.2. Advertising
- 2.3. Conferencing
APAC 3D Telepresence Market Segmentation By Geography
-
1. North America
- 1.1. United States
- 1.2. Canada
- 1.3. Mexico
-
2. South America
- 2.1. Brazil
- 2.2. Argentina
- 2.3. Rest of South America
-
3. Europe
- 3.1. United Kingdom
- 3.2. Germany
- 3.3. France
- 3.4. Italy
- 3.5. Spain
- 3.6. Russia
- 3.7. Benelux
- 3.8. Nordics
- 3.9. Rest of Europe
-
4. Middle East & Africa
- 4.1. Turkey
- 4.2. Israel
- 4.3. GCC
- 4.4. North Africa
- 4.5. South Africa
- 4.6. Rest of Middle East & Africa
-
5. Asia Pacific
- 5.1. China
- 5.2. India
- 5.3. Japan
- 5.4. South Korea
- 5.5. ASEAN
- 5.6. Oceania
- 5.7. Rest of Asia Pacific
APAC 3D Telepresence Market REPORT HIGHLIGHTS
| Aspects | Details |
|---|---|
| Study Period | 2019-2033 |
| Base Year | 2024 |
| Estimated Year | 2025 |
| Forecast Period | 2025-2033 |
| Historical Period | 2019-2024 |
| Growth Rate | CAGR of 18.82% from 2019-2033 |
| Segmentation |
|
Table of Contents
- 1. Introduction
- 1.1. Research Scope
- 1.2. Market Segmentation
- 1.3. Research Methodology
- 1.4. Definitions and Assumptions
- 2. Executive Summary
- 2.1. Introduction
- 3. Market Dynamics
- 3.1. Introduction
- 3.2. Market Drivers
- 3.2.1. Enhanced User Experience; Increasing Demand For Time-Saving Technologies In Organizations
- 3.3. Market Restrains
- 3.3.1. High Costs And Limited Commercialization
- 3.4. Market Trends
- 3.4.1. Conferencing Application Segment is Expected to Hold Significant Market Share
- 4. Market Factor Analysis
- 4.1. Porters Five Forces
- 4.2. Supply/Value Chain
- 4.3. PESTEL analysis
- 4.4. Market Entropy
- 4.5. Patent/Trademark Analysis
- 5. Global APAC 3D Telepresence Market Analysis, Insights and Forecast, 2019-2031
- 5.1. Market Analysis, Insights and Forecast - by Solution Type
- 5.1.1. Software
- 5.1.2. Hardware
- 5.2. Market Analysis, Insights and Forecast - by Application
- 5.2.1. Education
- 5.2.2. Advertising
- 5.2.3. Conferencing
- 5.3. Market Analysis, Insights and Forecast - by Region
- 5.3.1. North America
- 5.3.2. South America
- 5.3.3. Europe
- 5.3.4. Middle East & Africa
- 5.3.5. Asia Pacific
- 5.1. Market Analysis, Insights and Forecast - by Solution Type
- 6. North America APAC 3D Telepresence Market Analysis, Insights and Forecast, 2019-2031
- 6.1. Market Analysis, Insights and Forecast - by Solution Type
- 6.1.1. Software
- 6.1.2. Hardware
- 6.2. Market Analysis, Insights and Forecast - by Application
- 6.2.1. Education
- 6.2.2. Advertising
- 6.2.3. Conferencing
- 6.1. Market Analysis, Insights and Forecast - by Solution Type
- 7. South America APAC 3D Telepresence Market Analysis, Insights and Forecast, 2019-2031
- 7.1. Market Analysis, Insights and Forecast - by Solution Type
- 7.1.1. Software
- 7.1.2. Hardware
- 7.2. Market Analysis, Insights and Forecast - by Application
- 7.2.1. Education
- 7.2.2. Advertising
- 7.2.3. Conferencing
- 7.1. Market Analysis, Insights and Forecast - by Solution Type
- 8. Europe APAC 3D Telepresence Market Analysis, Insights and Forecast, 2019-2031
- 8.1. Market Analysis, Insights and Forecast - by Solution Type
- 8.1.1. Software
- 8.1.2. Hardware
- 8.2. Market Analysis, Insights and Forecast - by Application
- 8.2.1. Education
- 8.2.2. Advertising
- 8.2.3. Conferencing
- 8.1. Market Analysis, Insights and Forecast - by Solution Type
- 9. Middle East & Africa APAC 3D Telepresence Market Analysis, Insights and Forecast, 2019-2031
- 9.1. Market Analysis, Insights and Forecast - by Solution Type
- 9.1.1. Software
- 9.1.2. Hardware
- 9.2. Market Analysis, Insights and Forecast - by Application
- 9.2.1. Education
- 9.2.2. Advertising
- 9.2.3. Conferencing
- 9.1. Market Analysis, Insights and Forecast - by Solution Type
- 10. Asia Pacific APAC 3D Telepresence Market Analysis, Insights and Forecast, 2019-2031
- 10.1. Market Analysis, Insights and Forecast - by Solution Type
- 10.1.1. Software
- 10.1.2. Hardware
- 10.2. Market Analysis, Insights and Forecast - by Application
- 10.2.1. Education
- 10.2.2. Advertising
- 10.2.3. Conferencing
- 10.1. Market Analysis, Insights and Forecast - by Solution Type
- 11. North America APAC 3D Telepresence Market Analysis, Insights and Forecast, 2019-2031
- 11.1. Market Analysis, Insights and Forecast - By Country/Sub-region
- 11.1.1.
- 12. Europe APAC 3D Telepresence Market Analysis, Insights and Forecast, 2019-2031
- 12.1. Market Analysis, Insights and Forecast - By Country/Sub-region
- 12.1.1.
- 13. Asia Pacific APAC 3D Telepresence Market Analysis, Insights and Forecast, 2019-2031
- 13.1. Market Analysis, Insights and Forecast - By Country/Sub-region
- 13.1.1.
- 14. Rest of the World APAC 3D Telepresence Market Analysis, Insights and Forecast, 2019-2031
- 14.1. Market Analysis, Insights and Forecast - By Country/Sub-region
- 14.1.1.
- 15. Competitive Analysis
- 15.1. Global Market Share Analysis 2024
- 15.2. Company Profiles
- 15.2.1 Valorem Reply
- 15.2.1.1. Overview
- 15.2.1.2. Products
- 15.2.1.3. SWOT Analysis
- 15.2.1.4. Recent Developments
- 15.2.1.5. Financials (Based on Availability)
- 15.2.2 Holoxica Limited
- 15.2.2.1. Overview
- 15.2.2.2. Products
- 15.2.2.3. SWOT Analysis
- 15.2.2.4. Recent Developments
- 15.2.2.5. Financials (Based on Availability)
- 15.2.3 Primasonic Spectrum Private Ltd *List Not Exhaustive
- 15.2.3.1. Overview
- 15.2.3.2. Products
- 15.2.3.3. SWOT Analysis
- 15.2.3.4. Recent Developments
- 15.2.3.5. Financials (Based on Availability)
- 15.2.4 Teliris Inc (Dimension Data)
- 15.2.4.1. Overview
- 15.2.4.2. Products
- 15.2.4.3. SWOT Analysis
- 15.2.4.4. Recent Developments
- 15.2.4.5. Financials (Based on Availability)
- 15.2.5 Polycom Inc
- 15.2.5.1. Overview
- 15.2.5.2. Products
- 15.2.5.3. SWOT Analysis
- 15.2.5.4. Recent Developments
- 15.2.5.5. Financials (Based on Availability)
- 15.2.6 Cisco Systems Inc
- 15.2.6.1. Overview
- 15.2.6.2. Products
- 15.2.6.3. SWOT Analysis
- 15.2.6.4. Recent Developments
- 15.2.6.5. Financials (Based on Availability)
- 15.2.7 Microsoft Corporation
- 15.2.7.1. Overview
- 15.2.7.2. Products
- 15.2.7.3. SWOT Analysis
- 15.2.7.4. Recent Developments
- 15.2.7.5. Financials (Based on Availability)
- 15.2.8 MDH Hologram Ltd
- 15.2.8.1. Overview
- 15.2.8.2. Products
- 15.2.8.3. SWOT Analysis
- 15.2.8.4. Recent Developments
- 15.2.8.5. Financials (Based on Availability)
- 15.2.9 ZTE Corporation
- 15.2.9.1. Overview
- 15.2.9.2. Products
- 15.2.9.3. SWOT Analysis
- 15.2.9.4. Recent Developments
- 15.2.9.5. Financials (Based on Availability)
- 15.2.10 Musion 3D
- 15.2.10.1. Overview
- 15.2.10.2. Products
- 15.2.10.3. SWOT Analysis
- 15.2.10.4. Recent Developments
- 15.2.10.5. Financials (Based on Availability)
- 15.2.11 TelePresence Tech
- 15.2.11.1. Overview
- 15.2.11.2. Products
- 15.2.11.3. SWOT Analysis
- 15.2.11.4. Recent Developments
- 15.2.11.5. Financials (Based on Availability)
- 15.2.12 Digital Video Enterprises Inc
- 15.2.12.1. Overview
- 15.2.12.2. Products
- 15.2.12.3. SWOT Analysis
- 15.2.12.4. Recent Developments
- 15.2.12.5. Financials (Based on Availability)
- 15.2.1 Valorem Reply
List of Figures
- Figure 1: Global APAC 3D Telepresence Market Revenue Breakdown (Million, %) by Region 2024 & 2032
- Figure 2: North America APAC 3D Telepresence Market Revenue (Million), by Country 2024 & 2032
- Figure 3: North America APAC 3D Telepresence Market Revenue Share (%), by Country 2024 & 2032
- Figure 4: Europe APAC 3D Telepresence Market Revenue (Million), by Country 2024 & 2032
- Figure 5: Europe APAC 3D Telepresence Market Revenue Share (%), by Country 2024 & 2032
- Figure 6: Asia Pacific APAC 3D Telepresence Market Revenue (Million), by Country 2024 & 2032
- Figure 7: Asia Pacific APAC 3D Telepresence Market Revenue Share (%), by Country 2024 & 2032
- Figure 8: Rest of the World APAC 3D Telepresence Market Revenue (Million), by Country 2024 & 2032
- Figure 9: Rest of the World APAC 3D Telepresence Market Revenue Share (%), by Country 2024 & 2032
- Figure 10: North America APAC 3D Telepresence Market Revenue (Million), by Solution Type 2024 & 2032
- Figure 11: North America APAC 3D Telepresence Market Revenue Share (%), by Solution Type 2024 & 2032
- Figure 12: North America APAC 3D Telepresence Market Revenue (Million), by Application 2024 & 2032
- Figure 13: North America APAC 3D Telepresence Market Revenue Share (%), by Application 2024 & 2032
- Figure 14: North America APAC 3D Telepresence Market Revenue (Million), by Country 2024 & 2032
- Figure 15: North America APAC 3D Telepresence Market Revenue Share (%), by Country 2024 & 2032
- Figure 16: South America APAC 3D Telepresence Market Revenue (Million), by Solution Type 2024 & 2032
- Figure 17: South America APAC 3D Telepresence Market Revenue Share (%), by Solution Type 2024 & 2032
- Figure 18: South America APAC 3D Telepresence Market Revenue (Million), by Application 2024 & 2032
- Figure 19: South America APAC 3D Telepresence Market Revenue Share (%), by Application 2024 & 2032
- Figure 20: South America APAC 3D Telepresence Market Revenue (Million), by Country 2024 & 2032
- Figure 21: South America APAC 3D Telepresence Market Revenue Share (%), by Country 2024 & 2032
- Figure 22: Europe APAC 3D Telepresence Market Revenue (Million), by Solution Type 2024 & 2032
- Figure 23: Europe APAC 3D Telepresence Market Revenue Share (%), by Solution Type 2024 & 2032
- Figure 24: Europe APAC 3D Telepresence Market Revenue (Million), by Application 2024 & 2032
- Figure 25: Europe APAC 3D Telepresence Market Revenue Share (%), by Application 2024 & 2032
- Figure 26: Europe APAC 3D Telepresence Market Revenue (Million), by Country 2024 & 2032
- Figure 27: Europe APAC 3D Telepresence Market Revenue Share (%), by Country 2024 & 2032
- Figure 28: Middle East & Africa APAC 3D Telepresence Market Revenue (Million), by Solution Type 2024 & 2032
- Figure 29: Middle East & Africa APAC 3D Telepresence Market Revenue Share (%), by Solution Type 2024 & 2032
- Figure 30: Middle East & Africa APAC 3D Telepresence Market Revenue (Million), by Application 2024 & 2032
- Figure 31: Middle East & Africa APAC 3D Telepresence Market Revenue Share (%), by Application 2024 & 2032
- Figure 32: Middle East & Africa APAC 3D Telepresence Market Revenue (Million), by Country 2024 & 2032
- Figure 33: Middle East & Africa APAC 3D Telepresence Market Revenue Share (%), by Country 2024 & 2032
- Figure 34: Asia Pacific APAC 3D Telepresence Market Revenue (Million), by Solution Type 2024 & 2032
- Figure 35: Asia Pacific APAC 3D Telepresence Market Revenue Share (%), by Solution Type 2024 & 2032
- Figure 36: Asia Pacific APAC 3D Telepresence Market Revenue (Million), by Application 2024 & 2032
- Figure 37: Asia Pacific APAC 3D Telepresence Market Revenue Share (%), by Application 2024 & 2032
- Figure 38: Asia Pacific APAC 3D Telepresence Market Revenue (Million), by Country 2024 & 2032
- Figure 39: Asia Pacific APAC 3D Telepresence Market Revenue Share (%), by Country 2024 & 2032
List of Tables
- Table 1: Global APAC 3D Telepresence Market Revenue Million Forecast, by Region 2019 & 2032
- Table 2: Global APAC 3D Telepresence Market Revenue Million Forecast, by Solution Type 2019 & 2032
- Table 3: Global APAC 3D Telepresence Market Revenue Million Forecast, by Application 2019 & 2032
- Table 4: Global APAC 3D Telepresence Market Revenue Million Forecast, by Region 2019 & 2032
- Table 5: Global APAC 3D Telepresence Market Revenue Million Forecast, by Country 2019 & 2032
- Table 6: APAC 3D Telepresence Market Revenue (Million) Forecast, by Application 2019 & 2032
- Table 7: Global APAC 3D Telepresence Market Revenue Million Forecast, by Country 2019 & 2032
- Table 8: APAC 3D Telepresence Market Revenue (Million) Forecast, by Application 2019 & 2032
- Table 9: Global APAC 3D Telepresence Market Revenue Million Forecast, by Country 2019 & 2032
- Table 10: APAC 3D Telepresence Market Revenue (Million) Forecast, by Application 2019 & 2032
- Table 11: Global APAC 3D Telepresence Market Revenue Million Forecast, by Country 2019 & 2032
- Table 12: APAC 3D Telepresence Market Revenue (Million) Forecast, by Application 2019 & 2032
- Table 13: Global APAC 3D Telepresence Market Revenue Million Forecast, by Solution Type 2019 & 2032
- Table 14: Global APAC 3D Telepresence Market Revenue Million Forecast, by Application 2019 & 2032
- Table 15: Global APAC 3D Telepresence Market Revenue Million Forecast, by Country 2019 & 2032
- Table 16: United States APAC 3D Telepresence Market Revenue (Million) Forecast, by Application 2019 & 2032
- Table 17: Canada APAC 3D Telepresence Market Revenue (Million) Forecast, by Application 2019 & 2032
- Table 18: Mexico APAC 3D Telepresence Market Revenue (Million) Forecast, by Application 2019 & 2032
- Table 19: Global APAC 3D Telepresence Market Revenue Million Forecast, by Solution Type 2019 & 2032
- Table 20: Global APAC 3D Telepresence Market Revenue Million Forecast, by Application 2019 & 2032
- Table 21: Global APAC 3D Telepresence Market Revenue Million Forecast, by Country 2019 & 2032
- Table 22: Brazil APAC 3D Telepresence Market Revenue (Million) Forecast, by Application 2019 & 2032
- Table 23: Argentina APAC 3D Telepresence Market Revenue (Million) Forecast, by Application 2019 & 2032
- Table 24: Rest of South America APAC 3D Telepresence Market Revenue (Million) Forecast, by Application 2019 & 2032
- Table 25: Global APAC 3D Telepresence Market Revenue Million Forecast, by Solution Type 2019 & 2032
- Table 26: Global APAC 3D Telepresence Market Revenue Million Forecast, by Application 2019 & 2032
- Table 27: Global APAC 3D Telepresence Market Revenue Million Forecast, by Country 2019 & 2032
- Table 28: United Kingdom APAC 3D Telepresence Market Revenue (Million) Forecast, by Application 2019 & 2032
- Table 29: Germany APAC 3D Telepresence Market Revenue (Million) Forecast, by Application 2019 & 2032
- Table 30: France APAC 3D Telepresence Market Revenue (Million) Forecast, by Application 2019 & 2032
- Table 31: Italy APAC 3D Telepresence Market Revenue (Million) Forecast, by Application 2019 & 2032
- Table 32: Spain APAC 3D Telepresence Market Revenue (Million) Forecast, by Application 2019 & 2032
- Table 33: Russia APAC 3D Telepresence Market Revenue (Million) Forecast, by Application 2019 & 2032
- Table 34: Benelux APAC 3D Telepresence Market Revenue (Million) Forecast, by Application 2019 & 2032
- Table 35: Nordics APAC 3D Telepresence Market Revenue (Million) Forecast, by Application 2019 & 2032
- Table 36: Rest of Europe APAC 3D Telepresence Market Revenue (Million) Forecast, by Application 2019 & 2032
- Table 37: Global APAC 3D Telepresence Market Revenue Million Forecast, by Solution Type 2019 & 2032
- Table 38: Global APAC 3D Telepresence Market Revenue Million Forecast, by Application 2019 & 2032
- Table 39: Global APAC 3D Telepresence Market Revenue Million Forecast, by Country 2019 & 2032
- Table 40: Turkey APAC 3D Telepresence Market Revenue (Million) Forecast, by Application 2019 & 2032
- Table 41: Israel APAC 3D Telepresence Market Revenue (Million) Forecast, by Application 2019 & 2032
- Table 42: GCC APAC 3D Telepresence Market Revenue (Million) Forecast, by Application 2019 & 2032
- Table 43: North Africa APAC 3D Telepresence Market Revenue (Million) Forecast, by Application 2019 & 2032
- Table 44: South Africa APAC 3D Telepresence Market Revenue (Million) Forecast, by Application 2019 & 2032
- Table 45: Rest of Middle East & Africa APAC 3D Telepresence Market Revenue (Million) Forecast, by Application 2019 & 2032
- Table 46: Global APAC 3D Telepresence Market Revenue Million Forecast, by Solution Type 2019 & 2032
- Table 47: Global APAC 3D Telepresence Market Revenue Million Forecast, by Application 2019 & 2032
- Table 48: Global APAC 3D Telepresence Market Revenue Million Forecast, by Country 2019 & 2032
- Table 49: China APAC 3D Telepresence Market Revenue (Million) Forecast, by Application 2019 & 2032
- Table 50: India APAC 3D Telepresence Market Revenue (Million) Forecast, by Application 2019 & 2032
- Table 51: Japan APAC 3D Telepresence Market Revenue (Million) Forecast, by Application 2019 & 2032
- Table 52: South Korea APAC 3D Telepresence Market Revenue (Million) Forecast, by Application 2019 & 2032
- Table 53: ASEAN APAC 3D Telepresence Market Revenue (Million) Forecast, by Application 2019 & 2032
- Table 54: Oceania APAC 3D Telepresence Market Revenue (Million) Forecast, by Application 2019 & 2032
- Table 55: Rest of Asia Pacific APAC 3D Telepresence Market Revenue (Million) Forecast, by Application 2019 & 2032
Frequently Asked Questions
1. What is the projected Compound Annual Growth Rate (CAGR) of the APAC 3D Telepresence Market?
The projected CAGR is approximately 18.82%.
2. Which companies are prominent players in the APAC 3D Telepresence Market?
Key companies in the market include Valorem Reply, Holoxica Limited, Primasonic Spectrum Private Ltd *List Not Exhaustive, Teliris Inc (Dimension Data), Polycom Inc, Cisco Systems Inc, Microsoft Corporation, MDH Hologram Ltd, ZTE Corporation, Musion 3D, TelePresence Tech, Digital Video Enterprises Inc.
3. What are the main segments of the APAC 3D Telepresence Market?
The market segments include Solution Type, Application.
4. Can you provide details about the market size?
The market size is estimated to be USD 1.00 Million as of 2022.
5. What are some drivers contributing to market growth?
Enhanced User Experience; Increasing Demand For Time-Saving Technologies In Organizations.
6. What are the notable trends driving market growth?
Conferencing Application Segment is Expected to Hold Significant Market Share.
7. Are there any restraints impacting market growth?
High Costs And Limited Commercialization.
8. Can you provide examples of recent developments in the market?
June 2023: The inaugural edition of Pro Integration Future Asia 2023 (PIFA2023), a professional audiovisual and entertainment lighting (AVL) technologies exhibition and conference for the region, runs until 28 June 2023 at the Marina Bay Sands Expo & Convention Centre in Singapore. Launched by Montgomery Events Asia, together with its strategic partner, the Professional Audio Visual & Lighting Integration Association of Singapore (AVLIAS), the three-day in-person event is drawing trade professionals and experts interested in unified communications and collaboration, digital signage, and out-of-home media; production and immersive technologies; parks and attractions; smart homes and buildings; and stage and mega-events.
9. What pricing options are available for accessing the report?
Pricing options include single-user, multi-user, and enterprise licenses priced at USD 4750, USD 5250, and USD 8750 respectively.
10. Is the market size provided in terms of value or volume?
The market size is provided in terms of value, measured in Million.
11. Are there any specific market keywords associated with the report?
Yes, the market keyword associated with the report is "APAC 3D Telepresence Market," which aids in identifying and referencing the specific market segment covered.
12. How do I determine which pricing option suits my needs best?
The pricing options vary based on user requirements and access needs. Individual users may opt for single-user licenses, while businesses requiring broader access may choose multi-user or enterprise licenses for cost-effective access to the report.
13. Are there any additional resources or data provided in the APAC 3D Telepresence Market report?
While the report offers comprehensive insights, it's advisable to review the specific contents or supplementary materials provided to ascertain if additional resources or data are available.
14. How can I stay updated on further developments or reports in the APAC 3D Telepresence Market?
To stay informed about further developments, trends, and reports in the APAC 3D Telepresence Market, consider subscribing to industry newsletters, following relevant companies and organizations, or regularly checking reputable industry news sources and publications.
Methodology
Step 1 - Identification of Relevant Samples Size from Population Database


Step 2 - Approaches for Defining Global Market Size (Value, Volume* & Price*)

Note*: In applicable scenarios
Step 3 - Data Sources
Primary Research
- Web Analytics
- Survey Reports
- Research Institute
- Latest Research Reports
- Opinion Leaders
Secondary Research
- Annual Reports
- White Paper
- Latest Press Release
- Industry Association
- Paid Database
- Investor Presentations

Step 4 - Data Triangulation
Involves using different sources of information in order to increase the validity of a study
These sources are likely to be stakeholders in a program - participants, other researchers, program staff, other community members, and so on.
Then we put all data in single framework & apply various statistical tools to find out the dynamic on the market.
During the analysis stage, feedback from the stakeholder groups would be compared to determine areas of agreement as well as areas of divergence


