
Key Insights
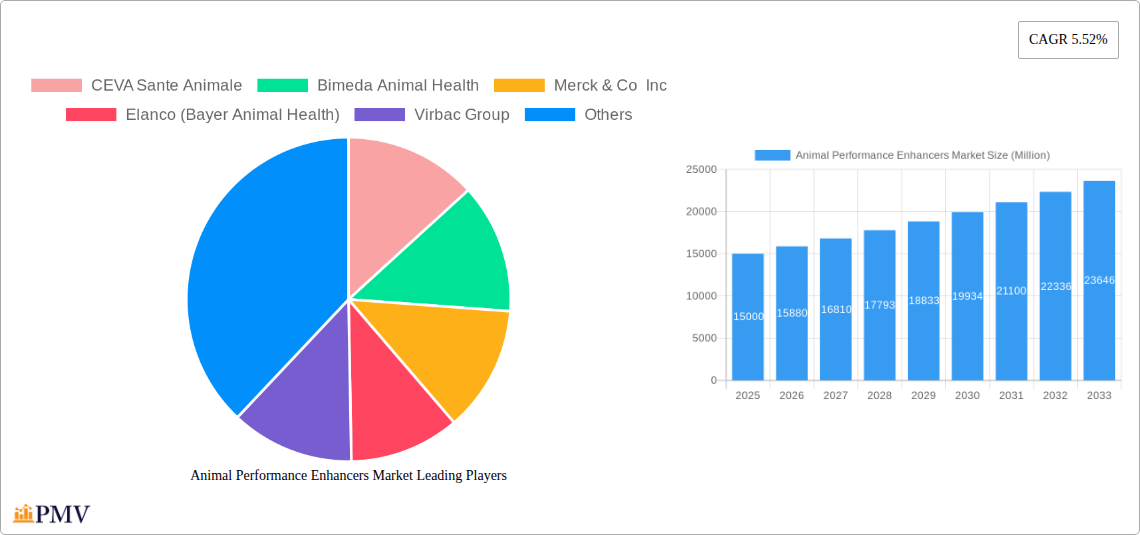
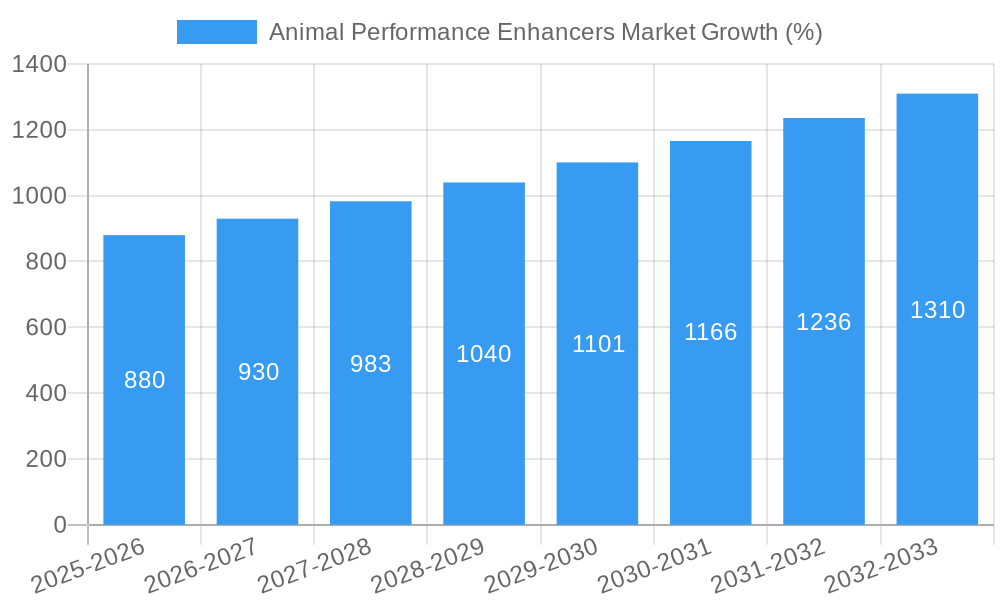
The global animal performance enhancers market is experiencing robust growth, driven by increasing demand for livestock products and a rising pet population worldwide. The market's Compound Annual Growth Rate (CAGR) of 5.52% from 2019-2024 indicates a significant upward trajectory. This growth is fueled by several factors. Firstly, the increasing adoption of intensive farming practices necessitates the use of performance enhancers to maximize yield and profitability for livestock producers. Secondly, the growing awareness of animal health and productivity among farmers is leading to increased investment in advanced feed additives and veterinary pharmaceuticals. Thirdly, the rising pet ownership globally is creating a substantial demand for performance enhancers aimed at improving companion animal health, vitality, and longevity. Growth is particularly strong in the Asia-Pacific region, driven by expanding livestock industries and increasing disposable incomes. Segment-wise, the companion animal segment is witnessing significant growth due to rising pet humanization trends, leading to increased spending on premium pet care products.
However, the market also faces certain restraints. Stringent regulatory frameworks governing the use of performance enhancers in different regions pose a challenge for market expansion. Concerns regarding the potential long-term effects of certain enhancers on animal health and the environment are also influencing consumer choices and regulatory policies. Furthermore, price fluctuations in raw materials and the increasing cost of research and development can impact the market's profitability. Despite these challenges, the overall outlook remains positive, with opportunities for innovation in sustainable and environmentally friendly performance enhancers. The market is expected to continue its expansion throughout the forecast period (2025-2033), with further growth driven by technological advancements in feed additives and the development of novel therapeutic solutions. The competitive landscape is characterized by several major players, including CEVA Sante Animale, Boehringer Ingelheim, and Zoetis, who are constantly striving to innovate and expand their product portfolios.
Animal Performance Enhancers Market: A Comprehensive Report (2019-2033)
This in-depth report provides a comprehensive analysis of the Animal Performance Enhancers market, offering valuable insights for industry stakeholders, investors, and researchers. The study period covers 2019-2033, with a base year of 2025 and a forecast period of 2025-2033. The historical period analyzed is 2019-2024. The market is segmented by application (Growth Promotors, Performance Enhancers, Other Applications) and by animal type (Companion Animals, Livestock). The report projects a market size of xx Million by 2033, with a CAGR of xx% during the forecast period.
Animal Performance Enhancers Market Market Structure & Competitive Dynamics
The Animal Performance Enhancers market is characterized by a moderately concentrated structure, with several key players holding significant market share. The top players include CEVA Sante Animale, Bimeda Animal Health, Merck & Co Inc, Elanco (Bayer Animal Health), Virbac Group, Soparfin SCA (Vetiquinol), Jurox Pty Ltd, Syntex SA, HIPRA Animal Health, Boehringer Ingelheim, Huvepharma, and Zoetis Inc. Market share dynamics are influenced by factors such as R&D investments, product innovation, and strategic acquisitions.
The market exhibits a dynamic innovation ecosystem with ongoing developments in areas like novel drug delivery systems and precision livestock farming technologies. Regulatory frameworks vary across different geographies, impacting product approvals and market access. The presence of substitute products, such as traditional feed supplements, poses competitive pressure. End-user trends, particularly towards sustainable and ethically sourced animal products, are shaping demand. Significant M&A activity has been observed in recent years, with deals like the Merck Animal Health acquisition of Vence (September 2022) impacting market consolidation and competitive landscapes. The total value of M&A deals in the past 5 years is estimated to be xx Million.
Animal Performance Enhancers Market Industry Trends & Insights
The Animal Performance Enhancers market is experiencing robust growth, driven by several key factors. Increasing demand for animal protein globally, coupled with the need for efficient and sustainable livestock production, is a primary driver. Technological advancements, particularly in areas like precision animal nutrition and data-driven farming practices, are improving productivity and driving market penetration. Consumer preferences are shifting towards healthier and ethically produced animal products, influencing the demand for performance enhancers that align with these values. The growing adoption of sustainable farming practices and the increasing focus on animal welfare are also contributing to market expansion. Competitive dynamics, driven by innovation and strategic partnerships, are shaping the landscape. The market is expected to witness a CAGR of xx% during the forecast period, with growth prominent in regions with expanding livestock populations and rising per capita meat consumption. Market penetration of advanced performance enhancers is gradually increasing, especially in developed economies.
Dominant Markets & Segments in Animal Performance Enhancers Market
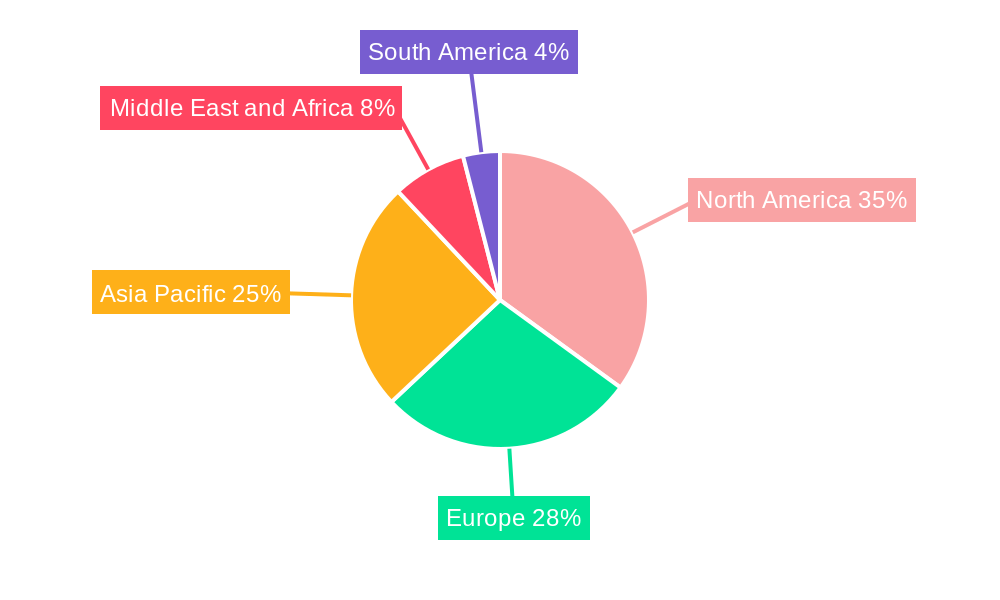
Leading Region: North America currently holds a dominant position in the Animal Performance Enhancers market, driven by factors such as advanced agricultural practices, high animal protein consumption, and strong regulatory frameworks. Europe follows closely, with a substantial market share, while Asia-Pacific is experiencing rapid growth, fueled by expanding livestock populations and increasing demand for animal products.
Leading Segment (By Application): The Growth Promotors segment currently holds the largest market share, due to the widespread adoption of these products to enhance animal growth and productivity. Performance Enhancers are also experiencing significant growth, driven by the increasing focus on maximizing animal performance in various sectors.
Leading Segment (By Animal): The Livestock segment dominates the market, driven by the large-scale application of performance enhancers in commercial animal farming. The Companion Animals segment shows steady growth, driven by rising pet ownership and increased consumer spending on pet health.
Key Drivers in Dominant Regions/Segments:
- North America: Strong regulatory frameworks, advanced agricultural infrastructure, and high animal protein consumption.
- Europe: Stringent animal welfare regulations, increasing adoption of sustainable farming practices, and high consumer awareness.
- Asia-Pacific: Rapidly expanding livestock populations, rising disposable incomes, and increasing demand for animal products.
- Growth Promotors Segment: Widely accepted use, cost-effectiveness, and proven results in improving animal growth rates.
- Livestock Segment: High volume of production, commercial scale applications, and significant economic impact.
Animal Performance Enhancers Market Product Innovations
Recent product innovations focus on enhancing efficacy, improving safety profiles, and minimizing environmental impact. This includes the development of novel drug delivery systems, advanced formulations targeting specific animal needs, and the integration of data analytics for precise product application. Technological advancements, such as precision livestock farming technologies and AI-driven feeding strategies, are facilitating the development of tailored products that address specific animal performance needs. These innovations align with market demands for sustainable, ethical, and high-performing animal production systems.
Report Segmentation & Scope
By Application:
Growth Promotors: This segment encompasses products designed to enhance animal growth rates and overall productivity. The market is expected to experience significant growth during the forecast period, driven by the increasing demand for efficient animal production. Competitive dynamics are intense, with several major players vying for market share through product innovation and strategic partnerships.
Performance Enhancers: This segment includes products that optimize specific aspects of animal performance, such as milk production, meat quality, and reproductive efficiency. Growth in this segment is fueled by the increasing focus on maximizing animal output and profitability. The competitive landscape is characterized by a mix of large multinational companies and specialized niche players.
Other Applications: This category includes products with diverse applications in animal health management. The segment is expected to witness moderate growth, driven by rising awareness about animal well-being and preventative healthcare. Competitive dynamics are influenced by the regulatory landscape and the specific applications served.
By Animals:
Companion Animals: This segment includes products designed to enhance the health and well-being of companion animals, such as dogs and cats. Growth in this segment is driven by rising pet ownership and increasing consumer spending on pet healthcare. The market is relatively fragmented, with several specialized companies catering to the specific needs of companion animals.
Livestock: This segment covers products used in the commercial production of livestock, including cattle, poultry, swine, and aquaculture. The livestock segment dominates the market, driven by the large-scale application of performance enhancers in commercial animal farming. Competitive dynamics are intense, with major players investing heavily in R&D and strategic partnerships.
Key Drivers of Animal Performance Enhancers Market Growth
Several key factors drive the growth of the Animal Performance Enhancers market. The rising global demand for animal protein fuels the need for efficient and productive animal production systems. Technological advancements in areas like precision livestock farming and data analytics enhance product efficacy and target specific animal needs. Favorable regulatory frameworks and government support for agricultural modernization in several countries create a positive environment for market expansion. The increasing adoption of sustainable farming practices contributes to environmentally responsible animal production.
Challenges in the Animal Performance Enhancers Market Sector
The Animal Performance Enhancers market faces several challenges. Stringent regulatory requirements for product approvals and safety pose hurdles for market entry and expansion. Fluctuations in raw material costs and supply chain disruptions can impact production and profitability. Growing concerns about the potential environmental impact of certain performance enhancers create pressure for sustainable solutions. Intense competition from existing players and the entry of new companies contribute to pricing pressure. The total estimated impact of these challenges on market growth is projected to be a reduction of xx Million by 2033.
Leading Players in the Animal Performance Enhancers Market Market
- CEVA Sante Animale
- Bimeda Animal Health
- Merck & Co Inc
- Elanco (Bayer Animal Health)
- Virbac Group
- Soparfin SCA (Vetiquinol)
- Jurox Pty Ltd
- Syntex SA
- HIPRA Animal Health
- Boehringer Ingelheim
- Huvepharma
- Zoetis Inc
Key Developments in Animal Performance Enhancers Market Sector
- September 2022: Merck Animal Health (MSD Animal Health) acquired Vence, significantly impacting market consolidation.
- March 2022: A project launched in Tamil Nadu, India, focused on improving the reproductive efficiency of Kangayam cows, highlighting the focus on enhancing livestock performance.
- July 2021: ADM launched a customized antibiotic reduction program, reflecting the growing industry focus on sustainable and responsible animal production practices.
Strategic Animal Performance Enhancers Market Market Outlook
The Animal Performance Enhancers market presents significant growth opportunities in the coming years. Continued innovation in product development, expanding livestock production globally, and the increasing focus on sustainable and ethical animal farming practices will fuel market expansion. Strategic partnerships, acquisitions, and investments in R&D will play a crucial role in shaping the competitive landscape. The market is poised for substantial growth, with opportunities for companies that can offer innovative, sustainable, and high-performing products.
Animal Performance Enhancers Market Segmentation
-
1. Application
- 1.1. Growth Promotors
- 1.2. Performance Enhancers
- 1.3. Other Applications
-
2. Animals
- 2.1. Companion Animals
- 2.2. Livestock
Animal Performance Enhancers Market Segmentation By Geography
-
1. North America
- 1.1. United States
- 1.2. Canada
- 1.3. Mexico
-
2. Europe
- 2.1. Germany
- 2.2. United Kingdom
- 2.3. France
- 2.4. Italy
- 2.5. Spain
- 2.6. Rest of Europe
-
3. Asia Pacific
- 3.1. China
- 3.2. Japan
- 3.3. India
- 3.4. Australia
- 3.5. South Korea
- 3.6. Rest of Asia Pacific
-
4. Middle East and Africa
- 4.1. GCC
- 4.2. South Africa
- 4.3. Rest of Middle East and Africa
-
5. South America
- 5.1. Brazil
- 5.2. Argentina
- 5.3. Rest of South America
Animal Performance Enhancers Market REPORT HIGHLIGHTS
| Aspects | Details |
|---|---|
| Study Period | 2019-2033 |
| Base Year | 2024 |
| Estimated Year | 2025 |
| Forecast Period | 2025-2033 |
| Historical Period | 2019-2024 |
| Growth Rate | CAGR of 5.52% from 2019-2033 |
| Segmentation |
|
Table of Contents
- 1. Introduction
- 1.1. Research Scope
- 1.2. Market Segmentation
- 1.3. Research Methodology
- 1.4. Definitions and Assumptions
- 2. Executive Summary
- 2.1. Introduction
- 3. Market Dynamics
- 3.1. Introduction
- 3.2. Market Drivers
- 3.2.1. Growing Burden of Hormonal Deficiency Diseases in Animals; Rising Demand For Meat; Increase in Animal Husbandry
- 3.3. Market Restrains
- 3.3.1. Side Effects Associated With Use of Animal Hormones; Stringent Government Regulations Associated With Animal Hormones
- 3.4. Market Trends
- 3.4.1. Livestock Animal Segment is Expected to Witness Growth Over the Forecast Period
- 4. Market Factor Analysis
- 4.1. Porters Five Forces
- 4.2. Supply/Value Chain
- 4.3. PESTEL analysis
- 4.4. Market Entropy
- 4.5. Patent/Trademark Analysis
- 5. Global Animal Performance Enhancers Market Analysis, Insights and Forecast, 2019-2031
- 5.1. Market Analysis, Insights and Forecast - by Application
- 5.1.1. Growth Promotors
- 5.1.2. Performance Enhancers
- 5.1.3. Other Applications
- 5.2. Market Analysis, Insights and Forecast - by Animals
- 5.2.1. Companion Animals
- 5.2.2. Livestock
- 5.3. Market Analysis, Insights and Forecast - by Region
- 5.3.1. North America
- 5.3.2. Europe
- 5.3.3. Asia Pacific
- 5.3.4. Middle East and Africa
- 5.3.5. South America
- 5.1. Market Analysis, Insights and Forecast - by Application
- 6. North America Animal Performance Enhancers Market Analysis, Insights and Forecast, 2019-2031
- 6.1. Market Analysis, Insights and Forecast - by Application
- 6.1.1. Growth Promotors
- 6.1.2. Performance Enhancers
- 6.1.3. Other Applications
- 6.2. Market Analysis, Insights and Forecast - by Animals
- 6.2.1. Companion Animals
- 6.2.2. Livestock
- 6.1. Market Analysis, Insights and Forecast - by Application
- 7. Europe Animal Performance Enhancers Market Analysis, Insights and Forecast, 2019-2031
- 7.1. Market Analysis, Insights and Forecast - by Application
- 7.1.1. Growth Promotors
- 7.1.2. Performance Enhancers
- 7.1.3. Other Applications
- 7.2. Market Analysis, Insights and Forecast - by Animals
- 7.2.1. Companion Animals
- 7.2.2. Livestock
- 7.1. Market Analysis, Insights and Forecast - by Application
- 8. Asia Pacific Animal Performance Enhancers Market Analysis, Insights and Forecast, 2019-2031
- 8.1. Market Analysis, Insights and Forecast - by Application
- 8.1.1. Growth Promotors
- 8.1.2. Performance Enhancers
- 8.1.3. Other Applications
- 8.2. Market Analysis, Insights and Forecast - by Animals
- 8.2.1. Companion Animals
- 8.2.2. Livestock
- 8.1. Market Analysis, Insights and Forecast - by Application
- 9. Middle East and Africa Animal Performance Enhancers Market Analysis, Insights and Forecast, 2019-2031
- 9.1. Market Analysis, Insights and Forecast - by Application
- 9.1.1. Growth Promotors
- 9.1.2. Performance Enhancers
- 9.1.3. Other Applications
- 9.2. Market Analysis, Insights and Forecast - by Animals
- 9.2.1. Companion Animals
- 9.2.2. Livestock
- 9.1. Market Analysis, Insights and Forecast - by Application
- 10. South America Animal Performance Enhancers Market Analysis, Insights and Forecast, 2019-2031
- 10.1. Market Analysis, Insights and Forecast - by Application
- 10.1.1. Growth Promotors
- 10.1.2. Performance Enhancers
- 10.1.3. Other Applications
- 10.2. Market Analysis, Insights and Forecast - by Animals
- 10.2.1. Companion Animals
- 10.2.2. Livestock
- 10.1. Market Analysis, Insights and Forecast - by Application
- 11. North America Animal Performance Enhancers Market Analysis, Insights and Forecast, 2019-2031
- 11.1. Market Analysis, Insights and Forecast - By Country/Sub-region
- 11.1.1 United States
- 11.1.2 Canada
- 11.1.3 Mexico
- 12. Europe Animal Performance Enhancers Market Analysis, Insights and Forecast, 2019-2031
- 12.1. Market Analysis, Insights and Forecast - By Country/Sub-region
- 12.1.1 Germany
- 12.1.2 United Kingdom
- 12.1.3 France
- 12.1.4 Italy
- 12.1.5 Spain
- 12.1.6 Rest of Europe
- 13. Asia Pacific Animal Performance Enhancers Market Analysis, Insights and Forecast, 2019-2031
- 13.1. Market Analysis, Insights and Forecast - By Country/Sub-region
- 13.1.1 China
- 13.1.2 Japan
- 13.1.3 India
- 13.1.4 Australia
- 13.1.5 South Korea
- 13.1.6 Rest of Asia Pacific
- 14. Middle East and Africa Animal Performance Enhancers Market Analysis, Insights and Forecast, 2019-2031
- 14.1. Market Analysis, Insights and Forecast - By Country/Sub-region
- 14.1.1 GCC
- 14.1.2 South Africa
- 14.1.3 Rest of Middle East and Africa
- 15. South America Animal Performance Enhancers Market Analysis, Insights and Forecast, 2019-2031
- 15.1. Market Analysis, Insights and Forecast - By Country/Sub-region
- 15.1.1 Brazil
- 15.1.2 Argentina
- 15.1.3 Rest of South America
- 16. Competitive Analysis
- 16.1. Global Market Share Analysis 2024
- 16.2. Company Profiles
- 16.2.1 CEVA Sante Animale
- 16.2.1.1. Overview
- 16.2.1.2. Products
- 16.2.1.3. SWOT Analysis
- 16.2.1.4. Recent Developments
- 16.2.1.5. Financials (Based on Availability)
- 16.2.2 Bimeda Animal Health
- 16.2.2.1. Overview
- 16.2.2.2. Products
- 16.2.2.3. SWOT Analysis
- 16.2.2.4. Recent Developments
- 16.2.2.5. Financials (Based on Availability)
- 16.2.3 Merck & Co Inc
- 16.2.3.1. Overview
- 16.2.3.2. Products
- 16.2.3.3. SWOT Analysis
- 16.2.3.4. Recent Developments
- 16.2.3.5. Financials (Based on Availability)
- 16.2.4 Elanco (Bayer Animal Health)
- 16.2.4.1. Overview
- 16.2.4.2. Products
- 16.2.4.3. SWOT Analysis
- 16.2.4.4. Recent Developments
- 16.2.4.5. Financials (Based on Availability)
- 16.2.5 Virbac Group
- 16.2.5.1. Overview
- 16.2.5.2. Products
- 16.2.5.3. SWOT Analysis
- 16.2.5.4. Recent Developments
- 16.2.5.5. Financials (Based on Availability)
- 16.2.6 Soparfin SCA (Vetiquinol)
- 16.2.6.1. Overview
- 16.2.6.2. Products
- 16.2.6.3. SWOT Analysis
- 16.2.6.4. Recent Developments
- 16.2.6.5. Financials (Based on Availability)
- 16.2.7 Jurox Pty Ltd
- 16.2.7.1. Overview
- 16.2.7.2. Products
- 16.2.7.3. SWOT Analysis
- 16.2.7.4. Recent Developments
- 16.2.7.5. Financials (Based on Availability)
- 16.2.8 Syntex SA
- 16.2.8.1. Overview
- 16.2.8.2. Products
- 16.2.8.3. SWOT Analysis
- 16.2.8.4. Recent Developments
- 16.2.8.5. Financials (Based on Availability)
- 16.2.9 HIPRA Animal Health
- 16.2.9.1. Overview
- 16.2.9.2. Products
- 16.2.9.3. SWOT Analysis
- 16.2.9.4. Recent Developments
- 16.2.9.5. Financials (Based on Availability)
- 16.2.10 Boehringer Ingelheim
- 16.2.10.1. Overview
- 16.2.10.2. Products
- 16.2.10.3. SWOT Analysis
- 16.2.10.4. Recent Developments
- 16.2.10.5. Financials (Based on Availability)
- 16.2.11 Huvepharma
- 16.2.11.1. Overview
- 16.2.11.2. Products
- 16.2.11.3. SWOT Analysis
- 16.2.11.4. Recent Developments
- 16.2.11.5. Financials (Based on Availability)
- 16.2.12 Zoetis Inc
- 16.2.12.1. Overview
- 16.2.12.2. Products
- 16.2.12.3. SWOT Analysis
- 16.2.12.4. Recent Developments
- 16.2.12.5. Financials (Based on Availability)
- 16.2.1 CEVA Sante Animale
List of Figures
- Figure 1: Global Animal Performance Enhancers Market Revenue Breakdown (Million, %) by Region 2024 & 2032
- Figure 2: Global Animal Performance Enhancers Market Volume Breakdown (K Unit, %) by Region 2024 & 2032
- Figure 3: North America Animal Performance Enhancers Market Revenue (Million), by Country 2024 & 2032
- Figure 4: North America Animal Performance Enhancers Market Volume (K Unit), by Country 2024 & 2032
- Figure 5: North America Animal Performance Enhancers Market Revenue Share (%), by Country 2024 & 2032
- Figure 6: North America Animal Performance Enhancers Market Volume Share (%), by Country 2024 & 2032
- Figure 7: Europe Animal Performance Enhancers Market Revenue (Million), by Country 2024 & 2032
- Figure 8: Europe Animal Performance Enhancers Market Volume (K Unit), by Country 2024 & 2032
- Figure 9: Europe Animal Performance Enhancers Market Revenue Share (%), by Country 2024 & 2032
- Figure 10: Europe Animal Performance Enhancers Market Volume Share (%), by Country 2024 & 2032
- Figure 11: Asia Pacific Animal Performance Enhancers Market Revenue (Million), by Country 2024 & 2032
- Figure 12: Asia Pacific Animal Performance Enhancers Market Volume (K Unit), by Country 2024 & 2032
- Figure 13: Asia Pacific Animal Performance Enhancers Market Revenue Share (%), by Country 2024 & 2032
- Figure 14: Asia Pacific Animal Performance Enhancers Market Volume Share (%), by Country 2024 & 2032
- Figure 15: Middle East and Africa Animal Performance Enhancers Market Revenue (Million), by Country 2024 & 2032
- Figure 16: Middle East and Africa Animal Performance Enhancers Market Volume (K Unit), by Country 2024 & 2032
- Figure 17: Middle East and Africa Animal Performance Enhancers Market Revenue Share (%), by Country 2024 & 2032
- Figure 18: Middle East and Africa Animal Performance Enhancers Market Volume Share (%), by Country 2024 & 2032
- Figure 19: South America Animal Performance Enhancers Market Revenue (Million), by Country 2024 & 2032
- Figure 20: South America Animal Performance Enhancers Market Volume (K Unit), by Country 2024 & 2032
- Figure 21: South America Animal Performance Enhancers Market Revenue Share (%), by Country 2024 & 2032
- Figure 22: South America Animal Performance Enhancers Market Volume Share (%), by Country 2024 & 2032
- Figure 23: North America Animal Performance Enhancers Market Revenue (Million), by Application 2024 & 2032
- Figure 24: North America Animal Performance Enhancers Market Volume (K Unit), by Application 2024 & 2032
- Figure 25: North America Animal Performance Enhancers Market Revenue Share (%), by Application 2024 & 2032
- Figure 26: North America Animal Performance Enhancers Market Volume Share (%), by Application 2024 & 2032
- Figure 27: North America Animal Performance Enhancers Market Revenue (Million), by Animals 2024 & 2032
- Figure 28: North America Animal Performance Enhancers Market Volume (K Unit), by Animals 2024 & 2032
- Figure 29: North America Animal Performance Enhancers Market Revenue Share (%), by Animals 2024 & 2032
- Figure 30: North America Animal Performance Enhancers Market Volume Share (%), by Animals 2024 & 2032
- Figure 31: North America Animal Performance Enhancers Market Revenue (Million), by Country 2024 & 2032
- Figure 32: North America Animal Performance Enhancers Market Volume (K Unit), by Country 2024 & 2032
- Figure 33: North America Animal Performance Enhancers Market Revenue Share (%), by Country 2024 & 2032
- Figure 34: North America Animal Performance Enhancers Market Volume Share (%), by Country 2024 & 2032
- Figure 35: Europe Animal Performance Enhancers Market Revenue (Million), by Application 2024 & 2032
- Figure 36: Europe Animal Performance Enhancers Market Volume (K Unit), by Application 2024 & 2032
- Figure 37: Europe Animal Performance Enhancers Market Revenue Share (%), by Application 2024 & 2032
- Figure 38: Europe Animal Performance Enhancers Market Volume Share (%), by Application 2024 & 2032
- Figure 39: Europe Animal Performance Enhancers Market Revenue (Million), by Animals 2024 & 2032
- Figure 40: Europe Animal Performance Enhancers Market Volume (K Unit), by Animals 2024 & 2032
- Figure 41: Europe Animal Performance Enhancers Market Revenue Share (%), by Animals 2024 & 2032
- Figure 42: Europe Animal Performance Enhancers Market Volume Share (%), by Animals 2024 & 2032
- Figure 43: Europe Animal Performance Enhancers Market Revenue (Million), by Country 2024 & 2032
- Figure 44: Europe Animal Performance Enhancers Market Volume (K Unit), by Country 2024 & 2032
- Figure 45: Europe Animal Performance Enhancers Market Revenue Share (%), by Country 2024 & 2032
- Figure 46: Europe Animal Performance Enhancers Market Volume Share (%), by Country 2024 & 2032
- Figure 47: Asia Pacific Animal Performance Enhancers Market Revenue (Million), by Application 2024 & 2032
- Figure 48: Asia Pacific Animal Performance Enhancers Market Volume (K Unit), by Application 2024 & 2032
- Figure 49: Asia Pacific Animal Performance Enhancers Market Revenue Share (%), by Application 2024 & 2032
- Figure 50: Asia Pacific Animal Performance Enhancers Market Volume Share (%), by Application 2024 & 2032
- Figure 51: Asia Pacific Animal Performance Enhancers Market Revenue (Million), by Animals 2024 & 2032
- Figure 52: Asia Pacific Animal Performance Enhancers Market Volume (K Unit), by Animals 2024 & 2032
- Figure 53: Asia Pacific Animal Performance Enhancers Market Revenue Share (%), by Animals 2024 & 2032
- Figure 54: Asia Pacific Animal Performance Enhancers Market Volume Share (%), by Animals 2024 & 2032
- Figure 55: Asia Pacific Animal Performance Enhancers Market Revenue (Million), by Country 2024 & 2032
- Figure 56: Asia Pacific Animal Performance Enhancers Market Volume (K Unit), by Country 2024 & 2032
- Figure 57: Asia Pacific Animal Performance Enhancers Market Revenue Share (%), by Country 2024 & 2032
- Figure 58: Asia Pacific Animal Performance Enhancers Market Volume Share (%), by Country 2024 & 2032
- Figure 59: Middle East and Africa Animal Performance Enhancers Market Revenue (Million), by Application 2024 & 2032
- Figure 60: Middle East and Africa Animal Performance Enhancers Market Volume (K Unit), by Application 2024 & 2032
- Figure 61: Middle East and Africa Animal Performance Enhancers Market Revenue Share (%), by Application 2024 & 2032
- Figure 62: Middle East and Africa Animal Performance Enhancers Market Volume Share (%), by Application 2024 & 2032
- Figure 63: Middle East and Africa Animal Performance Enhancers Market Revenue (Million), by Animals 2024 & 2032
- Figure 64: Middle East and Africa Animal Performance Enhancers Market Volume (K Unit), by Animals 2024 & 2032
- Figure 65: Middle East and Africa Animal Performance Enhancers Market Revenue Share (%), by Animals 2024 & 2032
- Figure 66: Middle East and Africa Animal Performance Enhancers Market Volume Share (%), by Animals 2024 & 2032
- Figure 67: Middle East and Africa Animal Performance Enhancers Market Revenue (Million), by Country 2024 & 2032
- Figure 68: Middle East and Africa Animal Performance Enhancers Market Volume (K Unit), by Country 2024 & 2032
- Figure 69: Middle East and Africa Animal Performance Enhancers Market Revenue Share (%), by Country 2024 & 2032
- Figure 70: Middle East and Africa Animal Performance Enhancers Market Volume Share (%), by Country 2024 & 2032
- Figure 71: South America Animal Performance Enhancers Market Revenue (Million), by Application 2024 & 2032
- Figure 72: South America Animal Performance Enhancers Market Volume (K Unit), by Application 2024 & 2032
- Figure 73: South America Animal Performance Enhancers Market Revenue Share (%), by Application 2024 & 2032
- Figure 74: South America Animal Performance Enhancers Market Volume Share (%), by Application 2024 & 2032
- Figure 75: South America Animal Performance Enhancers Market Revenue (Million), by Animals 2024 & 2032
- Figure 76: South America Animal Performance Enhancers Market Volume (K Unit), by Animals 2024 & 2032
- Figure 77: South America Animal Performance Enhancers Market Revenue Share (%), by Animals 2024 & 2032
- Figure 78: South America Animal Performance Enhancers Market Volume Share (%), by Animals 2024 & 2032
- Figure 79: South America Animal Performance Enhancers Market Revenue (Million), by Country 2024 & 2032
- Figure 80: South America Animal Performance Enhancers Market Volume (K Unit), by Country 2024 & 2032
- Figure 81: South America Animal Performance Enhancers Market Revenue Share (%), by Country 2024 & 2032
- Figure 82: South America Animal Performance Enhancers Market Volume Share (%), by Country 2024 & 2032
List of Tables
- Table 1: Global Animal Performance Enhancers Market Revenue Million Forecast, by Region 2019 & 2032
- Table 2: Global Animal Performance Enhancers Market Volume K Unit Forecast, by Region 2019 & 2032
- Table 3: Global Animal Performance Enhancers Market Revenue Million Forecast, by Application 2019 & 2032
- Table 4: Global Animal Performance Enhancers Market Volume K Unit Forecast, by Application 2019 & 2032
- Table 5: Global Animal Performance Enhancers Market Revenue Million Forecast, by Animals 2019 & 2032
- Table 6: Global Animal Performance Enhancers Market Volume K Unit Forecast, by Animals 2019 & 2032
- Table 7: Global Animal Performance Enhancers Market Revenue Million Forecast, by Region 2019 & 2032
- Table 8: Global Animal Performance Enhancers Market Volume K Unit Forecast, by Region 2019 & 2032
- Table 9: Global Animal Performance Enhancers Market Revenue Million Forecast, by Country 2019 & 2032
- Table 10: Global Animal Performance Enhancers Market Volume K Unit Forecast, by Country 2019 & 2032
- Table 11: United States Animal Performance Enhancers Market Revenue (Million) Forecast, by Application 2019 & 2032
- Table 12: United States Animal Performance Enhancers Market Volume (K Unit) Forecast, by Application 2019 & 2032
- Table 13: Canada Animal Performance Enhancers Market Revenue (Million) Forecast, by Application 2019 & 2032
- Table 14: Canada Animal Performance Enhancers Market Volume (K Unit) Forecast, by Application 2019 & 2032
- Table 15: Mexico Animal Performance Enhancers Market Revenue (Million) Forecast, by Application 2019 & 2032
- Table 16: Mexico Animal Performance Enhancers Market Volume (K Unit) Forecast, by Application 2019 & 2032
- Table 17: Global Animal Performance Enhancers Market Revenue Million Forecast, by Country 2019 & 2032
- Table 18: Global Animal Performance Enhancers Market Volume K Unit Forecast, by Country 2019 & 2032
- Table 19: Germany Animal Performance Enhancers Market Revenue (Million) Forecast, by Application 2019 & 2032
- Table 20: Germany Animal Performance Enhancers Market Volume (K Unit) Forecast, by Application 2019 & 2032
- Table 21: United Kingdom Animal Performance Enhancers Market Revenue (Million) Forecast, by Application 2019 & 2032
- Table 22: United Kingdom Animal Performance Enhancers Market Volume (K Unit) Forecast, by Application 2019 & 2032
- Table 23: France Animal Performance Enhancers Market Revenue (Million) Forecast, by Application 2019 & 2032
- Table 24: France Animal Performance Enhancers Market Volume (K Unit) Forecast, by Application 2019 & 2032
- Table 25: Italy Animal Performance Enhancers Market Revenue (Million) Forecast, by Application 2019 & 2032
- Table 26: Italy Animal Performance Enhancers Market Volume (K Unit) Forecast, by Application 2019 & 2032
- Table 27: Spain Animal Performance Enhancers Market Revenue (Million) Forecast, by Application 2019 & 2032
- Table 28: Spain Animal Performance Enhancers Market Volume (K Unit) Forecast, by Application 2019 & 2032
- Table 29: Rest of Europe Animal Performance Enhancers Market Revenue (Million) Forecast, by Application 2019 & 2032
- Table 30: Rest of Europe Animal Performance Enhancers Market Volume (K Unit) Forecast, by Application 2019 & 2032
- Table 31: Global Animal Performance Enhancers Market Revenue Million Forecast, by Country 2019 & 2032
- Table 32: Global Animal Performance Enhancers Market Volume K Unit Forecast, by Country 2019 & 2032
- Table 33: China Animal Performance Enhancers Market Revenue (Million) Forecast, by Application 2019 & 2032
- Table 34: China Animal Performance Enhancers Market Volume (K Unit) Forecast, by Application 2019 & 2032
- Table 35: Japan Animal Performance Enhancers Market Revenue (Million) Forecast, by Application 2019 & 2032
- Table 36: Japan Animal Performance Enhancers Market Volume (K Unit) Forecast, by Application 2019 & 2032
- Table 37: India Animal Performance Enhancers Market Revenue (Million) Forecast, by Application 2019 & 2032
- Table 38: India Animal Performance Enhancers Market Volume (K Unit) Forecast, by Application 2019 & 2032
- Table 39: Australia Animal Performance Enhancers Market Revenue (Million) Forecast, by Application 2019 & 2032
- Table 40: Australia Animal Performance Enhancers Market Volume (K Unit) Forecast, by Application 2019 & 2032
- Table 41: South Korea Animal Performance Enhancers Market Revenue (Million) Forecast, by Application 2019 & 2032
- Table 42: South Korea Animal Performance Enhancers Market Volume (K Unit) Forecast, by Application 2019 & 2032
- Table 43: Rest of Asia Pacific Animal Performance Enhancers Market Revenue (Million) Forecast, by Application 2019 & 2032
- Table 44: Rest of Asia Pacific Animal Performance Enhancers Market Volume (K Unit) Forecast, by Application 2019 & 2032
- Table 45: Global Animal Performance Enhancers Market Revenue Million Forecast, by Country 2019 & 2032
- Table 46: Global Animal Performance Enhancers Market Volume K Unit Forecast, by Country 2019 & 2032
- Table 47: GCC Animal Performance Enhancers Market Revenue (Million) Forecast, by Application 2019 & 2032
- Table 48: GCC Animal Performance Enhancers Market Volume (K Unit) Forecast, by Application 2019 & 2032
- Table 49: South Africa Animal Performance Enhancers Market Revenue (Million) Forecast, by Application 2019 & 2032
- Table 50: South Africa Animal Performance Enhancers Market Volume (K Unit) Forecast, by Application 2019 & 2032
- Table 51: Rest of Middle East and Africa Animal Performance Enhancers Market Revenue (Million) Forecast, by Application 2019 & 2032
- Table 52: Rest of Middle East and Africa Animal Performance Enhancers Market Volume (K Unit) Forecast, by Application 2019 & 2032
- Table 53: Global Animal Performance Enhancers Market Revenue Million Forecast, by Country 2019 & 2032
- Table 54: Global Animal Performance Enhancers Market Volume K Unit Forecast, by Country 2019 & 2032
- Table 55: Brazil Animal Performance Enhancers Market Revenue (Million) Forecast, by Application 2019 & 2032
- Table 56: Brazil Animal Performance Enhancers Market Volume (K Unit) Forecast, by Application 2019 & 2032
- Table 57: Argentina Animal Performance Enhancers Market Revenue (Million) Forecast, by Application 2019 & 2032
- Table 58: Argentina Animal Performance Enhancers Market Volume (K Unit) Forecast, by Application 2019 & 2032
- Table 59: Rest of South America Animal Performance Enhancers Market Revenue (Million) Forecast, by Application 2019 & 2032
- Table 60: Rest of South America Animal Performance Enhancers Market Volume (K Unit) Forecast, by Application 2019 & 2032
- Table 61: Global Animal Performance Enhancers Market Revenue Million Forecast, by Application 2019 & 2032
- Table 62: Global Animal Performance Enhancers Market Volume K Unit Forecast, by Application 2019 & 2032
- Table 63: Global Animal Performance Enhancers Market Revenue Million Forecast, by Animals 2019 & 2032
- Table 64: Global Animal Performance Enhancers Market Volume K Unit Forecast, by Animals 2019 & 2032
- Table 65: Global Animal Performance Enhancers Market Revenue Million Forecast, by Country 2019 & 2032
- Table 66: Global Animal Performance Enhancers Market Volume K Unit Forecast, by Country 2019 & 2032
- Table 67: United States Animal Performance Enhancers Market Revenue (Million) Forecast, by Application 2019 & 2032
- Table 68: United States Animal Performance Enhancers Market Volume (K Unit) Forecast, by Application 2019 & 2032
- Table 69: Canada Animal Performance Enhancers Market Revenue (Million) Forecast, by Application 2019 & 2032
- Table 70: Canada Animal Performance Enhancers Market Volume (K Unit) Forecast, by Application 2019 & 2032
- Table 71: Mexico Animal Performance Enhancers Market Revenue (Million) Forecast, by Application 2019 & 2032
- Table 72: Mexico Animal Performance Enhancers Market Volume (K Unit) Forecast, by Application 2019 & 2032
- Table 73: Global Animal Performance Enhancers Market Revenue Million Forecast, by Application 2019 & 2032
- Table 74: Global Animal Performance Enhancers Market Volume K Unit Forecast, by Application 2019 & 2032
- Table 75: Global Animal Performance Enhancers Market Revenue Million Forecast, by Animals 2019 & 2032
- Table 76: Global Animal Performance Enhancers Market Volume K Unit Forecast, by Animals 2019 & 2032
- Table 77: Global Animal Performance Enhancers Market Revenue Million Forecast, by Country 2019 & 2032
- Table 78: Global Animal Performance Enhancers Market Volume K Unit Forecast, by Country 2019 & 2032
- Table 79: Germany Animal Performance Enhancers Market Revenue (Million) Forecast, by Application 2019 & 2032
- Table 80: Germany Animal Performance Enhancers Market Volume (K Unit) Forecast, by Application 2019 & 2032
- Table 81: United Kingdom Animal Performance Enhancers Market Revenue (Million) Forecast, by Application 2019 & 2032
- Table 82: United Kingdom Animal Performance Enhancers Market Volume (K Unit) Forecast, by Application 2019 & 2032
- Table 83: France Animal Performance Enhancers Market Revenue (Million) Forecast, by Application 2019 & 2032
- Table 84: France Animal Performance Enhancers Market Volume (K Unit) Forecast, by Application 2019 & 2032
- Table 85: Italy Animal Performance Enhancers Market Revenue (Million) Forecast, by Application 2019 & 2032
- Table 86: Italy Animal Performance Enhancers Market Volume (K Unit) Forecast, by Application 2019 & 2032
- Table 87: Spain Animal Performance Enhancers Market Revenue (Million) Forecast, by Application 2019 & 2032
- Table 88: Spain Animal Performance Enhancers Market Volume (K Unit) Forecast, by Application 2019 & 2032
- Table 89: Rest of Europe Animal Performance Enhancers Market Revenue (Million) Forecast, by Application 2019 & 2032
- Table 90: Rest of Europe Animal Performance Enhancers Market Volume (K Unit) Forecast, by Application 2019 & 2032
- Table 91: Global Animal Performance Enhancers Market Revenue Million Forecast, by Application 2019 & 2032
- Table 92: Global Animal Performance Enhancers Market Volume K Unit Forecast, by Application 2019 & 2032
- Table 93: Global Animal Performance Enhancers Market Revenue Million Forecast, by Animals 2019 & 2032
- Table 94: Global Animal Performance Enhancers Market Volume K Unit Forecast, by Animals 2019 & 2032
- Table 95: Global Animal Performance Enhancers Market Revenue Million Forecast, by Country 2019 & 2032
- Table 96: Global Animal Performance Enhancers Market Volume K Unit Forecast, by Country 2019 & 2032
- Table 97: China Animal Performance Enhancers Market Revenue (Million) Forecast, by Application 2019 & 2032
- Table 98: China Animal Performance Enhancers Market Volume (K Unit) Forecast, by Application 2019 & 2032
- Table 99: Japan Animal Performance Enhancers Market Revenue (Million) Forecast, by Application 2019 & 2032
- Table 100: Japan Animal Performance Enhancers Market Volume (K Unit) Forecast, by Application 2019 & 2032
- Table 101: India Animal Performance Enhancers Market Revenue (Million) Forecast, by Application 2019 & 2032
- Table 102: India Animal Performance Enhancers Market Volume (K Unit) Forecast, by Application 2019 & 2032
- Table 103: Australia Animal Performance Enhancers Market Revenue (Million) Forecast, by Application 2019 & 2032
- Table 104: Australia Animal Performance Enhancers Market Volume (K Unit) Forecast, by Application 2019 & 2032
- Table 105: South Korea Animal Performance Enhancers Market Revenue (Million) Forecast, by Application 2019 & 2032
- Table 106: South Korea Animal Performance Enhancers Market Volume (K Unit) Forecast, by Application 2019 & 2032
- Table 107: Rest of Asia Pacific Animal Performance Enhancers Market Revenue (Million) Forecast, by Application 2019 & 2032
- Table 108: Rest of Asia Pacific Animal Performance Enhancers Market Volume (K Unit) Forecast, by Application 2019 & 2032
- Table 109: Global Animal Performance Enhancers Market Revenue Million Forecast, by Application 2019 & 2032
- Table 110: Global Animal Performance Enhancers Market Volume K Unit Forecast, by Application 2019 & 2032
- Table 111: Global Animal Performance Enhancers Market Revenue Million Forecast, by Animals 2019 & 2032
- Table 112: Global Animal Performance Enhancers Market Volume K Unit Forecast, by Animals 2019 & 2032
- Table 113: Global Animal Performance Enhancers Market Revenue Million Forecast, by Country 2019 & 2032
- Table 114: Global Animal Performance Enhancers Market Volume K Unit Forecast, by Country 2019 & 2032
- Table 115: GCC Animal Performance Enhancers Market Revenue (Million) Forecast, by Application 2019 & 2032
- Table 116: GCC Animal Performance Enhancers Market Volume (K Unit) Forecast, by Application 2019 & 2032
- Table 117: South Africa Animal Performance Enhancers Market Revenue (Million) Forecast, by Application 2019 & 2032
- Table 118: South Africa Animal Performance Enhancers Market Volume (K Unit) Forecast, by Application 2019 & 2032
- Table 119: Rest of Middle East and Africa Animal Performance Enhancers Market Revenue (Million) Forecast, by Application 2019 & 2032
- Table 120: Rest of Middle East and Africa Animal Performance Enhancers Market Volume (K Unit) Forecast, by Application 2019 & 2032
- Table 121: Global Animal Performance Enhancers Market Revenue Million Forecast, by Application 2019 & 2032
- Table 122: Global Animal Performance Enhancers Market Volume K Unit Forecast, by Application 2019 & 2032
- Table 123: Global Animal Performance Enhancers Market Revenue Million Forecast, by Animals 2019 & 2032
- Table 124: Global Animal Performance Enhancers Market Volume K Unit Forecast, by Animals 2019 & 2032
- Table 125: Global Animal Performance Enhancers Market Revenue Million Forecast, by Country 2019 & 2032
- Table 126: Global Animal Performance Enhancers Market Volume K Unit Forecast, by Country 2019 & 2032
- Table 127: Brazil Animal Performance Enhancers Market Revenue (Million) Forecast, by Application 2019 & 2032
- Table 128: Brazil Animal Performance Enhancers Market Volume (K Unit) Forecast, by Application 2019 & 2032
- Table 129: Argentina Animal Performance Enhancers Market Revenue (Million) Forecast, by Application 2019 & 2032
- Table 130: Argentina Animal Performance Enhancers Market Volume (K Unit) Forecast, by Application 2019 & 2032
- Table 131: Rest of South America Animal Performance Enhancers Market Revenue (Million) Forecast, by Application 2019 & 2032
- Table 132: Rest of South America Animal Performance Enhancers Market Volume (K Unit) Forecast, by Application 2019 & 2032
Frequently Asked Questions
1. What is the projected Compound Annual Growth Rate (CAGR) of the Animal Performance Enhancers Market?
The projected CAGR is approximately 5.52%.
2. Which companies are prominent players in the Animal Performance Enhancers Market?
Key companies in the market include CEVA Sante Animale, Bimeda Animal Health, Merck & Co Inc, Elanco (Bayer Animal Health), Virbac Group, Soparfin SCA (Vetiquinol), Jurox Pty Ltd, Syntex SA, HIPRA Animal Health, Boehringer Ingelheim, Huvepharma, Zoetis Inc.
3. What are the main segments of the Animal Performance Enhancers Market?
The market segments include Application, Animals.
4. Can you provide details about the market size?
The market size is estimated to be USD XX Million as of 2022.
5. What are some drivers contributing to market growth?
Growing Burden of Hormonal Deficiency Diseases in Animals; Rising Demand For Meat; Increase in Animal Husbandry.
6. What are the notable trends driving market growth?
Livestock Animal Segment is Expected to Witness Growth Over the Forecast Period.
7. Are there any restraints impacting market growth?
Side Effects Associated With Use of Animal Hormones; Stringent Government Regulations Associated With Animal Hormones.
8. Can you provide examples of recent developments in the market?
September 2022: Merck Animal Health, known as MSD Animal Health, announced it had signed a definitive agreement to acquire Vence.
9. What pricing options are available for accessing the report?
Pricing options include single-user, multi-user, and enterprise licenses priced at USD 4750, USD 5250, and USD 8750 respectively.
10. Is the market size provided in terms of value or volume?
The market size is provided in terms of value, measured in Million and volume, measured in K Unit.
11. Are there any specific market keywords associated with the report?
Yes, the market keyword associated with the report is "Animal Performance Enhancers Market," which aids in identifying and referencing the specific market segment covered.
12. How do I determine which pricing option suits my needs best?
The pricing options vary based on user requirements and access needs. Individual users may opt for single-user licenses, while businesses requiring broader access may choose multi-user or enterprise licenses for cost-effective access to the report.
13. Are there any additional resources or data provided in the Animal Performance Enhancers Market report?
While the report offers comprehensive insights, it's advisable to review the specific contents or supplementary materials provided to ascertain if additional resources or data are available.
14. How can I stay updated on further developments or reports in the Animal Performance Enhancers Market?
To stay informed about further developments, trends, and reports in the Animal Performance Enhancers Market, consider subscribing to industry newsletters, following relevant companies and organizations, or regularly checking reputable industry news sources and publications.
Methodology
Step 1 - Identification of Relevant Samples Size from Population Database


Step 2 - Approaches for Defining Global Market Size (Value, Volume* & Price*)

Note*: In applicable scenarios
Step 3 - Data Sources
Primary Research
- Web Analytics
- Survey Reports
- Research Institute
- Latest Research Reports
- Opinion Leaders
Secondary Research
- Annual Reports
- White Paper
- Latest Press Release
- Industry Association
- Paid Database
- Investor Presentations

Step 4 - Data Triangulation
Involves using different sources of information in order to increase the validity of a study
These sources are likely to be stakeholders in a program - participants, other researchers, program staff, other community members, and so on.
Then we put all data in single framework & apply various statistical tools to find out the dynamic on the market.
During the analysis stage, feedback from the stakeholder groups would be compared to determine areas of agreement as well as areas of divergence


