
Key Insights
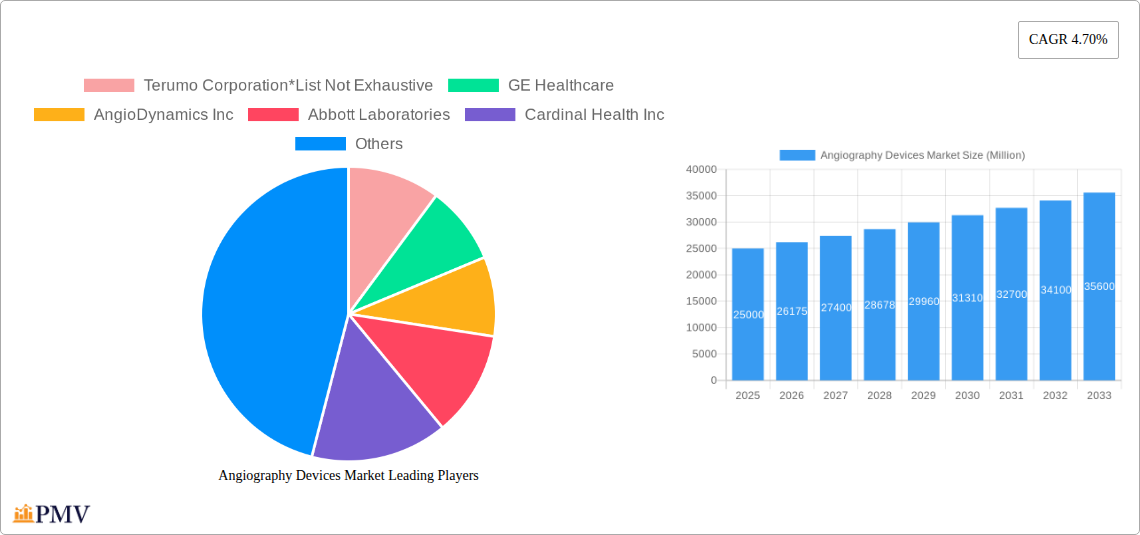
The global angiography devices market, valued at approximately $XX million in 2025, is projected to experience robust growth, driven by a compound annual growth rate (CAGR) of 4.70% from 2025 to 2033. This expansion is fueled by several key factors. The increasing prevalence of cardiovascular diseases globally necessitates advanced diagnostic and interventional procedures, significantly boosting demand for angiography systems and consumables. Technological advancements, such as the integration of artificial intelligence (AI) and machine learning (ML) in imaging systems, are improving diagnostic accuracy and efficiency, further driving market growth. Minimally invasive techniques are gaining traction, reducing patient recovery times and hospital stays, thus increasing the adoption of angiography procedures. The aging global population, a significant risk factor for cardiovascular diseases, also contributes to market expansion. Growth is further fueled by rising healthcare expenditure in developing economies and increasing awareness about preventive healthcare.
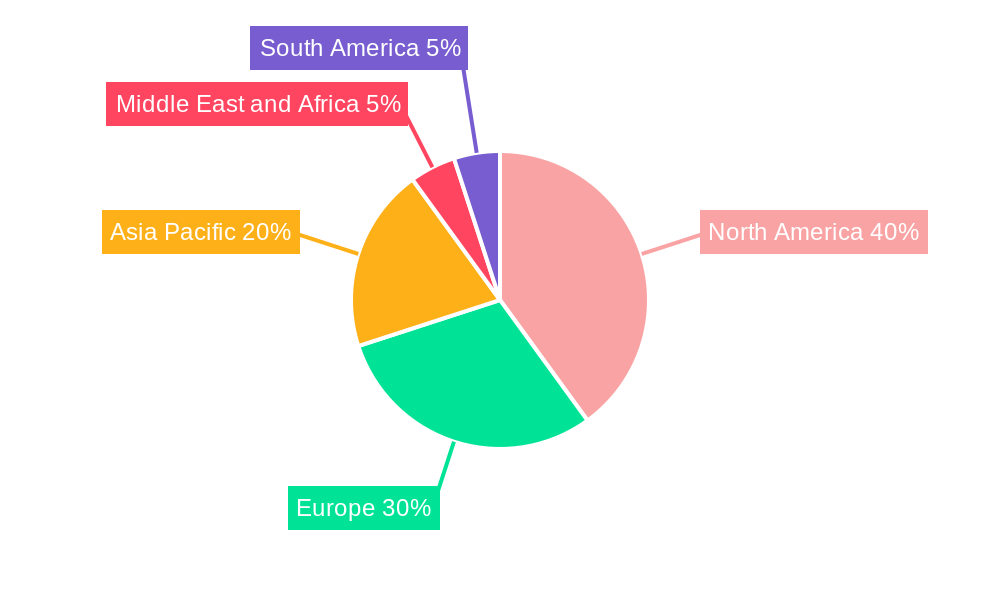
However, the market faces certain restraints. High costs associated with angiography devices and procedures limit accessibility, particularly in low- and middle-income countries. Stringent regulatory approvals and reimbursement policies also pose challenges for market players. Furthermore, the potential risks and complications associated with angiography procedures, although rare, can impact market growth. Nevertheless, the market is segmented into various product types (angiographic systems, consumables), technologies (MRI, CT, X-ray), applications (cerebral, carotid, peripheral, aortic, coronary), and end-users (hospitals, diagnostic centers). North America currently holds a significant market share, driven by technological advancements and high healthcare expenditure. However, the Asia Pacific region is expected to witness substantial growth due to rising healthcare infrastructure and increasing prevalence of cardiovascular diseases. Leading companies like Terumo Corporation, GE Healthcare, AngioDynamics Inc., and others are actively investing in research and development to improve existing technologies and introduce innovative solutions, solidifying their positions within this expanding market.
Angiography Devices Market: A Comprehensive Analysis (2019-2033)
This in-depth report provides a comprehensive analysis of the Angiography Devices market, offering valuable insights for stakeholders across the industry. Covering the period from 2019 to 2033, with a base year of 2025 and a forecast period of 2025-2033, this report meticulously examines market dynamics, competitive landscapes, and future growth potential. The global market size is estimated at xx Million in 2025 and is projected to reach xx Million by 2033, exhibiting a CAGR of xx% during the forecast period.
Angiography Devices Market Structure & Competitive Dynamics
The Angiography Devices market exhibits a moderately concentrated structure, with a few key players holding significant market share. Market leaders such as Terumo Corporation, GE Healthcare, AngioDynamics Inc, Abbott Laboratories, Cardinal Health Inc, Siemens Healthineers AG, Medtronic PLC, Koninklijke Philips NV, Boston Scientific Corporation, and Shimadzu Corporation compete fiercely, driving innovation and shaping market dynamics. The market share of the top five players in 2025 is estimated at xx%, indicating a consolidated yet competitive environment. Innovation ecosystems are robust, with ongoing research and development leading to advancements in imaging technologies and minimally invasive procedures. Stringent regulatory frameworks, primarily driven by agencies like the FDA and EMA, govern product approvals and market access. The market faces limited substitution from alternative diagnostic methods, although advancements in non-invasive imaging techniques pose a gradual competitive threat. End-user trends show a preference for advanced systems offering improved image quality, reduced procedure times, and enhanced patient safety. Mergers and acquisitions (M&A) activities have been moderately active in recent years, with deal values ranging from xx Million to xx Million, mostly focused on strengthening product portfolios and expanding geographic reach. For instance, a recent acquisition in [Year] saw [Company A] acquire [Company B] for xx Million, strengthening its presence in [Specific Geographic Region/Technology].
Angiography Devices Market Industry Trends & Insights
The Angiography Devices market is experiencing significant growth propelled by several factors. The rising prevalence of cardiovascular diseases globally is a key driver, leading to increased demand for diagnostic and interventional procedures. Technological advancements, such as the development of improved imaging technologies (MRI, CT, X-ray), miniaturized devices, and AI-powered image analysis tools, are further fueling market expansion. The adoption of minimally invasive techniques is also gaining traction, reducing patient recovery times and healthcare costs. Consumer preferences lean toward procedures with enhanced precision, safety, and reduced complications. These trends are reflected in the high CAGR of xx% projected for the forecast period. Market penetration of advanced imaging technologies like MRI and CT is increasing, particularly in developed regions with high healthcare expenditure. The competitive landscape remains intensely competitive, with companies striving to differentiate themselves through technological innovation, strategic partnerships, and robust distribution networks. The growing adoption of telemedicine and remote monitoring solutions is expected to create new opportunities for growth within the market. However, reimbursement policies and healthcare budget constraints in certain regions could pose some challenges.
Dominant Markets & Segments in Angiography Devices Market
- Leading Region: North America currently holds the largest market share in the Angiography Devices market due to high prevalence of cardiovascular diseases, advanced healthcare infrastructure, and high healthcare expenditure. Europe follows closely, driven by similar factors, although at a slightly lower pace.
- Leading Country: The United States holds the largest market share within North America due to factors such as a large aging population, high prevalence of cardiovascular diseases, and advanced healthcare infrastructure.
- Dominant Product Segment: Angiographic Systems holds a significant market share owing to the higher cost and technologically advanced nature of the devices. However, the consumables segment is expected to witness robust growth due to its recurring nature and necessity for every procedure.
- Dominant Technology Segment: X-ray angiography currently dominates, but CT and MRI are steadily gaining traction due to their superior imaging capabilities. This shift is largely attributed to improved image resolution and reduced radiation exposure compared to conventional X-ray.
- Dominant Application Segment: Coronary angiography constitutes the largest application segment, driven by the high prevalence of coronary artery disease. However, peripheral and cerebral angiography segments are exhibiting faster growth rates due to growing awareness and improved treatment options for peripheral artery disease and stroke.
- Dominant End-User Segment: Hospitals currently dominate the end-user landscape due to their comprehensive facilities and experienced personnel. However, diagnostic centers and ambulatory surgical centers are expected to witness substantial growth driven by increasing focus on outpatient procedures and cost-effectiveness. Key drivers in these segments include economic policies promoting healthcare access, favorable reimbursement regulations, and increasing investment in healthcare infrastructure, especially in emerging economies. The dominance of specific segments is subject to continuous evaluation based on factors such as technological advancements and changing healthcare priorities.
Angiography Devices Market Product Innovations
Recent innovations in angiography devices focus on miniaturization, enhanced image quality, and improved navigation systems. Companies are integrating advanced technologies such as AI and machine learning to improve diagnostic accuracy and treatment planning. These innovations aim to reduce procedure times, improve patient outcomes, and enhance overall efficiency. The market is witnessing the introduction of hybrid imaging systems combining different technologies (e.g., CT and angiography) to provide a more comprehensive view of the circulatory system. This trend caters to the rising need for more accurate diagnostics and minimally invasive interventions.
Report Segmentation & Scope
The Angiography Devices market is segmented by product (Angiographic Systems, Consumables), technology (MRI, CT, X-ray, Other Technologies), application (Cerebral, Carotid, Peripheral, Aortic, Coronary, Other Applications), and end-user (Hospitals, Diagnostic Centers, Ambulatory Surgical Centers). Each segment's growth trajectory is analyzed in detail, considering market size, growth projections, and competitive dynamics. The report provides granular insights into the market share of each segment and its contribution to the overall market value. For instance, the Angiographic Systems segment is projected to grow at a xx% CAGR, driven by technological innovation. The consumables segment, crucial for every procedure, is estimated to have a growth rate of xx%, while the X-ray segment maintains a strong position, despite the rise of CT and MRI-based systems.
Key Drivers of Angiography Devices Market Growth
The Angiography Devices market growth is primarily fueled by:
- Rising Prevalence of Cardiovascular Diseases: The global increase in cardiovascular disease incidence is a major driving force, increasing the demand for diagnostic and therapeutic procedures.
- Technological Advancements: Continuous advancements in imaging technologies, device miniaturization, and improved navigation systems enhance procedure effectiveness and safety.
- Favorable Reimbursement Policies: Supportive government policies and healthcare insurance coverage facilitate wider access to angiography procedures.
- Growing Geriatric Population: The expanding aging population globally increases the susceptibility to cardiovascular diseases, thus increasing the demand for angiography devices.
Challenges in the Angiography Devices Market Sector
The Angiography Devices market faces several challenges:
- Stringent Regulatory Approvals: Obtaining regulatory clearances for new products can be time-consuming and expensive, impacting market entry and growth.
- High Costs Associated with Procedures: The high cost of angiography procedures can limit accessibility for patients in certain regions.
- Supply Chain Disruptions: Global supply chain disruptions due to various factors (e.g., pandemics, geopolitical tensions) can affect product availability and pricing.
- Intense Competition: The presence of numerous established players and new entrants creates fierce competition, requiring companies to constantly innovate and optimize their offerings. This competitiveness is leading to price pressures in certain market segments.
Leading Players in the Angiography Devices Market Market
- Terumo Corporation
- GE Healthcare
- AngioDynamics Inc
- Abbott Laboratories
- Cardinal Health Inc
- Siemens Healthineers AG
- Medtronic PLC
- Koninklijke Philips NV
- Boston Scientific Corporation
- Shimadzu Corporation
Key Developments in Angiography Devices Market Sector
- [Month, Year]: [Company X] launched a new angiography system with improved image quality and reduced radiation exposure.
- [Month, Year]: [Company Y] and [Company Z] announced a strategic partnership to develop next-generation angiography devices.
- [Month, Year]: [Regulatory body] approved a new angiography device for use in [Specific Application].
Strategic Angiography Devices Market Market Outlook
The Angiography Devices market exhibits significant growth potential in the coming years. The increasing prevalence of cardiovascular diseases, coupled with advancements in imaging technologies and minimally invasive procedures, creates favorable market conditions. Strategic opportunities exist in developing innovative devices, expanding geographic reach, and forming strategic partnerships to gain market share. Companies that focus on R&D, personalized medicine, and enhanced patient care are well-positioned to capitalize on future growth prospects. Expanding into emerging markets and improving access to affordable and high-quality angiography services are crucial for maximizing market potential.
Angiography Devices Market Segmentation
-
1. Product
- 1.1. Angiographic Systems
-
1.2. Consumables
- 1.2.1. Catheters
- 1.2.2. Guidewires
- 1.2.3. Contrast Media
- 1.2.4. Incision Closure Devices
- 1.2.5. Accessories
-
2. Technology
- 2.1. MRI
- 2.2. CT
- 2.3. X-ray
- 2.4. Other Technologies
-
3. Application
- 3.1. Cerebral
- 3.2. Carotid
- 3.3. Peripheral
- 3.4. Aortic
- 3.5. Coronary
- 3.6. Other Applications
-
4. End User
- 4.1. Hospitals
- 4.2. Diagnostic Centers
- 4.3. Ambulatory Surgical Centers
Angiography Devices Market Segmentation By Geography
-
1. North America
- 1.1. United States
- 1.2. Canada
- 1.3. Mexico
-
2. Europe
- 2.1. Germany
- 2.2. United Kingdom
- 2.3. France
- 2.4. Italy
- 2.5. Spain
- 2.6. Rest of Europe
-
3. Asia Pacific
- 3.1. China
- 3.2. Japan
- 3.3. India
- 3.4. Australia
- 3.5. South Korea
- 3.6. Rest of Asia Pacific
-
4. Middle East and Africa
- 4.1. GCC
- 4.2. South Africa
- 4.3. Rest of Middle East and Africa
-
5. South America
- 5.1. Brazil
- 5.2. Argentina
- 5.3. Rest of South America
Angiography Devices Market REPORT HIGHLIGHTS
| Aspects | Details |
|---|---|
| Study Period | 2019-2033 |
| Base Year | 2024 |
| Estimated Year | 2025 |
| Forecast Period | 2025-2033 |
| Historical Period | 2019-2024 |
| Growth Rate | CAGR of 4.70% from 2019-2033 |
| Segmentation |
|
Table of Contents
- 1. Introduction
- 1.1. Research Scope
- 1.2. Market Segmentation
- 1.3. Research Methodology
- 1.4. Definitions and Assumptions
- 2. Executive Summary
- 2.1. Introduction
- 3. Market Dynamics
- 3.1. Introduction
- 3.2. Market Drivers
- 3.2.1. ; Rising Geriatric Population and Increasing Prevalence of Cardiovascular Diseases; Growing Demand for Interventional Angiography in Minimally Invasive Surgeries
- 3.3. Market Restrains
- 3.3.1. ; High Procedure and Equipment Cost; Risks Associated with Angiography Procedures
- 3.4. Market Trends
- 3.4.1. The Hospital Segment is Expected to Dominate the Market During the Forecast Period
- 4. Market Factor Analysis
- 4.1. Porters Five Forces
- 4.2. Supply/Value Chain
- 4.3. PESTEL analysis
- 4.4. Market Entropy
- 4.5. Patent/Trademark Analysis
- 5. Global Angiography Devices Market Analysis, Insights and Forecast, 2019-2031
- 5.1. Market Analysis, Insights and Forecast - by Product
- 5.1.1. Angiographic Systems
- 5.1.2. Consumables
- 5.1.2.1. Catheters
- 5.1.2.2. Guidewires
- 5.1.2.3. Contrast Media
- 5.1.2.4. Incision Closure Devices
- 5.1.2.5. Accessories
- 5.2. Market Analysis, Insights and Forecast - by Technology
- 5.2.1. MRI
- 5.2.2. CT
- 5.2.3. X-ray
- 5.2.4. Other Technologies
- 5.3. Market Analysis, Insights and Forecast - by Application
- 5.3.1. Cerebral
- 5.3.2. Carotid
- 5.3.3. Peripheral
- 5.3.4. Aortic
- 5.3.5. Coronary
- 5.3.6. Other Applications
- 5.4. Market Analysis, Insights and Forecast - by End User
- 5.4.1. Hospitals
- 5.4.2. Diagnostic Centers
- 5.4.3. Ambulatory Surgical Centers
- 5.5. Market Analysis, Insights and Forecast - by Region
- 5.5.1. North America
- 5.5.2. Europe
- 5.5.3. Asia Pacific
- 5.5.4. Middle East and Africa
- 5.5.5. South America
- 5.1. Market Analysis, Insights and Forecast - by Product
- 6. North America Angiography Devices Market Analysis, Insights and Forecast, 2019-2031
- 6.1. Market Analysis, Insights and Forecast - by Product
- 6.1.1. Angiographic Systems
- 6.1.2. Consumables
- 6.1.2.1. Catheters
- 6.1.2.2. Guidewires
- 6.1.2.3. Contrast Media
- 6.1.2.4. Incision Closure Devices
- 6.1.2.5. Accessories
- 6.2. Market Analysis, Insights and Forecast - by Technology
- 6.2.1. MRI
- 6.2.2. CT
- 6.2.3. X-ray
- 6.2.4. Other Technologies
- 6.3. Market Analysis, Insights and Forecast - by Application
- 6.3.1. Cerebral
- 6.3.2. Carotid
- 6.3.3. Peripheral
- 6.3.4. Aortic
- 6.3.5. Coronary
- 6.3.6. Other Applications
- 6.4. Market Analysis, Insights and Forecast - by End User
- 6.4.1. Hospitals
- 6.4.2. Diagnostic Centers
- 6.4.3. Ambulatory Surgical Centers
- 6.1. Market Analysis, Insights and Forecast - by Product
- 7. Europe Angiography Devices Market Analysis, Insights and Forecast, 2019-2031
- 7.1. Market Analysis, Insights and Forecast - by Product
- 7.1.1. Angiographic Systems
- 7.1.2. Consumables
- 7.1.2.1. Catheters
- 7.1.2.2. Guidewires
- 7.1.2.3. Contrast Media
- 7.1.2.4. Incision Closure Devices
- 7.1.2.5. Accessories
- 7.2. Market Analysis, Insights and Forecast - by Technology
- 7.2.1. MRI
- 7.2.2. CT
- 7.2.3. X-ray
- 7.2.4. Other Technologies
- 7.3. Market Analysis, Insights and Forecast - by Application
- 7.3.1. Cerebral
- 7.3.2. Carotid
- 7.3.3. Peripheral
- 7.3.4. Aortic
- 7.3.5. Coronary
- 7.3.6. Other Applications
- 7.4. Market Analysis, Insights and Forecast - by End User
- 7.4.1. Hospitals
- 7.4.2. Diagnostic Centers
- 7.4.3. Ambulatory Surgical Centers
- 7.1. Market Analysis, Insights and Forecast - by Product
- 8. Asia Pacific Angiography Devices Market Analysis, Insights and Forecast, 2019-2031
- 8.1. Market Analysis, Insights and Forecast - by Product
- 8.1.1. Angiographic Systems
- 8.1.2. Consumables
- 8.1.2.1. Catheters
- 8.1.2.2. Guidewires
- 8.1.2.3. Contrast Media
- 8.1.2.4. Incision Closure Devices
- 8.1.2.5. Accessories
- 8.2. Market Analysis, Insights and Forecast - by Technology
- 8.2.1. MRI
- 8.2.2. CT
- 8.2.3. X-ray
- 8.2.4. Other Technologies
- 8.3. Market Analysis, Insights and Forecast - by Application
- 8.3.1. Cerebral
- 8.3.2. Carotid
- 8.3.3. Peripheral
- 8.3.4. Aortic
- 8.3.5. Coronary
- 8.3.6. Other Applications
- 8.4. Market Analysis, Insights and Forecast - by End User
- 8.4.1. Hospitals
- 8.4.2. Diagnostic Centers
- 8.4.3. Ambulatory Surgical Centers
- 8.1. Market Analysis, Insights and Forecast - by Product
- 9. Middle East and Africa Angiography Devices Market Analysis, Insights and Forecast, 2019-2031
- 9.1. Market Analysis, Insights and Forecast - by Product
- 9.1.1. Angiographic Systems
- 9.1.2. Consumables
- 9.1.2.1. Catheters
- 9.1.2.2. Guidewires
- 9.1.2.3. Contrast Media
- 9.1.2.4. Incision Closure Devices
- 9.1.2.5. Accessories
- 9.2. Market Analysis, Insights and Forecast - by Technology
- 9.2.1. MRI
- 9.2.2. CT
- 9.2.3. X-ray
- 9.2.4. Other Technologies
- 9.3. Market Analysis, Insights and Forecast - by Application
- 9.3.1. Cerebral
- 9.3.2. Carotid
- 9.3.3. Peripheral
- 9.3.4. Aortic
- 9.3.5. Coronary
- 9.3.6. Other Applications
- 9.4. Market Analysis, Insights and Forecast - by End User
- 9.4.1. Hospitals
- 9.4.2. Diagnostic Centers
- 9.4.3. Ambulatory Surgical Centers
- 9.1. Market Analysis, Insights and Forecast - by Product
- 10. South America Angiography Devices Market Analysis, Insights and Forecast, 2019-2031
- 10.1. Market Analysis, Insights and Forecast - by Product
- 10.1.1. Angiographic Systems
- 10.1.2. Consumables
- 10.1.2.1. Catheters
- 10.1.2.2. Guidewires
- 10.1.2.3. Contrast Media
- 10.1.2.4. Incision Closure Devices
- 10.1.2.5. Accessories
- 10.2. Market Analysis, Insights and Forecast - by Technology
- 10.2.1. MRI
- 10.2.2. CT
- 10.2.3. X-ray
- 10.2.4. Other Technologies
- 10.3. Market Analysis, Insights and Forecast - by Application
- 10.3.1. Cerebral
- 10.3.2. Carotid
- 10.3.3. Peripheral
- 10.3.4. Aortic
- 10.3.5. Coronary
- 10.3.6. Other Applications
- 10.4. Market Analysis, Insights and Forecast - by End User
- 10.4.1. Hospitals
- 10.4.2. Diagnostic Centers
- 10.4.3. Ambulatory Surgical Centers
- 10.1. Market Analysis, Insights and Forecast - by Product
- 11. North America Angiography Devices Market Analysis, Insights and Forecast, 2019-2031
- 11.1. Market Analysis, Insights and Forecast - By Country/Sub-region
- 11.1.1 United States
- 11.1.2 Canada
- 11.1.3 Mexico
- 12. Europe Angiography Devices Market Analysis, Insights and Forecast, 2019-2031
- 12.1. Market Analysis, Insights and Forecast - By Country/Sub-region
- 12.1.1 Germany
- 12.1.2 United Kingdom
- 12.1.3 France
- 12.1.4 Italy
- 12.1.5 Spain
- 12.1.6 Rest of Europe
- 13. Asia Pacific Angiography Devices Market Analysis, Insights and Forecast, 2019-2031
- 13.1. Market Analysis, Insights and Forecast - By Country/Sub-region
- 13.1.1 China
- 13.1.2 Japan
- 13.1.3 India
- 13.1.4 Australia
- 13.1.5 South Korea
- 13.1.6 Rest of Asia Pacific
- 14. Middle East and Africa Angiography Devices Market Analysis, Insights and Forecast, 2019-2031
- 14.1. Market Analysis, Insights and Forecast - By Country/Sub-region
- 14.1.1 GCC
- 14.1.2 South Africa
- 14.1.3 Rest of Middle East and Africa
- 15. South America Angiography Devices Market Analysis, Insights and Forecast, 2019-2031
- 15.1. Market Analysis, Insights and Forecast - By Country/Sub-region
- 15.1.1 Brazil
- 15.1.2 Argentina
- 15.1.3 Rest of South America
- 16. Competitive Analysis
- 16.1. Global Market Share Analysis 2024
- 16.2. Company Profiles
- 16.2.1 Terumo Corporation*List Not Exhaustive
- 16.2.1.1. Overview
- 16.2.1.2. Products
- 16.2.1.3. SWOT Analysis
- 16.2.1.4. Recent Developments
- 16.2.1.5. Financials (Based on Availability)
- 16.2.2 GE Healthcare
- 16.2.2.1. Overview
- 16.2.2.2. Products
- 16.2.2.3. SWOT Analysis
- 16.2.2.4. Recent Developments
- 16.2.2.5. Financials (Based on Availability)
- 16.2.3 AngioDynamics Inc
- 16.2.3.1. Overview
- 16.2.3.2. Products
- 16.2.3.3. SWOT Analysis
- 16.2.3.4. Recent Developments
- 16.2.3.5. Financials (Based on Availability)
- 16.2.4 Abbott Laboratories
- 16.2.4.1. Overview
- 16.2.4.2. Products
- 16.2.4.3. SWOT Analysis
- 16.2.4.4. Recent Developments
- 16.2.4.5. Financials (Based on Availability)
- 16.2.5 Cardinal Health Inc
- 16.2.5.1. Overview
- 16.2.5.2. Products
- 16.2.5.3. SWOT Analysis
- 16.2.5.4. Recent Developments
- 16.2.5.5. Financials (Based on Availability)
- 16.2.6 Siemens Healthineers AG
- 16.2.6.1. Overview
- 16.2.6.2. Products
- 16.2.6.3. SWOT Analysis
- 16.2.6.4. Recent Developments
- 16.2.6.5. Financials (Based on Availability)
- 16.2.7 Medtronic PLC
- 16.2.7.1. Overview
- 16.2.7.2. Products
- 16.2.7.3. SWOT Analysis
- 16.2.7.4. Recent Developments
- 16.2.7.5. Financials (Based on Availability)
- 16.2.8 Koninklijke Philips NV
- 16.2.8.1. Overview
- 16.2.8.2. Products
- 16.2.8.3. SWOT Analysis
- 16.2.8.4. Recent Developments
- 16.2.8.5. Financials (Based on Availability)
- 16.2.9 Boston Scientific Corporation
- 16.2.9.1. Overview
- 16.2.9.2. Products
- 16.2.9.3. SWOT Analysis
- 16.2.9.4. Recent Developments
- 16.2.9.5. Financials (Based on Availability)
- 16.2.10 Shimadzu Corporation
- 16.2.10.1. Overview
- 16.2.10.2. Products
- 16.2.10.3. SWOT Analysis
- 16.2.10.4. Recent Developments
- 16.2.10.5. Financials (Based on Availability)
- 16.2.1 Terumo Corporation*List Not Exhaustive
List of Figures
- Figure 1: Global Angiography Devices Market Revenue Breakdown (Million, %) by Region 2024 & 2032
- Figure 2: Global Angiography Devices Market Volume Breakdown (K Unit, %) by Region 2024 & 2032
- Figure 3: North America Angiography Devices Market Revenue (Million), by Country 2024 & 2032
- Figure 4: North America Angiography Devices Market Volume (K Unit), by Country 2024 & 2032
- Figure 5: North America Angiography Devices Market Revenue Share (%), by Country 2024 & 2032
- Figure 6: North America Angiography Devices Market Volume Share (%), by Country 2024 & 2032
- Figure 7: Europe Angiography Devices Market Revenue (Million), by Country 2024 & 2032
- Figure 8: Europe Angiography Devices Market Volume (K Unit), by Country 2024 & 2032
- Figure 9: Europe Angiography Devices Market Revenue Share (%), by Country 2024 & 2032
- Figure 10: Europe Angiography Devices Market Volume Share (%), by Country 2024 & 2032
- Figure 11: Asia Pacific Angiography Devices Market Revenue (Million), by Country 2024 & 2032
- Figure 12: Asia Pacific Angiography Devices Market Volume (K Unit), by Country 2024 & 2032
- Figure 13: Asia Pacific Angiography Devices Market Revenue Share (%), by Country 2024 & 2032
- Figure 14: Asia Pacific Angiography Devices Market Volume Share (%), by Country 2024 & 2032
- Figure 15: Middle East and Africa Angiography Devices Market Revenue (Million), by Country 2024 & 2032
- Figure 16: Middle East and Africa Angiography Devices Market Volume (K Unit), by Country 2024 & 2032
- Figure 17: Middle East and Africa Angiography Devices Market Revenue Share (%), by Country 2024 & 2032
- Figure 18: Middle East and Africa Angiography Devices Market Volume Share (%), by Country 2024 & 2032
- Figure 19: South America Angiography Devices Market Revenue (Million), by Country 2024 & 2032
- Figure 20: South America Angiography Devices Market Volume (K Unit), by Country 2024 & 2032
- Figure 21: South America Angiography Devices Market Revenue Share (%), by Country 2024 & 2032
- Figure 22: South America Angiography Devices Market Volume Share (%), by Country 2024 & 2032
- Figure 23: North America Angiography Devices Market Revenue (Million), by Product 2024 & 2032
- Figure 24: North America Angiography Devices Market Volume (K Unit), by Product 2024 & 2032
- Figure 25: North America Angiography Devices Market Revenue Share (%), by Product 2024 & 2032
- Figure 26: North America Angiography Devices Market Volume Share (%), by Product 2024 & 2032
- Figure 27: North America Angiography Devices Market Revenue (Million), by Technology 2024 & 2032
- Figure 28: North America Angiography Devices Market Volume (K Unit), by Technology 2024 & 2032
- Figure 29: North America Angiography Devices Market Revenue Share (%), by Technology 2024 & 2032
- Figure 30: North America Angiography Devices Market Volume Share (%), by Technology 2024 & 2032
- Figure 31: North America Angiography Devices Market Revenue (Million), by Application 2024 & 2032
- Figure 32: North America Angiography Devices Market Volume (K Unit), by Application 2024 & 2032
- Figure 33: North America Angiography Devices Market Revenue Share (%), by Application 2024 & 2032
- Figure 34: North America Angiography Devices Market Volume Share (%), by Application 2024 & 2032
- Figure 35: North America Angiography Devices Market Revenue (Million), by End User 2024 & 2032
- Figure 36: North America Angiography Devices Market Volume (K Unit), by End User 2024 & 2032
- Figure 37: North America Angiography Devices Market Revenue Share (%), by End User 2024 & 2032
- Figure 38: North America Angiography Devices Market Volume Share (%), by End User 2024 & 2032
- Figure 39: North America Angiography Devices Market Revenue (Million), by Country 2024 & 2032
- Figure 40: North America Angiography Devices Market Volume (K Unit), by Country 2024 & 2032
- Figure 41: North America Angiography Devices Market Revenue Share (%), by Country 2024 & 2032
- Figure 42: North America Angiography Devices Market Volume Share (%), by Country 2024 & 2032
- Figure 43: Europe Angiography Devices Market Revenue (Million), by Product 2024 & 2032
- Figure 44: Europe Angiography Devices Market Volume (K Unit), by Product 2024 & 2032
- Figure 45: Europe Angiography Devices Market Revenue Share (%), by Product 2024 & 2032
- Figure 46: Europe Angiography Devices Market Volume Share (%), by Product 2024 & 2032
- Figure 47: Europe Angiography Devices Market Revenue (Million), by Technology 2024 & 2032
- Figure 48: Europe Angiography Devices Market Volume (K Unit), by Technology 2024 & 2032
- Figure 49: Europe Angiography Devices Market Revenue Share (%), by Technology 2024 & 2032
- Figure 50: Europe Angiography Devices Market Volume Share (%), by Technology 2024 & 2032
- Figure 51: Europe Angiography Devices Market Revenue (Million), by Application 2024 & 2032
- Figure 52: Europe Angiography Devices Market Volume (K Unit), by Application 2024 & 2032
- Figure 53: Europe Angiography Devices Market Revenue Share (%), by Application 2024 & 2032
- Figure 54: Europe Angiography Devices Market Volume Share (%), by Application 2024 & 2032
- Figure 55: Europe Angiography Devices Market Revenue (Million), by End User 2024 & 2032
- Figure 56: Europe Angiography Devices Market Volume (K Unit), by End User 2024 & 2032
- Figure 57: Europe Angiography Devices Market Revenue Share (%), by End User 2024 & 2032
- Figure 58: Europe Angiography Devices Market Volume Share (%), by End User 2024 & 2032
- Figure 59: Europe Angiography Devices Market Revenue (Million), by Country 2024 & 2032
- Figure 60: Europe Angiography Devices Market Volume (K Unit), by Country 2024 & 2032
- Figure 61: Europe Angiography Devices Market Revenue Share (%), by Country 2024 & 2032
- Figure 62: Europe Angiography Devices Market Volume Share (%), by Country 2024 & 2032
- Figure 63: Asia Pacific Angiography Devices Market Revenue (Million), by Product 2024 & 2032
- Figure 64: Asia Pacific Angiography Devices Market Volume (K Unit), by Product 2024 & 2032
- Figure 65: Asia Pacific Angiography Devices Market Revenue Share (%), by Product 2024 & 2032
- Figure 66: Asia Pacific Angiography Devices Market Volume Share (%), by Product 2024 & 2032
- Figure 67: Asia Pacific Angiography Devices Market Revenue (Million), by Technology 2024 & 2032
- Figure 68: Asia Pacific Angiography Devices Market Volume (K Unit), by Technology 2024 & 2032
- Figure 69: Asia Pacific Angiography Devices Market Revenue Share (%), by Technology 2024 & 2032
- Figure 70: Asia Pacific Angiography Devices Market Volume Share (%), by Technology 2024 & 2032
- Figure 71: Asia Pacific Angiography Devices Market Revenue (Million), by Application 2024 & 2032
- Figure 72: Asia Pacific Angiography Devices Market Volume (K Unit), by Application 2024 & 2032
- Figure 73: Asia Pacific Angiography Devices Market Revenue Share (%), by Application 2024 & 2032
- Figure 74: Asia Pacific Angiography Devices Market Volume Share (%), by Application 2024 & 2032
- Figure 75: Asia Pacific Angiography Devices Market Revenue (Million), by End User 2024 & 2032
- Figure 76: Asia Pacific Angiography Devices Market Volume (K Unit), by End User 2024 & 2032
- Figure 77: Asia Pacific Angiography Devices Market Revenue Share (%), by End User 2024 & 2032
- Figure 78: Asia Pacific Angiography Devices Market Volume Share (%), by End User 2024 & 2032
- Figure 79: Asia Pacific Angiography Devices Market Revenue (Million), by Country 2024 & 2032
- Figure 80: Asia Pacific Angiography Devices Market Volume (K Unit), by Country 2024 & 2032
- Figure 81: Asia Pacific Angiography Devices Market Revenue Share (%), by Country 2024 & 2032
- Figure 82: Asia Pacific Angiography Devices Market Volume Share (%), by Country 2024 & 2032
- Figure 83: Middle East and Africa Angiography Devices Market Revenue (Million), by Product 2024 & 2032
- Figure 84: Middle East and Africa Angiography Devices Market Volume (K Unit), by Product 2024 & 2032
- Figure 85: Middle East and Africa Angiography Devices Market Revenue Share (%), by Product 2024 & 2032
- Figure 86: Middle East and Africa Angiography Devices Market Volume Share (%), by Product 2024 & 2032
- Figure 87: Middle East and Africa Angiography Devices Market Revenue (Million), by Technology 2024 & 2032
- Figure 88: Middle East and Africa Angiography Devices Market Volume (K Unit), by Technology 2024 & 2032
- Figure 89: Middle East and Africa Angiography Devices Market Revenue Share (%), by Technology 2024 & 2032
- Figure 90: Middle East and Africa Angiography Devices Market Volume Share (%), by Technology 2024 & 2032
- Figure 91: Middle East and Africa Angiography Devices Market Revenue (Million), by Application 2024 & 2032
- Figure 92: Middle East and Africa Angiography Devices Market Volume (K Unit), by Application 2024 & 2032
- Figure 93: Middle East and Africa Angiography Devices Market Revenue Share (%), by Application 2024 & 2032
- Figure 94: Middle East and Africa Angiography Devices Market Volume Share (%), by Application 2024 & 2032
- Figure 95: Middle East and Africa Angiography Devices Market Revenue (Million), by End User 2024 & 2032
- Figure 96: Middle East and Africa Angiography Devices Market Volume (K Unit), by End User 2024 & 2032
- Figure 97: Middle East and Africa Angiography Devices Market Revenue Share (%), by End User 2024 & 2032
- Figure 98: Middle East and Africa Angiography Devices Market Volume Share (%), by End User 2024 & 2032
- Figure 99: Middle East and Africa Angiography Devices Market Revenue (Million), by Country 2024 & 2032
- Figure 100: Middle East and Africa Angiography Devices Market Volume (K Unit), by Country 2024 & 2032
- Figure 101: Middle East and Africa Angiography Devices Market Revenue Share (%), by Country 2024 & 2032
- Figure 102: Middle East and Africa Angiography Devices Market Volume Share (%), by Country 2024 & 2032
- Figure 103: South America Angiography Devices Market Revenue (Million), by Product 2024 & 2032
- Figure 104: South America Angiography Devices Market Volume (K Unit), by Product 2024 & 2032
- Figure 105: South America Angiography Devices Market Revenue Share (%), by Product 2024 & 2032
- Figure 106: South America Angiography Devices Market Volume Share (%), by Product 2024 & 2032
- Figure 107: South America Angiography Devices Market Revenue (Million), by Technology 2024 & 2032
- Figure 108: South America Angiography Devices Market Volume (K Unit), by Technology 2024 & 2032
- Figure 109: South America Angiography Devices Market Revenue Share (%), by Technology 2024 & 2032
- Figure 110: South America Angiography Devices Market Volume Share (%), by Technology 2024 & 2032
- Figure 111: South America Angiography Devices Market Revenue (Million), by Application 2024 & 2032
- Figure 112: South America Angiography Devices Market Volume (K Unit), by Application 2024 & 2032
- Figure 113: South America Angiography Devices Market Revenue Share (%), by Application 2024 & 2032
- Figure 114: South America Angiography Devices Market Volume Share (%), by Application 2024 & 2032
- Figure 115: South America Angiography Devices Market Revenue (Million), by End User 2024 & 2032
- Figure 116: South America Angiography Devices Market Volume (K Unit), by End User 2024 & 2032
- Figure 117: South America Angiography Devices Market Revenue Share (%), by End User 2024 & 2032
- Figure 118: South America Angiography Devices Market Volume Share (%), by End User 2024 & 2032
- Figure 119: South America Angiography Devices Market Revenue (Million), by Country 2024 & 2032
- Figure 120: South America Angiography Devices Market Volume (K Unit), by Country 2024 & 2032
- Figure 121: South America Angiography Devices Market Revenue Share (%), by Country 2024 & 2032
- Figure 122: South America Angiography Devices Market Volume Share (%), by Country 2024 & 2032
List of Tables
- Table 1: Global Angiography Devices Market Revenue Million Forecast, by Region 2019 & 2032
- Table 2: Global Angiography Devices Market Volume K Unit Forecast, by Region 2019 & 2032
- Table 3: Global Angiography Devices Market Revenue Million Forecast, by Product 2019 & 2032
- Table 4: Global Angiography Devices Market Volume K Unit Forecast, by Product 2019 & 2032
- Table 5: Global Angiography Devices Market Revenue Million Forecast, by Technology 2019 & 2032
- Table 6: Global Angiography Devices Market Volume K Unit Forecast, by Technology 2019 & 2032
- Table 7: Global Angiography Devices Market Revenue Million Forecast, by Application 2019 & 2032
- Table 8: Global Angiography Devices Market Volume K Unit Forecast, by Application 2019 & 2032
- Table 9: Global Angiography Devices Market Revenue Million Forecast, by End User 2019 & 2032
- Table 10: Global Angiography Devices Market Volume K Unit Forecast, by End User 2019 & 2032
- Table 11: Global Angiography Devices Market Revenue Million Forecast, by Region 2019 & 2032
- Table 12: Global Angiography Devices Market Volume K Unit Forecast, by Region 2019 & 2032
- Table 13: Global Angiography Devices Market Revenue Million Forecast, by Country 2019 & 2032
- Table 14: Global Angiography Devices Market Volume K Unit Forecast, by Country 2019 & 2032
- Table 15: United States Angiography Devices Market Revenue (Million) Forecast, by Application 2019 & 2032
- Table 16: United States Angiography Devices Market Volume (K Unit) Forecast, by Application 2019 & 2032
- Table 17: Canada Angiography Devices Market Revenue (Million) Forecast, by Application 2019 & 2032
- Table 18: Canada Angiography Devices Market Volume (K Unit) Forecast, by Application 2019 & 2032
- Table 19: Mexico Angiography Devices Market Revenue (Million) Forecast, by Application 2019 & 2032
- Table 20: Mexico Angiography Devices Market Volume (K Unit) Forecast, by Application 2019 & 2032
- Table 21: Global Angiography Devices Market Revenue Million Forecast, by Country 2019 & 2032
- Table 22: Global Angiography Devices Market Volume K Unit Forecast, by Country 2019 & 2032
- Table 23: Germany Angiography Devices Market Revenue (Million) Forecast, by Application 2019 & 2032
- Table 24: Germany Angiography Devices Market Volume (K Unit) Forecast, by Application 2019 & 2032
- Table 25: United Kingdom Angiography Devices Market Revenue (Million) Forecast, by Application 2019 & 2032
- Table 26: United Kingdom Angiography Devices Market Volume (K Unit) Forecast, by Application 2019 & 2032
- Table 27: France Angiography Devices Market Revenue (Million) Forecast, by Application 2019 & 2032
- Table 28: France Angiography Devices Market Volume (K Unit) Forecast, by Application 2019 & 2032
- Table 29: Italy Angiography Devices Market Revenue (Million) Forecast, by Application 2019 & 2032
- Table 30: Italy Angiography Devices Market Volume (K Unit) Forecast, by Application 2019 & 2032
- Table 31: Spain Angiography Devices Market Revenue (Million) Forecast, by Application 2019 & 2032
- Table 32: Spain Angiography Devices Market Volume (K Unit) Forecast, by Application 2019 & 2032
- Table 33: Rest of Europe Angiography Devices Market Revenue (Million) Forecast, by Application 2019 & 2032
- Table 34: Rest of Europe Angiography Devices Market Volume (K Unit) Forecast, by Application 2019 & 2032
- Table 35: Global Angiography Devices Market Revenue Million Forecast, by Country 2019 & 2032
- Table 36: Global Angiography Devices Market Volume K Unit Forecast, by Country 2019 & 2032
- Table 37: China Angiography Devices Market Revenue (Million) Forecast, by Application 2019 & 2032
- Table 38: China Angiography Devices Market Volume (K Unit) Forecast, by Application 2019 & 2032
- Table 39: Japan Angiography Devices Market Revenue (Million) Forecast, by Application 2019 & 2032
- Table 40: Japan Angiography Devices Market Volume (K Unit) Forecast, by Application 2019 & 2032
- Table 41: India Angiography Devices Market Revenue (Million) Forecast, by Application 2019 & 2032
- Table 42: India Angiography Devices Market Volume (K Unit) Forecast, by Application 2019 & 2032
- Table 43: Australia Angiography Devices Market Revenue (Million) Forecast, by Application 2019 & 2032
- Table 44: Australia Angiography Devices Market Volume (K Unit) Forecast, by Application 2019 & 2032
- Table 45: South Korea Angiography Devices Market Revenue (Million) Forecast, by Application 2019 & 2032
- Table 46: South Korea Angiography Devices Market Volume (K Unit) Forecast, by Application 2019 & 2032
- Table 47: Rest of Asia Pacific Angiography Devices Market Revenue (Million) Forecast, by Application 2019 & 2032
- Table 48: Rest of Asia Pacific Angiography Devices Market Volume (K Unit) Forecast, by Application 2019 & 2032
- Table 49: Global Angiography Devices Market Revenue Million Forecast, by Country 2019 & 2032
- Table 50: Global Angiography Devices Market Volume K Unit Forecast, by Country 2019 & 2032
- Table 51: GCC Angiography Devices Market Revenue (Million) Forecast, by Application 2019 & 2032
- Table 52: GCC Angiography Devices Market Volume (K Unit) Forecast, by Application 2019 & 2032
- Table 53: South Africa Angiography Devices Market Revenue (Million) Forecast, by Application 2019 & 2032
- Table 54: South Africa Angiography Devices Market Volume (K Unit) Forecast, by Application 2019 & 2032
- Table 55: Rest of Middle East and Africa Angiography Devices Market Revenue (Million) Forecast, by Application 2019 & 2032
- Table 56: Rest of Middle East and Africa Angiography Devices Market Volume (K Unit) Forecast, by Application 2019 & 2032
- Table 57: Global Angiography Devices Market Revenue Million Forecast, by Country 2019 & 2032
- Table 58: Global Angiography Devices Market Volume K Unit Forecast, by Country 2019 & 2032
- Table 59: Brazil Angiography Devices Market Revenue (Million) Forecast, by Application 2019 & 2032
- Table 60: Brazil Angiography Devices Market Volume (K Unit) Forecast, by Application 2019 & 2032
- Table 61: Argentina Angiography Devices Market Revenue (Million) Forecast, by Application 2019 & 2032
- Table 62: Argentina Angiography Devices Market Volume (K Unit) Forecast, by Application 2019 & 2032
- Table 63: Rest of South America Angiography Devices Market Revenue (Million) Forecast, by Application 2019 & 2032
- Table 64: Rest of South America Angiography Devices Market Volume (K Unit) Forecast, by Application 2019 & 2032
- Table 65: Global Angiography Devices Market Revenue Million Forecast, by Product 2019 & 2032
- Table 66: Global Angiography Devices Market Volume K Unit Forecast, by Product 2019 & 2032
- Table 67: Global Angiography Devices Market Revenue Million Forecast, by Technology 2019 & 2032
- Table 68: Global Angiography Devices Market Volume K Unit Forecast, by Technology 2019 & 2032
- Table 69: Global Angiography Devices Market Revenue Million Forecast, by Application 2019 & 2032
- Table 70: Global Angiography Devices Market Volume K Unit Forecast, by Application 2019 & 2032
- Table 71: Global Angiography Devices Market Revenue Million Forecast, by End User 2019 & 2032
- Table 72: Global Angiography Devices Market Volume K Unit Forecast, by End User 2019 & 2032
- Table 73: Global Angiography Devices Market Revenue Million Forecast, by Country 2019 & 2032
- Table 74: Global Angiography Devices Market Volume K Unit Forecast, by Country 2019 & 2032
- Table 75: United States Angiography Devices Market Revenue (Million) Forecast, by Application 2019 & 2032
- Table 76: United States Angiography Devices Market Volume (K Unit) Forecast, by Application 2019 & 2032
- Table 77: Canada Angiography Devices Market Revenue (Million) Forecast, by Application 2019 & 2032
- Table 78: Canada Angiography Devices Market Volume (K Unit) Forecast, by Application 2019 & 2032
- Table 79: Mexico Angiography Devices Market Revenue (Million) Forecast, by Application 2019 & 2032
- Table 80: Mexico Angiography Devices Market Volume (K Unit) Forecast, by Application 2019 & 2032
- Table 81: Global Angiography Devices Market Revenue Million Forecast, by Product 2019 & 2032
- Table 82: Global Angiography Devices Market Volume K Unit Forecast, by Product 2019 & 2032
- Table 83: Global Angiography Devices Market Revenue Million Forecast, by Technology 2019 & 2032
- Table 84: Global Angiography Devices Market Volume K Unit Forecast, by Technology 2019 & 2032
- Table 85: Global Angiography Devices Market Revenue Million Forecast, by Application 2019 & 2032
- Table 86: Global Angiography Devices Market Volume K Unit Forecast, by Application 2019 & 2032
- Table 87: Global Angiography Devices Market Revenue Million Forecast, by End User 2019 & 2032
- Table 88: Global Angiography Devices Market Volume K Unit Forecast, by End User 2019 & 2032
- Table 89: Global Angiography Devices Market Revenue Million Forecast, by Country 2019 & 2032
- Table 90: Global Angiography Devices Market Volume K Unit Forecast, by Country 2019 & 2032
- Table 91: Germany Angiography Devices Market Revenue (Million) Forecast, by Application 2019 & 2032
- Table 92: Germany Angiography Devices Market Volume (K Unit) Forecast, by Application 2019 & 2032
- Table 93: United Kingdom Angiography Devices Market Revenue (Million) Forecast, by Application 2019 & 2032
- Table 94: United Kingdom Angiography Devices Market Volume (K Unit) Forecast, by Application 2019 & 2032
- Table 95: France Angiography Devices Market Revenue (Million) Forecast, by Application 2019 & 2032
- Table 96: France Angiography Devices Market Volume (K Unit) Forecast, by Application 2019 & 2032
- Table 97: Italy Angiography Devices Market Revenue (Million) Forecast, by Application 2019 & 2032
- Table 98: Italy Angiography Devices Market Volume (K Unit) Forecast, by Application 2019 & 2032
- Table 99: Spain Angiography Devices Market Revenue (Million) Forecast, by Application 2019 & 2032
- Table 100: Spain Angiography Devices Market Volume (K Unit) Forecast, by Application 2019 & 2032
- Table 101: Rest of Europe Angiography Devices Market Revenue (Million) Forecast, by Application 2019 & 2032
- Table 102: Rest of Europe Angiography Devices Market Volume (K Unit) Forecast, by Application 2019 & 2032
- Table 103: Global Angiography Devices Market Revenue Million Forecast, by Product 2019 & 2032
- Table 104: Global Angiography Devices Market Volume K Unit Forecast, by Product 2019 & 2032
- Table 105: Global Angiography Devices Market Revenue Million Forecast, by Technology 2019 & 2032
- Table 106: Global Angiography Devices Market Volume K Unit Forecast, by Technology 2019 & 2032
- Table 107: Global Angiography Devices Market Revenue Million Forecast, by Application 2019 & 2032
- Table 108: Global Angiography Devices Market Volume K Unit Forecast, by Application 2019 & 2032
- Table 109: Global Angiography Devices Market Revenue Million Forecast, by End User 2019 & 2032
- Table 110: Global Angiography Devices Market Volume K Unit Forecast, by End User 2019 & 2032
- Table 111: Global Angiography Devices Market Revenue Million Forecast, by Country 2019 & 2032
- Table 112: Global Angiography Devices Market Volume K Unit Forecast, by Country 2019 & 2032
- Table 113: China Angiography Devices Market Revenue (Million) Forecast, by Application 2019 & 2032
- Table 114: China Angiography Devices Market Volume (K Unit) Forecast, by Application 2019 & 2032
- Table 115: Japan Angiography Devices Market Revenue (Million) Forecast, by Application 2019 & 2032
- Table 116: Japan Angiography Devices Market Volume (K Unit) Forecast, by Application 2019 & 2032
- Table 117: India Angiography Devices Market Revenue (Million) Forecast, by Application 2019 & 2032
- Table 118: India Angiography Devices Market Volume (K Unit) Forecast, by Application 2019 & 2032
- Table 119: Australia Angiography Devices Market Revenue (Million) Forecast, by Application 2019 & 2032
- Table 120: Australia Angiography Devices Market Volume (K Unit) Forecast, by Application 2019 & 2032
- Table 121: South Korea Angiography Devices Market Revenue (Million) Forecast, by Application 2019 & 2032
- Table 122: South Korea Angiography Devices Market Volume (K Unit) Forecast, by Application 2019 & 2032
- Table 123: Rest of Asia Pacific Angiography Devices Market Revenue (Million) Forecast, by Application 2019 & 2032
- Table 124: Rest of Asia Pacific Angiography Devices Market Volume (K Unit) Forecast, by Application 2019 & 2032
- Table 125: Global Angiography Devices Market Revenue Million Forecast, by Product 2019 & 2032
- Table 126: Global Angiography Devices Market Volume K Unit Forecast, by Product 2019 & 2032
- Table 127: Global Angiography Devices Market Revenue Million Forecast, by Technology 2019 & 2032
- Table 128: Global Angiography Devices Market Volume K Unit Forecast, by Technology 2019 & 2032
- Table 129: Global Angiography Devices Market Revenue Million Forecast, by Application 2019 & 2032
- Table 130: Global Angiography Devices Market Volume K Unit Forecast, by Application 2019 & 2032
- Table 131: Global Angiography Devices Market Revenue Million Forecast, by End User 2019 & 2032
- Table 132: Global Angiography Devices Market Volume K Unit Forecast, by End User 2019 & 2032
- Table 133: Global Angiography Devices Market Revenue Million Forecast, by Country 2019 & 2032
- Table 134: Global Angiography Devices Market Volume K Unit Forecast, by Country 2019 & 2032
- Table 135: GCC Angiography Devices Market Revenue (Million) Forecast, by Application 2019 & 2032
- Table 136: GCC Angiography Devices Market Volume (K Unit) Forecast, by Application 2019 & 2032
- Table 137: South Africa Angiography Devices Market Revenue (Million) Forecast, by Application 2019 & 2032
- Table 138: South Africa Angiography Devices Market Volume (K Unit) Forecast, by Application 2019 & 2032
- Table 139: Rest of Middle East and Africa Angiography Devices Market Revenue (Million) Forecast, by Application 2019 & 2032
- Table 140: Rest of Middle East and Africa Angiography Devices Market Volume (K Unit) Forecast, by Application 2019 & 2032
- Table 141: Global Angiography Devices Market Revenue Million Forecast, by Product 2019 & 2032
- Table 142: Global Angiography Devices Market Volume K Unit Forecast, by Product 2019 & 2032
- Table 143: Global Angiography Devices Market Revenue Million Forecast, by Technology 2019 & 2032
- Table 144: Global Angiography Devices Market Volume K Unit Forecast, by Technology 2019 & 2032
- Table 145: Global Angiography Devices Market Revenue Million Forecast, by Application 2019 & 2032
- Table 146: Global Angiography Devices Market Volume K Unit Forecast, by Application 2019 & 2032
- Table 147: Global Angiography Devices Market Revenue Million Forecast, by End User 2019 & 2032
- Table 148: Global Angiography Devices Market Volume K Unit Forecast, by End User 2019 & 2032
- Table 149: Global Angiography Devices Market Revenue Million Forecast, by Country 2019 & 2032
- Table 150: Global Angiography Devices Market Volume K Unit Forecast, by Country 2019 & 2032
- Table 151: Brazil Angiography Devices Market Revenue (Million) Forecast, by Application 2019 & 2032
- Table 152: Brazil Angiography Devices Market Volume (K Unit) Forecast, by Application 2019 & 2032
- Table 153: Argentina Angiography Devices Market Revenue (Million) Forecast, by Application 2019 & 2032
- Table 154: Argentina Angiography Devices Market Volume (K Unit) Forecast, by Application 2019 & 2032
- Table 155: Rest of South America Angiography Devices Market Revenue (Million) Forecast, by Application 2019 & 2032
- Table 156: Rest of South America Angiography Devices Market Volume (K Unit) Forecast, by Application 2019 & 2032
Frequently Asked Questions
1. What is the projected Compound Annual Growth Rate (CAGR) of the Angiography Devices Market?
The projected CAGR is approximately 4.70%.
2. Which companies are prominent players in the Angiography Devices Market?
Key companies in the market include Terumo Corporation*List Not Exhaustive, GE Healthcare, AngioDynamics Inc, Abbott Laboratories, Cardinal Health Inc, Siemens Healthineers AG, Medtronic PLC, Koninklijke Philips NV, Boston Scientific Corporation, Shimadzu Corporation.
3. What are the main segments of the Angiography Devices Market?
The market segments include Product, Technology, Application, End User.
4. Can you provide details about the market size?
The market size is estimated to be USD XX Million as of 2022.
5. What are some drivers contributing to market growth?
; Rising Geriatric Population and Increasing Prevalence of Cardiovascular Diseases; Growing Demand for Interventional Angiography in Minimally Invasive Surgeries.
6. What are the notable trends driving market growth?
The Hospital Segment is Expected to Dominate the Market During the Forecast Period.
7. Are there any restraints impacting market growth?
; High Procedure and Equipment Cost; Risks Associated with Angiography Procedures.
8. Can you provide examples of recent developments in the market?
N/A
9. What pricing options are available for accessing the report?
Pricing options include single-user, multi-user, and enterprise licenses priced at USD 4750, USD 5250, and USD 8750 respectively.
10. Is the market size provided in terms of value or volume?
The market size is provided in terms of value, measured in Million and volume, measured in K Unit.
11. Are there any specific market keywords associated with the report?
Yes, the market keyword associated with the report is "Angiography Devices Market," which aids in identifying and referencing the specific market segment covered.
12. How do I determine which pricing option suits my needs best?
The pricing options vary based on user requirements and access needs. Individual users may opt for single-user licenses, while businesses requiring broader access may choose multi-user or enterprise licenses for cost-effective access to the report.
13. Are there any additional resources or data provided in the Angiography Devices Market report?
While the report offers comprehensive insights, it's advisable to review the specific contents or supplementary materials provided to ascertain if additional resources or data are available.
14. How can I stay updated on further developments or reports in the Angiography Devices Market?
To stay informed about further developments, trends, and reports in the Angiography Devices Market, consider subscribing to industry newsletters, following relevant companies and organizations, or regularly checking reputable industry news sources and publications.
Methodology
Step 1 - Identification of Relevant Samples Size from Population Database


Step 2 - Approaches for Defining Global Market Size (Value, Volume* & Price*)

Note*: In applicable scenarios
Step 3 - Data Sources
Primary Research
- Web Analytics
- Survey Reports
- Research Institute
- Latest Research Reports
- Opinion Leaders
Secondary Research
- Annual Reports
- White Paper
- Latest Press Release
- Industry Association
- Paid Database
- Investor Presentations

Step 4 - Data Triangulation
Involves using different sources of information in order to increase the validity of a study
These sources are likely to be stakeholders in a program - participants, other researchers, program staff, other community members, and so on.
Then we put all data in single framework & apply various statistical tools to find out the dynamic on the market.
During the analysis stage, feedback from the stakeholder groups would be compared to determine areas of agreement as well as areas of divergence


