
Key Insights
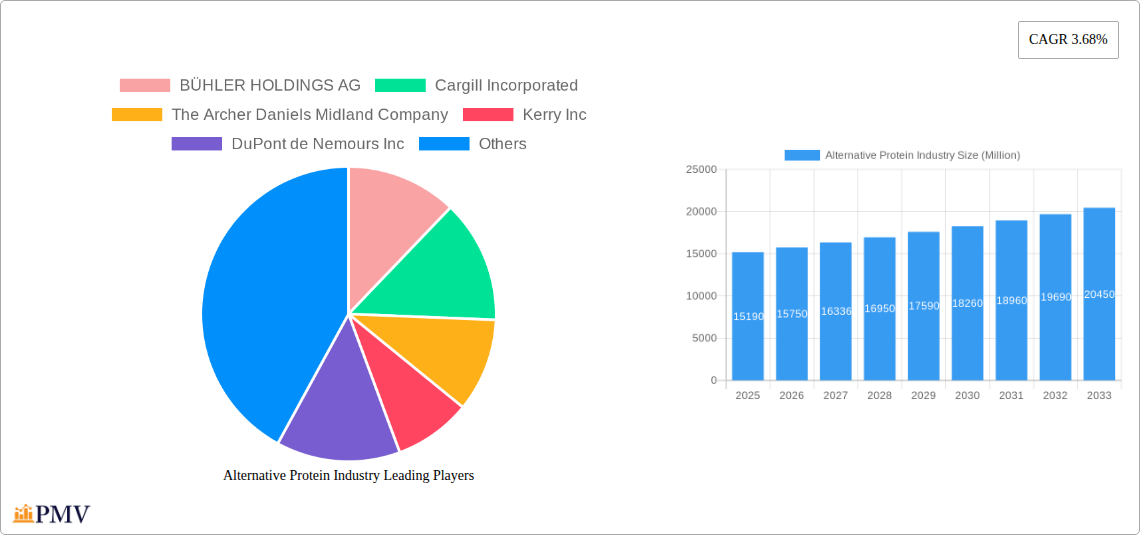
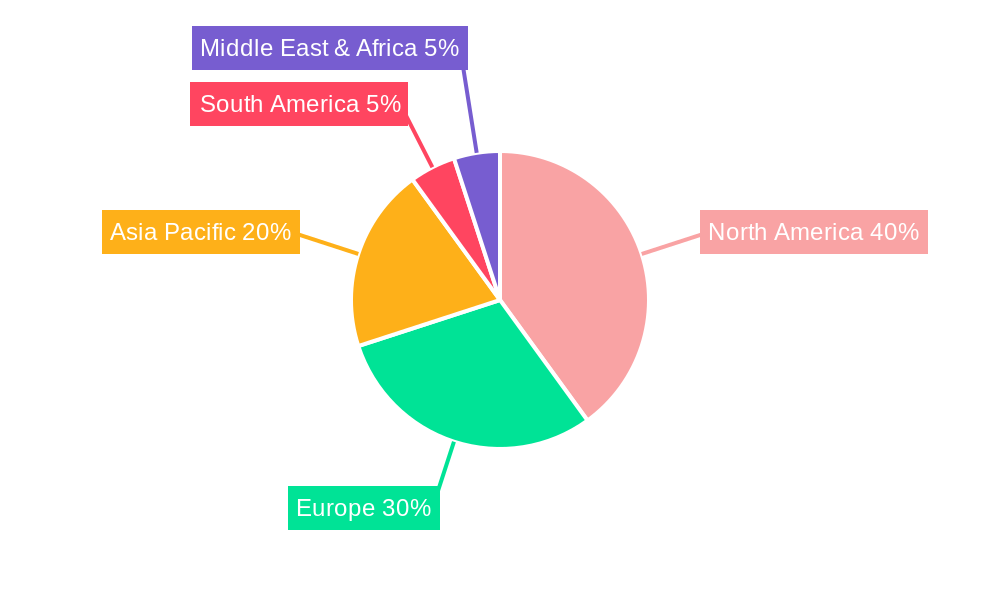
The alternative protein industry, valued at $15.19 billion in 2025, is experiencing robust growth, projected to expand at a compound annual growth rate (CAGR) of 3.68% from 2025 to 2033. This expansion is driven by several key factors. Increasing consumer awareness of the environmental impact of traditional animal agriculture, coupled with growing health consciousness and the rising demand for sustainable and ethical food choices, are significant catalysts. Furthermore, advancements in food technology are continuously improving the taste, texture, and nutritional profile of alternative protein products, making them increasingly appealing to a broader consumer base. The market segmentation reveals strong growth across various sources (food, beverage, and animal feed industries) and applications (plant-based meat, dairy, and egg alternatives). North America and Europe currently hold significant market share, but the Asia-Pacific region is poised for substantial growth due to its burgeoning population and rising disposable incomes. The presence of established players like Bühler Holdings AG, Cargill Incorporated, and Archer Daniels Midland Company, alongside emerging innovative companies, indicates a highly competitive yet dynamic market landscape. The industry faces challenges including consumer perception, ingredient sourcing sustainability, and regulatory hurdles, but ongoing technological innovation and increasing consumer demand will likely mitigate these challenges.
The continued expansion of the alternative protein market is anticipated to be fueled by several long-term trends. Growing investment in research and development is leading to the development of novel protein sources and improved production processes, enhancing scalability and cost-effectiveness. The increasing integration of alternative proteins into mainstream food products and menus is further widening market reach and acceptance. Government initiatives and policies promoting sustainable food systems are creating a favorable regulatory environment. While the market faces challenges concerning production costs and ensuring consistent product quality, the long-term outlook remains positive, driven by the convergence of environmental concerns, health-conscious consumer trends, and technological advancements. This is set to transform the food industry significantly in the coming decade.
Alternative Protein Industry: A Comprehensive Market Report (2019-2033)
This in-depth report provides a comprehensive analysis of the alternative protein industry, encompassing market size, growth drivers, competitive landscape, and future outlook. The study period covers 2019-2033, with 2025 as the base and estimated year. This report is essential for investors, industry players, and researchers seeking actionable insights into this rapidly evolving market projected to reach xx Million by 2033.
Alternative Protein Industry Market Structure & Competitive Dynamics
The alternative protein industry is characterized by a dynamic competitive landscape with both established players and emerging startups vying for market share. Market concentration is moderate, with several large multinational corporations dominating specific segments. However, the increasing number of innovative startups is fostering intense competition and driving innovation. Key aspects of the market structure include:
- Market Concentration: The market is moderately concentrated, with the top 10 players accounting for approximately xx% of the global market share in 2024.
- Innovation Ecosystems: Significant investments in R&D are driving rapid innovation in alternative protein technologies, particularly in plant-based meat alternatives. Collaboration between established food companies and innovative startups is also a significant trend.
- Regulatory Frameworks: Varying regulatory landscapes across different countries impact market entry and product development. Harmonization of regulations is crucial for fostering global growth.
- Product Substitutes: Traditional protein sources (meat, dairy, eggs) pose significant competition. However, the growing consumer preference for sustainable and healthier alternatives is driving market expansion.
- End-User Trends: Increasing consumer awareness of health and environmental concerns is fueling the demand for alternative proteins. This shift in consumer preference is a key driver of market growth.
- M&A Activities: The industry has witnessed significant mergers and acquisitions (M&A) activity in recent years. For example, ADM's acquisition of Sojaprotein in 2021 demonstrates the strategic importance of consolidating market share and access to key technologies and supply chains. The total value of M&A deals in the alternative protein industry during the historical period (2019-2024) is estimated at xx Million.
Alternative Protein Industry Industry Trends & Insights
The alternative protein industry is experiencing exponential growth driven by several converging trends. The Compound Annual Growth Rate (CAGR) during the forecast period (2025-2033) is projected to be xx%, significantly higher than the CAGR observed during the historical period (2019-2024) which stood at xx%. Market penetration of alternative protein products is increasing steadily across various segments, particularly in developed economies. Key trends include:
- Market Growth Drivers: Growing consumer demand for sustainable and ethical food choices, increasing health awareness, and technological advancements are primary growth drivers.
- Technological Disruptions: Innovations in fermentation technology, precision fermentation, and cell-based agriculture are revolutionizing the production of alternative proteins.
- Consumer Preferences: Consumers are increasingly seeking plant-based, allergen-free, and sustainably produced protein options. Demand for convenience and taste also plays a significant role.
- Competitive Dynamics: Intense competition is driving innovation and price reductions, benefiting consumers and increasing market penetration. The emergence of numerous startups is also intensifying the competition.
Dominant Markets & Segments in Alternative Protein Industry
The alternative protein industry displays regional disparities in growth and adoption. While North America and Europe are currently leading markets, Asia-Pacific is projected to witness rapid expansion during the forecast period. Within segments:
- By Source: The plant-based segment dominates the market, followed by fermentation-derived and cell-based alternatives. Plant-based protein sources like soy, pea, and rice are currently the most prevalent, driven by lower production costs and established supply chains.
- By Application: Plant-based meat alternatives are currently the largest segment, followed by dairy and egg alternatives. The plant-based meat market is further segmented into burgers, sausages, and other meat analogs. Dairy alternatives, including milk and yogurt, are growing rapidly, fueled by the increasing demand for lactose-free options.
Key Drivers for Dominant Regions:
- North America: High consumer awareness of health and sustainability, coupled with strong regulatory support and robust innovation ecosystems.
- Europe: Growing consumer interest in plant-based diets and increasing government initiatives promoting sustainable food systems.
- Asia-Pacific: Rapidly growing population and rising disposable incomes, leading to increased demand for protein-rich foods.
Alternative Protein Industry Product Innovations
Recent years have witnessed significant innovation in alternative protein products. Technological advancements, such as precision fermentation and cell-based technologies, are enabling the production of protein with improved texture, taste, and nutritional value, thus addressing some of the limitations of earlier generation products. These innovations are not only improving the quality of alternative protein products but also expanding their applicability across various food and beverage applications. The increasing availability of tailored ingredients tailored for various applications are enabling cost-effective and efficient mass production.
Report Segmentation & Scope
This report segments the alternative protein market by:
By Source: Plant-based (soy, pea, rice, etc.), Fermentation-derived (single-cell proteins, fungal proteins), Cell-based (cultivated meat, dairy, eggs). Each segment exhibits distinct growth trajectories and competitive dynamics, influenced by factors such as technology maturity, production costs, and consumer acceptance.
By Application: Plant-based meat (burgers, sausages, etc.), Dairy alternatives (milk, yogurt, cheese), Egg alternatives (omelets, egg whites). These segments are further analyzed based on product type, geographic distribution, and consumer demand. The growth of each application segment is driven by distinct consumer needs and trends.
Key Drivers of Alternative Protein Industry Growth
The alternative protein industry's growth is driven by several key factors:
- Technological Advancements: Innovations in fermentation, cell-based cultivation, and protein engineering are improving product quality and reducing production costs.
- Environmental Concerns: Growing awareness of the environmental impact of conventional meat production is driving consumer demand for sustainable alternatives.
- Health and Wellness: Increasing consumer interest in plant-based diets and reduced meat consumption for health benefits is fueling demand.
- Regulatory Support: Government initiatives promoting sustainable agriculture and alternative protein technologies are creating a favorable environment for growth.
Challenges in the Alternative Protein Industry Sector
Despite the significant growth potential, the alternative protein industry faces several challenges:
- Regulatory Hurdles: Varying regulations across different regions create complexity for market entry and product development. The lack of standardized regulations for novel food products remains a significant barrier to wider market adoption.
- Supply Chain Issues: Scaling up production to meet growing demand requires significant investment in infrastructure and efficient supply chains. Securing reliable and sustainable sourcing of raw materials is also a challenge.
- Competitive Pressures: The increasing number of players, including established food companies and innovative startups, creates intense competition, impacting pricing and profitability. The cost of production remains relatively high compared to traditional protein sources for some alternative products.
Leading Players in the Alternative Protein Industry Market
- BÜHLER HOLDINGS AG
- Cargill Incorporated
- The Archer Daniels Midland Company
- Kerry Inc
- DuPont de Nemours Inc
- Glanbia PLC
- Roquette Freres
- Royal Avebe UA
- Ingredion Incorporated
- Corbion NV
Key Developments in Alternative Protein Industry Sector
- 2021: ADM announced the acquisition of Sojaprotein, strengthening its position in the non-GMO soy ingredient market.
- 2020: Kerry launched 13 new plant-based, allergen-free protein options, expanding its product portfolio and addressing growing consumer demand.
- 2020: Cargill expanded its pea protein product line (RadiPure and Puris) into European markets, increasing its global reach.
Strategic Alternative Protein Industry Market Outlook
The future of the alternative protein industry is exceptionally bright. Continued innovation, increasing consumer demand, and favorable regulatory environments will drive substantial market growth in the coming years. Strategic opportunities exist for companies focusing on product differentiation, sustainable sourcing, and efficient supply chain management. The industry is poised for significant expansion across various regions, driven by evolving consumer preferences and a growing awareness of the environmental and health benefits of alternative proteins. The potential for disruptive technologies like cell-based meat and precision fermentation to reshape the industry in the coming years is considerable.
Alternative Protein Industry Segmentation
-
1. Source
-
1.1. Plant Protein
- 1.1.1. Soy Protein
- 1.1.2. Wheat Protein
- 1.1.3. Pea Protein
- 1.1.4. Other Plant Proteins
- 1.2. Mycoprotein
- 1.3. Algal protein
- 1.4. Insect Protein
-
1.1. Plant Protein
-
2. Application
-
2.1. Food and Beverage
- 2.1.1. Bakery
- 2.1.2. Confectionery
- 2.1.3. Plant-Based Dairy Products
- 2.1.4. Beverages
- 2.1.5. Other Food and Beverages
- 2.2. Dietary Supplements
- 2.3. Animal Feed and Pet Food
- 2.4. Personal Care and Cosmetics
-
2.1. Food and Beverage
Alternative Protein Industry Segmentation By Geography
-
1. North America
- 1.1. United States
- 1.2. Canada
- 1.3. Mexico
- 1.4. Rest of North America
-
2. Europe
- 2.1. Spain
- 2.2. United Kingdom
- 2.3. Germany
- 2.4. France
- 2.5. Italy
- 2.6. Russia
- 2.7. Rest of Europe
-
3. Asia Pacific
- 3.1. China
- 3.2. Japan
- 3.3. India
- 3.4. Australia
- 3.5. Rest of Asia Pacific
-
4. South America
- 4.1. Brazil
- 4.2. Argentina
- 4.3. Rest of South America
-
5. Middle East and Africa
- 5.1. South Africa
- 5.2. Saudi Arabia
- 5.3. Rest of Middle East and Africa
Alternative Protein Industry REPORT HIGHLIGHTS
| Aspects | Details |
|---|---|
| Study Period | 2019-2033 |
| Base Year | 2024 |
| Estimated Year | 2025 |
| Forecast Period | 2025-2033 |
| Historical Period | 2019-2024 |
| Growth Rate | CAGR of 3.68% from 2019-2033 |
| Segmentation |
|
Table of Contents
- 1. Introduction
- 1.1. Research Scope
- 1.2. Market Segmentation
- 1.3. Research Methodology
- 1.4. Definitions and Assumptions
- 2. Executive Summary
- 2.1. Introduction
- 3. Market Dynamics
- 3.1. Introduction
- 3.2. Market Drivers
- 3.2.1. Increasing Demand for Vegan Food & Beverages Driving the Market; Intolerance and Allergies Associated with Animal Protein Products
- 3.3. Market Restrains
- 3.3.1. High Market Penetration of Animal Protein
- 3.4. Market Trends
- 3.4.1. Growing Preference For Plant-Based Protein Products
- 4. Market Factor Analysis
- 4.1. Porters Five Forces
- 4.2. Supply/Value Chain
- 4.3. PESTEL analysis
- 4.4. Market Entropy
- 4.5. Patent/Trademark Analysis
- 5. Global Alternative Protein Industry Analysis, Insights and Forecast, 2019-2031
- 5.1. Market Analysis, Insights and Forecast - by Source
- 5.1.1. Plant Protein
- 5.1.1.1. Soy Protein
- 5.1.1.2. Wheat Protein
- 5.1.1.3. Pea Protein
- 5.1.1.4. Other Plant Proteins
- 5.1.2. Mycoprotein
- 5.1.3. Algal protein
- 5.1.4. Insect Protein
- 5.1.1. Plant Protein
- 5.2. Market Analysis, Insights and Forecast - by Application
- 5.2.1. Food and Beverage
- 5.2.1.1. Bakery
- 5.2.1.2. Confectionery
- 5.2.1.3. Plant-Based Dairy Products
- 5.2.1.4. Beverages
- 5.2.1.5. Other Food and Beverages
- 5.2.2. Dietary Supplements
- 5.2.3. Animal Feed and Pet Food
- 5.2.4. Personal Care and Cosmetics
- 5.2.1. Food and Beverage
- 5.3. Market Analysis, Insights and Forecast - by Region
- 5.3.1. North America
- 5.3.2. Europe
- 5.3.3. Asia Pacific
- 5.3.4. South America
- 5.3.5. Middle East and Africa
- 5.1. Market Analysis, Insights and Forecast - by Source
- 6. North America Alternative Protein Industry Analysis, Insights and Forecast, 2019-2031
- 6.1. Market Analysis, Insights and Forecast - by Source
- 6.1.1. Plant Protein
- 6.1.1.1. Soy Protein
- 6.1.1.2. Wheat Protein
- 6.1.1.3. Pea Protein
- 6.1.1.4. Other Plant Proteins
- 6.1.2. Mycoprotein
- 6.1.3. Algal protein
- 6.1.4. Insect Protein
- 6.1.1. Plant Protein
- 6.2. Market Analysis, Insights and Forecast - by Application
- 6.2.1. Food and Beverage
- 6.2.1.1. Bakery
- 6.2.1.2. Confectionery
- 6.2.1.3. Plant-Based Dairy Products
- 6.2.1.4. Beverages
- 6.2.1.5. Other Food and Beverages
- 6.2.2. Dietary Supplements
- 6.2.3. Animal Feed and Pet Food
- 6.2.4. Personal Care and Cosmetics
- 6.2.1. Food and Beverage
- 6.1. Market Analysis, Insights and Forecast - by Source
- 7. Europe Alternative Protein Industry Analysis, Insights and Forecast, 2019-2031
- 7.1. Market Analysis, Insights and Forecast - by Source
- 7.1.1. Plant Protein
- 7.1.1.1. Soy Protein
- 7.1.1.2. Wheat Protein
- 7.1.1.3. Pea Protein
- 7.1.1.4. Other Plant Proteins
- 7.1.2. Mycoprotein
- 7.1.3. Algal protein
- 7.1.4. Insect Protein
- 7.1.1. Plant Protein
- 7.2. Market Analysis, Insights and Forecast - by Application
- 7.2.1. Food and Beverage
- 7.2.1.1. Bakery
- 7.2.1.2. Confectionery
- 7.2.1.3. Plant-Based Dairy Products
- 7.2.1.4. Beverages
- 7.2.1.5. Other Food and Beverages
- 7.2.2. Dietary Supplements
- 7.2.3. Animal Feed and Pet Food
- 7.2.4. Personal Care and Cosmetics
- 7.2.1. Food and Beverage
- 7.1. Market Analysis, Insights and Forecast - by Source
- 8. Asia Pacific Alternative Protein Industry Analysis, Insights and Forecast, 2019-2031
- 8.1. Market Analysis, Insights and Forecast - by Source
- 8.1.1. Plant Protein
- 8.1.1.1. Soy Protein
- 8.1.1.2. Wheat Protein
- 8.1.1.3. Pea Protein
- 8.1.1.4. Other Plant Proteins
- 8.1.2. Mycoprotein
- 8.1.3. Algal protein
- 8.1.4. Insect Protein
- 8.1.1. Plant Protein
- 8.2. Market Analysis, Insights and Forecast - by Application
- 8.2.1. Food and Beverage
- 8.2.1.1. Bakery
- 8.2.1.2. Confectionery
- 8.2.1.3. Plant-Based Dairy Products
- 8.2.1.4. Beverages
- 8.2.1.5. Other Food and Beverages
- 8.2.2. Dietary Supplements
- 8.2.3. Animal Feed and Pet Food
- 8.2.4. Personal Care and Cosmetics
- 8.2.1. Food and Beverage
- 8.1. Market Analysis, Insights and Forecast - by Source
- 9. South America Alternative Protein Industry Analysis, Insights and Forecast, 2019-2031
- 9.1. Market Analysis, Insights and Forecast - by Source
- 9.1.1. Plant Protein
- 9.1.1.1. Soy Protein
- 9.1.1.2. Wheat Protein
- 9.1.1.3. Pea Protein
- 9.1.1.4. Other Plant Proteins
- 9.1.2. Mycoprotein
- 9.1.3. Algal protein
- 9.1.4. Insect Protein
- 9.1.1. Plant Protein
- 9.2. Market Analysis, Insights and Forecast - by Application
- 9.2.1. Food and Beverage
- 9.2.1.1. Bakery
- 9.2.1.2. Confectionery
- 9.2.1.3. Plant-Based Dairy Products
- 9.2.1.4. Beverages
- 9.2.1.5. Other Food and Beverages
- 9.2.2. Dietary Supplements
- 9.2.3. Animal Feed and Pet Food
- 9.2.4. Personal Care and Cosmetics
- 9.2.1. Food and Beverage
- 9.1. Market Analysis, Insights and Forecast - by Source
- 10. Middle East and Africa Alternative Protein Industry Analysis, Insights and Forecast, 2019-2031
- 10.1. Market Analysis, Insights and Forecast - by Source
- 10.1.1. Plant Protein
- 10.1.1.1. Soy Protein
- 10.1.1.2. Wheat Protein
- 10.1.1.3. Pea Protein
- 10.1.1.4. Other Plant Proteins
- 10.1.2. Mycoprotein
- 10.1.3. Algal protein
- 10.1.4. Insect Protein
- 10.1.1. Plant Protein
- 10.2. Market Analysis, Insights and Forecast - by Application
- 10.2.1. Food and Beverage
- 10.2.1.1. Bakery
- 10.2.1.2. Confectionery
- 10.2.1.3. Plant-Based Dairy Products
- 10.2.1.4. Beverages
- 10.2.1.5. Other Food and Beverages
- 10.2.2. Dietary Supplements
- 10.2.3. Animal Feed and Pet Food
- 10.2.4. Personal Care and Cosmetics
- 10.2.1. Food and Beverage
- 10.1. Market Analysis, Insights and Forecast - by Source
- 11. North America Alternative Protein Industry Analysis, Insights and Forecast, 2019-2031
- 11.1. Market Analysis, Insights and Forecast - By Country/Sub-region
- 11.1.1 United States
- 11.1.2 Canada
- 11.1.3 Mexico
- 11.1.4 Rest of North America
- 12. Europe Alternative Protein Industry Analysis, Insights and Forecast, 2019-2031
- 12.1. Market Analysis, Insights and Forecast - By Country/Sub-region
- 12.1.1 Spain
- 12.1.2 United Kingdom
- 12.1.3 Germany
- 12.1.4 France
- 12.1.5 Italy
- 12.1.6 Russia
- 12.1.7 Rest of Europe
- 13. Asia Pacific Alternative Protein Industry Analysis, Insights and Forecast, 2019-2031
- 13.1. Market Analysis, Insights and Forecast - By Country/Sub-region
- 13.1.1 China
- 13.1.2 Japan
- 13.1.3 India
- 13.1.4 Australia
- 13.1.5 Rest of Asia Pacific
- 14. South America Alternative Protein Industry Analysis, Insights and Forecast, 2019-2031
- 14.1. Market Analysis, Insights and Forecast - By Country/Sub-region
- 14.1.1 Brazil
- 14.1.2 Argentina
- 14.1.3 Rest of South America
- 15. Middle East & Africa Alternative Protein Industry Analysis, Insights and Forecast, 2019-2031
- 15.1. Market Analysis, Insights and Forecast - By Country/Sub-region
- 15.1.1 UAE
- 15.1.2 South Africa
- 15.1.3 Saudi Arabia
- 15.1.4 Rest of MEA
- 16. Competitive Analysis
- 16.1. Global Market Share Analysis 2024
- 16.2. Company Profiles
- 16.2.1 BÜHLER HOLDINGS AG
- 16.2.1.1. Overview
- 16.2.1.2. Products
- 16.2.1.3. SWOT Analysis
- 16.2.1.4. Recent Developments
- 16.2.1.5. Financials (Based on Availability)
- 16.2.2 Cargill Incorporated
- 16.2.2.1. Overview
- 16.2.2.2. Products
- 16.2.2.3. SWOT Analysis
- 16.2.2.4. Recent Developments
- 16.2.2.5. Financials (Based on Availability)
- 16.2.3 The Archer Daniels Midland Company
- 16.2.3.1. Overview
- 16.2.3.2. Products
- 16.2.3.3. SWOT Analysis
- 16.2.3.4. Recent Developments
- 16.2.3.5. Financials (Based on Availability)
- 16.2.4 Kerry Inc
- 16.2.4.1. Overview
- 16.2.4.2. Products
- 16.2.4.3. SWOT Analysis
- 16.2.4.4. Recent Developments
- 16.2.4.5. Financials (Based on Availability)
- 16.2.5 DuPont de Nemours Inc
- 16.2.5.1. Overview
- 16.2.5.2. Products
- 16.2.5.3. SWOT Analysis
- 16.2.5.4. Recent Developments
- 16.2.5.5. Financials (Based on Availability)
- 16.2.6 Glanbia PLC
- 16.2.6.1. Overview
- 16.2.6.2. Products
- 16.2.6.3. SWOT Analysis
- 16.2.6.4. Recent Developments
- 16.2.6.5. Financials (Based on Availability)
- 16.2.7 Roquette Freres*List Not Exhaustive
- 16.2.7.1. Overview
- 16.2.7.2. Products
- 16.2.7.3. SWOT Analysis
- 16.2.7.4. Recent Developments
- 16.2.7.5. Financials (Based on Availability)
- 16.2.8 Royal Avebe UA
- 16.2.8.1. Overview
- 16.2.8.2. Products
- 16.2.8.3. SWOT Analysis
- 16.2.8.4. Recent Developments
- 16.2.8.5. Financials (Based on Availability)
- 16.2.9 Ingredion Incorporated
- 16.2.9.1. Overview
- 16.2.9.2. Products
- 16.2.9.3. SWOT Analysis
- 16.2.9.4. Recent Developments
- 16.2.9.5. Financials (Based on Availability)
- 16.2.10 Corbion NV
- 16.2.10.1. Overview
- 16.2.10.2. Products
- 16.2.10.3. SWOT Analysis
- 16.2.10.4. Recent Developments
- 16.2.10.5. Financials (Based on Availability)
- 16.2.1 BÜHLER HOLDINGS AG
List of Figures
- Figure 1: Global Alternative Protein Industry Revenue Breakdown (Million, %) by Region 2024 & 2032
- Figure 2: North America Alternative Protein Industry Revenue (Million), by Country 2024 & 2032
- Figure 3: North America Alternative Protein Industry Revenue Share (%), by Country 2024 & 2032
- Figure 4: Europe Alternative Protein Industry Revenue (Million), by Country 2024 & 2032
- Figure 5: Europe Alternative Protein Industry Revenue Share (%), by Country 2024 & 2032
- Figure 6: Asia Pacific Alternative Protein Industry Revenue (Million), by Country 2024 & 2032
- Figure 7: Asia Pacific Alternative Protein Industry Revenue Share (%), by Country 2024 & 2032
- Figure 8: South America Alternative Protein Industry Revenue (Million), by Country 2024 & 2032
- Figure 9: South America Alternative Protein Industry Revenue Share (%), by Country 2024 & 2032
- Figure 10: Middle East & Africa Alternative Protein Industry Revenue (Million), by Country 2024 & 2032
- Figure 11: Middle East & Africa Alternative Protein Industry Revenue Share (%), by Country 2024 & 2032
- Figure 12: North America Alternative Protein Industry Revenue (Million), by Source 2024 & 2032
- Figure 13: North America Alternative Protein Industry Revenue Share (%), by Source 2024 & 2032
- Figure 14: North America Alternative Protein Industry Revenue (Million), by Application 2024 & 2032
- Figure 15: North America Alternative Protein Industry Revenue Share (%), by Application 2024 & 2032
- Figure 16: North America Alternative Protein Industry Revenue (Million), by Country 2024 & 2032
- Figure 17: North America Alternative Protein Industry Revenue Share (%), by Country 2024 & 2032
- Figure 18: Europe Alternative Protein Industry Revenue (Million), by Source 2024 & 2032
- Figure 19: Europe Alternative Protein Industry Revenue Share (%), by Source 2024 & 2032
- Figure 20: Europe Alternative Protein Industry Revenue (Million), by Application 2024 & 2032
- Figure 21: Europe Alternative Protein Industry Revenue Share (%), by Application 2024 & 2032
- Figure 22: Europe Alternative Protein Industry Revenue (Million), by Country 2024 & 2032
- Figure 23: Europe Alternative Protein Industry Revenue Share (%), by Country 2024 & 2032
- Figure 24: Asia Pacific Alternative Protein Industry Revenue (Million), by Source 2024 & 2032
- Figure 25: Asia Pacific Alternative Protein Industry Revenue Share (%), by Source 2024 & 2032
- Figure 26: Asia Pacific Alternative Protein Industry Revenue (Million), by Application 2024 & 2032
- Figure 27: Asia Pacific Alternative Protein Industry Revenue Share (%), by Application 2024 & 2032
- Figure 28: Asia Pacific Alternative Protein Industry Revenue (Million), by Country 2024 & 2032
- Figure 29: Asia Pacific Alternative Protein Industry Revenue Share (%), by Country 2024 & 2032
- Figure 30: South America Alternative Protein Industry Revenue (Million), by Source 2024 & 2032
- Figure 31: South America Alternative Protein Industry Revenue Share (%), by Source 2024 & 2032
- Figure 32: South America Alternative Protein Industry Revenue (Million), by Application 2024 & 2032
- Figure 33: South America Alternative Protein Industry Revenue Share (%), by Application 2024 & 2032
- Figure 34: South America Alternative Protein Industry Revenue (Million), by Country 2024 & 2032
- Figure 35: South America Alternative Protein Industry Revenue Share (%), by Country 2024 & 2032
- Figure 36: Middle East and Africa Alternative Protein Industry Revenue (Million), by Source 2024 & 2032
- Figure 37: Middle East and Africa Alternative Protein Industry Revenue Share (%), by Source 2024 & 2032
- Figure 38: Middle East and Africa Alternative Protein Industry Revenue (Million), by Application 2024 & 2032
- Figure 39: Middle East and Africa Alternative Protein Industry Revenue Share (%), by Application 2024 & 2032
- Figure 40: Middle East and Africa Alternative Protein Industry Revenue (Million), by Country 2024 & 2032
- Figure 41: Middle East and Africa Alternative Protein Industry Revenue Share (%), by Country 2024 & 2032
List of Tables
- Table 1: Global Alternative Protein Industry Revenue Million Forecast, by Region 2019 & 2032
- Table 2: Global Alternative Protein Industry Revenue Million Forecast, by Source 2019 & 2032
- Table 3: Global Alternative Protein Industry Revenue Million Forecast, by Application 2019 & 2032
- Table 4: Global Alternative Protein Industry Revenue Million Forecast, by Region 2019 & 2032
- Table 5: Global Alternative Protein Industry Revenue Million Forecast, by Country 2019 & 2032
- Table 6: United States Alternative Protein Industry Revenue (Million) Forecast, by Application 2019 & 2032
- Table 7: Canada Alternative Protein Industry Revenue (Million) Forecast, by Application 2019 & 2032
- Table 8: Mexico Alternative Protein Industry Revenue (Million) Forecast, by Application 2019 & 2032
- Table 9: Rest of North America Alternative Protein Industry Revenue (Million) Forecast, by Application 2019 & 2032
- Table 10: Global Alternative Protein Industry Revenue Million Forecast, by Country 2019 & 2032
- Table 11: Spain Alternative Protein Industry Revenue (Million) Forecast, by Application 2019 & 2032
- Table 12: United Kingdom Alternative Protein Industry Revenue (Million) Forecast, by Application 2019 & 2032
- Table 13: Germany Alternative Protein Industry Revenue (Million) Forecast, by Application 2019 & 2032
- Table 14: France Alternative Protein Industry Revenue (Million) Forecast, by Application 2019 & 2032
- Table 15: Italy Alternative Protein Industry Revenue (Million) Forecast, by Application 2019 & 2032
- Table 16: Russia Alternative Protein Industry Revenue (Million) Forecast, by Application 2019 & 2032
- Table 17: Rest of Europe Alternative Protein Industry Revenue (Million) Forecast, by Application 2019 & 2032
- Table 18: Global Alternative Protein Industry Revenue Million Forecast, by Country 2019 & 2032
- Table 19: China Alternative Protein Industry Revenue (Million) Forecast, by Application 2019 & 2032
- Table 20: Japan Alternative Protein Industry Revenue (Million) Forecast, by Application 2019 & 2032
- Table 21: India Alternative Protein Industry Revenue (Million) Forecast, by Application 2019 & 2032
- Table 22: Australia Alternative Protein Industry Revenue (Million) Forecast, by Application 2019 & 2032
- Table 23: Rest of Asia Pacific Alternative Protein Industry Revenue (Million) Forecast, by Application 2019 & 2032
- Table 24: Global Alternative Protein Industry Revenue Million Forecast, by Country 2019 & 2032
- Table 25: Brazil Alternative Protein Industry Revenue (Million) Forecast, by Application 2019 & 2032
- Table 26: Argentina Alternative Protein Industry Revenue (Million) Forecast, by Application 2019 & 2032
- Table 27: Rest of South America Alternative Protein Industry Revenue (Million) Forecast, by Application 2019 & 2032
- Table 28: Global Alternative Protein Industry Revenue Million Forecast, by Country 2019 & 2032
- Table 29: UAE Alternative Protein Industry Revenue (Million) Forecast, by Application 2019 & 2032
- Table 30: South Africa Alternative Protein Industry Revenue (Million) Forecast, by Application 2019 & 2032
- Table 31: Saudi Arabia Alternative Protein Industry Revenue (Million) Forecast, by Application 2019 & 2032
- Table 32: Rest of MEA Alternative Protein Industry Revenue (Million) Forecast, by Application 2019 & 2032
- Table 33: Global Alternative Protein Industry Revenue Million Forecast, by Source 2019 & 2032
- Table 34: Global Alternative Protein Industry Revenue Million Forecast, by Application 2019 & 2032
- Table 35: Global Alternative Protein Industry Revenue Million Forecast, by Country 2019 & 2032
- Table 36: United States Alternative Protein Industry Revenue (Million) Forecast, by Application 2019 & 2032
- Table 37: Canada Alternative Protein Industry Revenue (Million) Forecast, by Application 2019 & 2032
- Table 38: Mexico Alternative Protein Industry Revenue (Million) Forecast, by Application 2019 & 2032
- Table 39: Rest of North America Alternative Protein Industry Revenue (Million) Forecast, by Application 2019 & 2032
- Table 40: Global Alternative Protein Industry Revenue Million Forecast, by Source 2019 & 2032
- Table 41: Global Alternative Protein Industry Revenue Million Forecast, by Application 2019 & 2032
- Table 42: Global Alternative Protein Industry Revenue Million Forecast, by Country 2019 & 2032
- Table 43: Spain Alternative Protein Industry Revenue (Million) Forecast, by Application 2019 & 2032
- Table 44: United Kingdom Alternative Protein Industry Revenue (Million) Forecast, by Application 2019 & 2032
- Table 45: Germany Alternative Protein Industry Revenue (Million) Forecast, by Application 2019 & 2032
- Table 46: France Alternative Protein Industry Revenue (Million) Forecast, by Application 2019 & 2032
- Table 47: Italy Alternative Protein Industry Revenue (Million) Forecast, by Application 2019 & 2032
- Table 48: Russia Alternative Protein Industry Revenue (Million) Forecast, by Application 2019 & 2032
- Table 49: Rest of Europe Alternative Protein Industry Revenue (Million) Forecast, by Application 2019 & 2032
- Table 50: Global Alternative Protein Industry Revenue Million Forecast, by Source 2019 & 2032
- Table 51: Global Alternative Protein Industry Revenue Million Forecast, by Application 2019 & 2032
- Table 52: Global Alternative Protein Industry Revenue Million Forecast, by Country 2019 & 2032
- Table 53: China Alternative Protein Industry Revenue (Million) Forecast, by Application 2019 & 2032
- Table 54: Japan Alternative Protein Industry Revenue (Million) Forecast, by Application 2019 & 2032
- Table 55: India Alternative Protein Industry Revenue (Million) Forecast, by Application 2019 & 2032
- Table 56: Australia Alternative Protein Industry Revenue (Million) Forecast, by Application 2019 & 2032
- Table 57: Rest of Asia Pacific Alternative Protein Industry Revenue (Million) Forecast, by Application 2019 & 2032
- Table 58: Global Alternative Protein Industry Revenue Million Forecast, by Source 2019 & 2032
- Table 59: Global Alternative Protein Industry Revenue Million Forecast, by Application 2019 & 2032
- Table 60: Global Alternative Protein Industry Revenue Million Forecast, by Country 2019 & 2032
- Table 61: Brazil Alternative Protein Industry Revenue (Million) Forecast, by Application 2019 & 2032
- Table 62: Argentina Alternative Protein Industry Revenue (Million) Forecast, by Application 2019 & 2032
- Table 63: Rest of South America Alternative Protein Industry Revenue (Million) Forecast, by Application 2019 & 2032
- Table 64: Global Alternative Protein Industry Revenue Million Forecast, by Source 2019 & 2032
- Table 65: Global Alternative Protein Industry Revenue Million Forecast, by Application 2019 & 2032
- Table 66: Global Alternative Protein Industry Revenue Million Forecast, by Country 2019 & 2032
- Table 67: South Africa Alternative Protein Industry Revenue (Million) Forecast, by Application 2019 & 2032
- Table 68: Saudi Arabia Alternative Protein Industry Revenue (Million) Forecast, by Application 2019 & 2032
- Table 69: Rest of Middle East and Africa Alternative Protein Industry Revenue (Million) Forecast, by Application 2019 & 2032
Frequently Asked Questions
1. What is the projected Compound Annual Growth Rate (CAGR) of the Alternative Protein Industry?
The projected CAGR is approximately 3.68%.
2. Which companies are prominent players in the Alternative Protein Industry?
Key companies in the market include BÜHLER HOLDINGS AG, Cargill Incorporated, The Archer Daniels Midland Company, Kerry Inc, DuPont de Nemours Inc, Glanbia PLC, Roquette Freres*List Not Exhaustive, Royal Avebe UA, Ingredion Incorporated, Corbion NV.
3. What are the main segments of the Alternative Protein Industry?
The market segments include Source, Application.
4. Can you provide details about the market size?
The market size is estimated to be USD 15.19 Million as of 2022.
5. What are some drivers contributing to market growth?
Increasing Demand for Vegan Food & Beverages Driving the Market; Intolerance and Allergies Associated with Animal Protein Products.
6. What are the notable trends driving market growth?
Growing Preference For Plant-Based Protein Products.
7. Are there any restraints impacting market growth?
High Market Penetration of Animal Protein.
8. Can you provide examples of recent developments in the market?
In 2021, ADM announced that it had reached an agreement to acquire Sojaprotein, a leading European provider of non-GMO soy ingredients.
9. What pricing options are available for accessing the report?
Pricing options include single-user, multi-user, and enterprise licenses priced at USD 4750, USD 5250, and USD 8750 respectively.
10. Is the market size provided in terms of value or volume?
The market size is provided in terms of value, measured in Million.
11. Are there any specific market keywords associated with the report?
Yes, the market keyword associated with the report is "Alternative Protein Industry," which aids in identifying and referencing the specific market segment covered.
12. How do I determine which pricing option suits my needs best?
The pricing options vary based on user requirements and access needs. Individual users may opt for single-user licenses, while businesses requiring broader access may choose multi-user or enterprise licenses for cost-effective access to the report.
13. Are there any additional resources or data provided in the Alternative Protein Industry report?
While the report offers comprehensive insights, it's advisable to review the specific contents or supplementary materials provided to ascertain if additional resources or data are available.
14. How can I stay updated on further developments or reports in the Alternative Protein Industry?
To stay informed about further developments, trends, and reports in the Alternative Protein Industry, consider subscribing to industry newsletters, following relevant companies and organizations, or regularly checking reputable industry news sources and publications.
Methodology
Step 1 - Identification of Relevant Samples Size from Population Database


Step 2 - Approaches for Defining Global Market Size (Value, Volume* & Price*)

Note*: In applicable scenarios
Step 3 - Data Sources
Primary Research
- Web Analytics
- Survey Reports
- Research Institute
- Latest Research Reports
- Opinion Leaders
Secondary Research
- Annual Reports
- White Paper
- Latest Press Release
- Industry Association
- Paid Database
- Investor Presentations

Step 4 - Data Triangulation
Involves using different sources of information in order to increase the validity of a study
These sources are likely to be stakeholders in a program - participants, other researchers, program staff, other community members, and so on.
Then we put all data in single framework & apply various statistical tools to find out the dynamic on the market.
During the analysis stage, feedback from the stakeholder groups would be compared to determine areas of agreement as well as areas of divergence


