
Key Insights
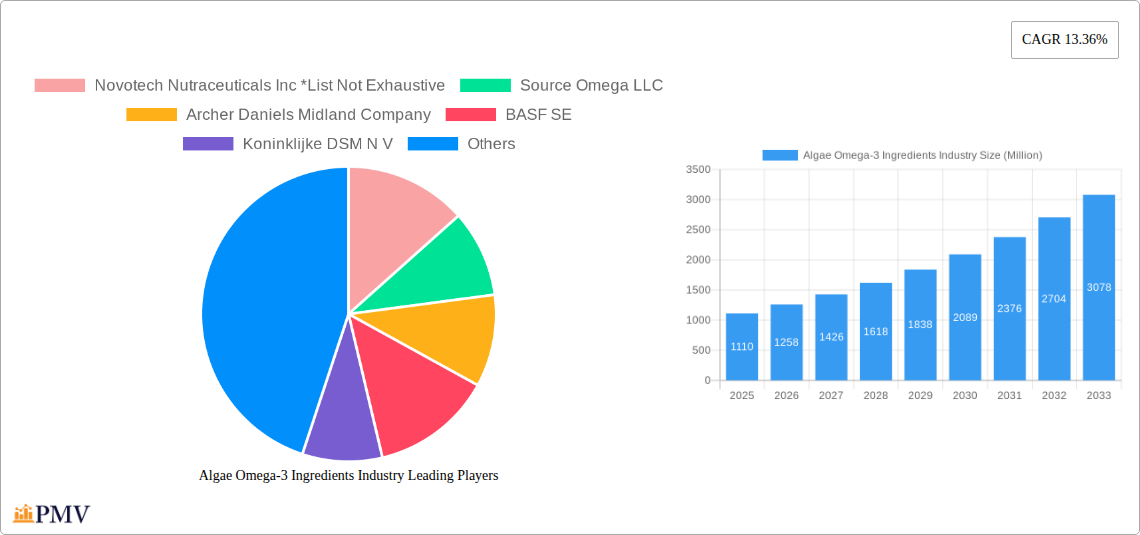
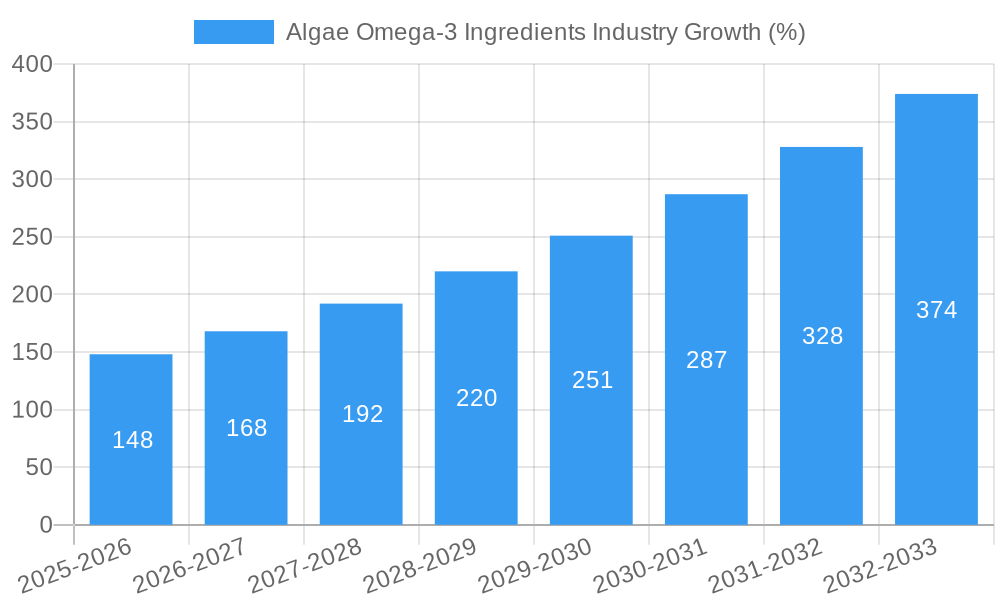
The Algae Omega-3 Ingredients market is experiencing robust growth, projected to reach \$1.11 billion in 2025 and exhibiting a Compound Annual Growth Rate (CAGR) of 13.36% from 2025 to 2033. This expansion is driven by increasing consumer awareness of the health benefits of Omega-3 fatty acids, particularly EPA and DHA, coupled with the growing demand for sustainable and ethical sourcing of these essential nutrients. The rising prevalence of chronic diseases like cardiovascular ailments and cognitive decline further fuels market growth, as Omega-3s are increasingly recognized for their preventative and therapeutic roles. The dietary supplement segment is a significant contributor, driven by the convenience and targeted delivery of Omega-3s through capsules and other formats. However, the relatively high cost of production compared to fish-derived Omega-3s remains a restraint. Further innovation in algae cultivation and extraction technologies is crucial for reducing costs and increasing market accessibility. The market is segmented by type (EPA, DHA, EPA/DHA) and application (food & beverages, dietary supplements, pharmaceuticals, animal nutrition). North America and Europe currently hold significant market shares, but the Asia-Pacific region is anticipated to witness substantial growth due to increasing health consciousness and rising disposable incomes. Major players like Novotech Nutraceuticals, DSM, and Corbion are driving innovation and expanding their product portfolios to cater to this burgeoning demand, leading to increased competition and further market dynamism.
The forecast period (2025-2033) promises continued growth, fueled by technological advancements improving algae cultivation efficiency and lowering production costs. The pharmaceutical segment is expected to witness significant growth driven by the incorporation of algae-derived Omega-3s into functional foods and nutraceuticals. Expanding research into the health benefits of Omega-3s, particularly their role in preventing and managing chronic diseases, will further stimulate demand. However, stringent regulatory frameworks and concerns regarding potential contaminants in algae-derived products could pose challenges. Sustainable sourcing and transparency in supply chains are increasingly important considerations for consumers, pushing companies to adopt environmentally friendly practices and robust quality control measures. Overall, the Algae Omega-3 Ingredients market presents a significant opportunity for growth and innovation, particularly for companies able to balance cost-effectiveness, sustainability, and product quality.
Algae Omega-3 Ingredients Industry Market Report: 2019-2033
This comprehensive report provides a detailed analysis of the Algae Omega-3 Ingredients industry, offering invaluable insights for stakeholders seeking to navigate this dynamic market. Covering the period 2019-2033, with a base year of 2025 and a forecast period of 2025-2033, this report provides a historical perspective and future projections, enabling informed decision-making. The report's in-depth analysis encompasses market sizing, segmentation, competitive dynamics, industry trends, and future growth opportunities, with a focus on key players and emerging technologies. The market is expected to reach xx Million by 2033, exhibiting a CAGR of xx% during the forecast period.
Algae Omega-3 Ingredients Industry Market Structure & Competitive Dynamics
The Algae Omega-3 Ingredients market exhibits a moderately consolidated structure, with several key players holding significant market share. Market concentration is influenced by factors such as economies of scale in production, access to raw materials, and established distribution networks. The competitive landscape is characterized by intense innovation, driven by the need to enhance product quality, expand applications, and improve cost-efficiency.
Regulatory frameworks, particularly concerning food safety and labeling, play a crucial role in shaping market dynamics. Product substitutes, primarily from fish oil sources, pose a significant competitive challenge, though algae-based omega-3s offer advantages in sustainability and purity. End-user trends towards healthier diets and increased awareness of the health benefits of omega-3 fatty acids are propelling market growth. M&A activities have been moderate in recent years, with deal values averaging xx Million. Key players are actively engaged in strategic partnerships to expand their market reach and enhance their product portfolios. For example, the merger between Company A and Company B in 2022 resulted in a combined market share of xx%.
- Market Concentration: Moderately Consolidated
- Innovation Ecosystems: Highly Active
- Regulatory Frameworks: Stringent, evolving
- Product Substitutes: Fish Oil
- M&A Activity: Moderate, with average deal values of xx Million
Algae Omega-3 Ingredients Industry Industry Trends & Insights
The Algae Omega-3 Ingredients market is experiencing robust growth, fueled by several key factors. Increasing consumer awareness of the health benefits of omega-3 fatty acids, coupled with a growing preference for plant-based alternatives to fish oil, is a major driver. Technological advancements in algae cultivation and extraction are significantly enhancing production efficiency and reducing costs. The market is witnessing a shift towards sustainable and ethical sourcing, further boosting demand for algae-based omega-3s. The rising prevalence of chronic diseases, such as cardiovascular disease, is also contributing to increased demand for omega-3 supplements. Competitive dynamics are characterized by continuous innovation in product formulations, application expansion, and strategic collaborations. The market penetration rate for algae-based omega-3s in the dietary supplement segment is estimated at xx% in 2025, projected to increase to xx% by 2033.
Dominant Markets & Segments in Algae Omega-3 Ingredients Industry
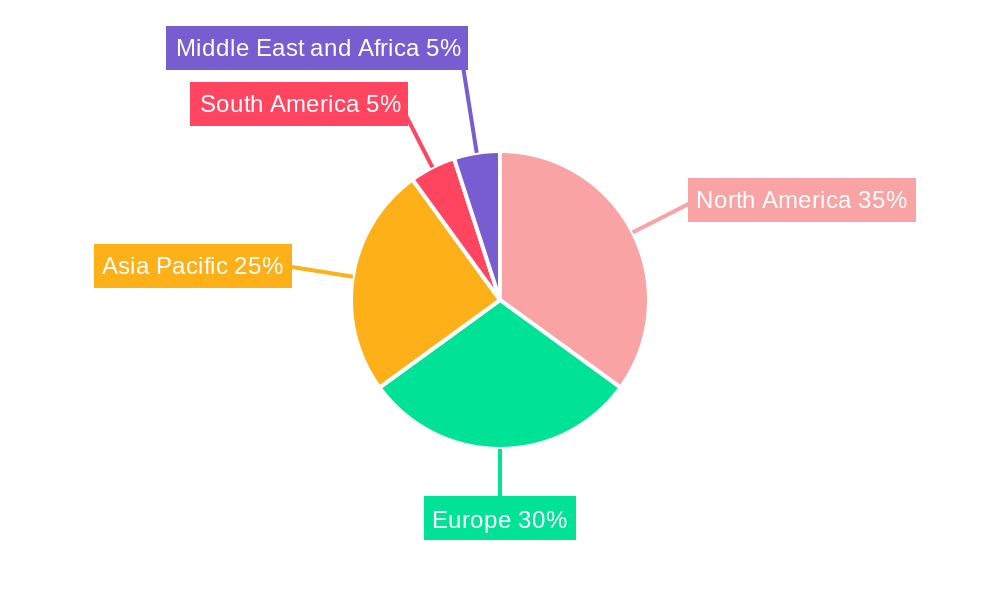
The North American region currently dominates the Algae Omega-3 Ingredients market, driven by high consumer demand, robust regulatory frameworks, and significant investments in research and development. Within the segments, the Dietary Supplements application holds the largest market share, followed by Food and Beverages. Among the types, EPA/DHA blends currently command the largest market share, owing to their broad range of health benefits.
- Leading Region: North America
- Leading Application: Dietary Supplements
- Leading Type: EPA/DHA
Key Drivers for North American Dominance:
- Strong consumer awareness of health benefits.
- Well-established regulatory frameworks supporting the industry.
- Significant investments in research & development.
- High disposable incomes and health consciousness.
Algae Omega-3 Ingredients Industry Product Innovations
Recent innovations focus on enhancing the bioavailability and stability of algae-based omega-3s, improving their efficacy and shelf life. New product formulations incorporating algae-derived omega-3s into functional foods and beverages are emerging, creating new applications for this market. Companies are also developing sustainable and efficient cultivation methods, reducing the environmental footprint of algae production. These innovations are contributing to a growing acceptance and market penetration of algae-based omega-3 ingredients across various applications.
Report Segmentation & Scope
The report segments the Algae Omega-3 Ingredients market by Type (Eicosapentanoic Acid (EPA), Docosahexaenoic Acid (DHA), EPA/DHA) and by Application (Food and Beverages, Dietary Supplements, Pharmaceuticals, Animal Nutrition). Each segment is analyzed in detail, providing market size estimations, growth projections, and competitive landscapes. For example, the Dietary Supplements segment is anticipated to exhibit the highest CAGR during the forecast period due to rising health consciousness among consumers. The Pharmaceuticals segment showcases a moderate CAGR, owing to the growing use of omega-3s in various therapeutic formulations.
Key Drivers of Algae Omega-3 Ingredients Industry Growth
The Algae Omega-3 Ingredients market is driven by several key factors: the increasing prevalence of chronic diseases, the growing demand for healthy and sustainable food products, advancements in algae cultivation technology leading to reduced production costs, and supportive government regulations promoting sustainable and healthy food solutions. These factors collectively contribute to the sustained growth of the market.
Challenges in the Algae Omega-3 Ingredients Industry Sector
Despite its growth potential, the Algae Omega-3 Ingredients industry faces several challenges. These include high initial investment costs for algae cultivation facilities, fluctuations in raw material costs and supply chain disruptions, and regulatory complexities related to product approvals and labeling in different regions. These factors can constrain market expansion and profitability for some players. Furthermore, competition from established fish oil producers presents a constant challenge.
Leading Players in the Algae Omega-3 Ingredients Industry Market
- Novotech Nutraceuticals Inc
- Source Omega LLC
- Archer Daniels Midland Company
- BASF SE
- Koninklijke DSM N V
- Corbion N V
- Neptune Wellness Solutions
- POLARIS
- Algalif
- DSM Nutritional Products
Key Developments in Algae Omega-3 Ingredients Industry Sector
- Jan 2023: Company X launches a new line of sustainably sourced algae-based omega-3 supplements.
- May 2022: Company Y announces a strategic partnership to expand its distribution network in Asia.
- Oct 2021: New regulations regarding labeling of omega-3 supplements come into effect in the EU.
Strategic Algae Omega-3 Ingredients Industry Market Outlook
The Algae Omega-3 Ingredients market presents significant growth potential, driven by ongoing technological advancements, increasing consumer demand for health-conscious products, and the growing focus on sustainability. Strategic opportunities exist in developing innovative product formulations, expanding into new geographic markets, and forging strategic partnerships to enhance market reach and penetration. The future of the market is bright, promising robust growth for industry players who adapt to changing market trends and leverage emerging technologies.
Algae Omega-3 Ingredients Industry Segmentation
-
1. Type
- 1.1. Eicosapentanoic Acid (EPA)
- 1.2. Docosahexaenoic Acid (DHA)
- 1.3. EPA/DHA
-
2. Application
- 2.1. Food and Beverages
- 2.2. Dietary Supplements
- 2.3. Pharmaceuticals
- 2.4. Animal Nutrition
Algae Omega-3 Ingredients Industry Segmentation By Geography
-
1. North America
- 1.1. United States
- 1.2. Canada
- 1.3. Mexico
- 1.4. Rest of North America
-
2. Europe
- 2.1. Spain
- 2.2. United Kingdom
- 2.3. Germany
- 2.4. France
- 2.5. Italy
- 2.6. Russia
- 2.7. Rest of Europe
-
3. Asia Pacific
- 3.1. China
- 3.2. Japan
- 3.3. India
- 3.4. Australia
- 3.5. Rest of Asia Pacific
-
4. South America
- 4.1. Brazil
- 4.2. Argentina
- 4.3. Rest of South America
-
5. Middle East and Africa
- 5.1. South Africa
- 5.2. Saudi Arabia
- 5.3. Rest of Middle East and Africa
Algae Omega-3 Ingredients Industry REPORT HIGHLIGHTS
| Aspects | Details |
|---|---|
| Study Period | 2019-2033 |
| Base Year | 2024 |
| Estimated Year | 2025 |
| Forecast Period | 2025-2033 |
| Historical Period | 2019-2024 |
| Growth Rate | CAGR of 13.36% from 2019-2033 |
| Segmentation |
|
Table of Contents
- 1. Introduction
- 1.1. Research Scope
- 1.2. Market Segmentation
- 1.3. Research Methodology
- 1.4. Definitions and Assumptions
- 2. Executive Summary
- 2.1. Introduction
- 3. Market Dynamics
- 3.1. Introduction
- 3.2. Market Drivers
- 3.2.1. Increasing Demand For Convenience & Processed Food
- 3.3. Market Restrains
- 3.3.1. Increased Consumer Awareness On Side-Effects Of Chemical Additives
- 3.4. Market Trends
- 3.4.1. Increasing Demand for EPA/DHA-Based Algae Omega-3 in Infant Formulations
- 4. Market Factor Analysis
- 4.1. Porters Five Forces
- 4.2. Supply/Value Chain
- 4.3. PESTEL analysis
- 4.4. Market Entropy
- 4.5. Patent/Trademark Analysis
- 5. Global Algae Omega-3 Ingredients Industry Analysis, Insights and Forecast, 2019-2031
- 5.1. Market Analysis, Insights and Forecast - by Type
- 5.1.1. Eicosapentanoic Acid (EPA)
- 5.1.2. Docosahexaenoic Acid (DHA)
- 5.1.3. EPA/DHA
- 5.2. Market Analysis, Insights and Forecast - by Application
- 5.2.1. Food and Beverages
- 5.2.2. Dietary Supplements
- 5.2.3. Pharmaceuticals
- 5.2.4. Animal Nutrition
- 5.3. Market Analysis, Insights and Forecast - by Region
- 5.3.1. North America
- 5.3.2. Europe
- 5.3.3. Asia Pacific
- 5.3.4. South America
- 5.3.5. Middle East and Africa
- 5.1. Market Analysis, Insights and Forecast - by Type
- 6. North America Algae Omega-3 Ingredients Industry Analysis, Insights and Forecast, 2019-2031
- 6.1. Market Analysis, Insights and Forecast - by Type
- 6.1.1. Eicosapentanoic Acid (EPA)
- 6.1.2. Docosahexaenoic Acid (DHA)
- 6.1.3. EPA/DHA
- 6.2. Market Analysis, Insights and Forecast - by Application
- 6.2.1. Food and Beverages
- 6.2.2. Dietary Supplements
- 6.2.3. Pharmaceuticals
- 6.2.4. Animal Nutrition
- 6.1. Market Analysis, Insights and Forecast - by Type
- 7. Europe Algae Omega-3 Ingredients Industry Analysis, Insights and Forecast, 2019-2031
- 7.1. Market Analysis, Insights and Forecast - by Type
- 7.1.1. Eicosapentanoic Acid (EPA)
- 7.1.2. Docosahexaenoic Acid (DHA)
- 7.1.3. EPA/DHA
- 7.2. Market Analysis, Insights and Forecast - by Application
- 7.2.1. Food and Beverages
- 7.2.2. Dietary Supplements
- 7.2.3. Pharmaceuticals
- 7.2.4. Animal Nutrition
- 7.1. Market Analysis, Insights and Forecast - by Type
- 8. Asia Pacific Algae Omega-3 Ingredients Industry Analysis, Insights and Forecast, 2019-2031
- 8.1. Market Analysis, Insights and Forecast - by Type
- 8.1.1. Eicosapentanoic Acid (EPA)
- 8.1.2. Docosahexaenoic Acid (DHA)
- 8.1.3. EPA/DHA
- 8.2. Market Analysis, Insights and Forecast - by Application
- 8.2.1. Food and Beverages
- 8.2.2. Dietary Supplements
- 8.2.3. Pharmaceuticals
- 8.2.4. Animal Nutrition
- 8.1. Market Analysis, Insights and Forecast - by Type
- 9. South America Algae Omega-3 Ingredients Industry Analysis, Insights and Forecast, 2019-2031
- 9.1. Market Analysis, Insights and Forecast - by Type
- 9.1.1. Eicosapentanoic Acid (EPA)
- 9.1.2. Docosahexaenoic Acid (DHA)
- 9.1.3. EPA/DHA
- 9.2. Market Analysis, Insights and Forecast - by Application
- 9.2.1. Food and Beverages
- 9.2.2. Dietary Supplements
- 9.2.3. Pharmaceuticals
- 9.2.4. Animal Nutrition
- 9.1. Market Analysis, Insights and Forecast - by Type
- 10. Middle East and Africa Algae Omega-3 Ingredients Industry Analysis, Insights and Forecast, 2019-2031
- 10.1. Market Analysis, Insights and Forecast - by Type
- 10.1.1. Eicosapentanoic Acid (EPA)
- 10.1.2. Docosahexaenoic Acid (DHA)
- 10.1.3. EPA/DHA
- 10.2. Market Analysis, Insights and Forecast - by Application
- 10.2.1. Food and Beverages
- 10.2.2. Dietary Supplements
- 10.2.3. Pharmaceuticals
- 10.2.4. Animal Nutrition
- 10.1. Market Analysis, Insights and Forecast - by Type
- 11. North America Algae Omega-3 Ingredients Industry Analysis, Insights and Forecast, 2019-2031
- 11.1. Market Analysis, Insights and Forecast - By Country/Sub-region
- 11.1.1 United States
- 11.1.2 Canada
- 11.1.3 Mexico
- 11.1.4 Rest of North America
- 12. Europe Algae Omega-3 Ingredients Industry Analysis, Insights and Forecast, 2019-2031
- 12.1. Market Analysis, Insights and Forecast - By Country/Sub-region
- 12.1.1 Spain
- 12.1.2 United Kingdom
- 12.1.3 Germany
- 12.1.4 France
- 12.1.5 Italy
- 12.1.6 Russia
- 12.1.7 Rest of Europe
- 13. Asia Pacific Algae Omega-3 Ingredients Industry Analysis, Insights and Forecast, 2019-2031
- 13.1. Market Analysis, Insights and Forecast - By Country/Sub-region
- 13.1.1 China
- 13.1.2 Japan
- 13.1.3 India
- 13.1.4 Australia
- 13.1.5 Rest of Asia Pacific
- 14. South America Algae Omega-3 Ingredients Industry Analysis, Insights and Forecast, 2019-2031
- 14.1. Market Analysis, Insights and Forecast - By Country/Sub-region
- 14.1.1 Brazil
- 14.1.2 Argentina
- 14.1.3 Rest of South America
- 15. Middle East and Africa Algae Omega-3 Ingredients Industry Analysis, Insights and Forecast, 2019-2031
- 15.1. Market Analysis, Insights and Forecast - By Country/Sub-region
- 15.1.1 South Africa
- 15.1.2 Saudi Arabia
- 15.1.3 Rest of Middle East and Africa
- 16. Competitive Analysis
- 16.1. Global Market Share Analysis 2024
- 16.2. Company Profiles
- 16.2.1 Novotech Nutraceuticals Inc *List Not Exhaustive
- 16.2.1.1. Overview
- 16.2.1.2. Products
- 16.2.1.3. SWOT Analysis
- 16.2.1.4. Recent Developments
- 16.2.1.5. Financials (Based on Availability)
- 16.2.2 Source Omega LLC
- 16.2.2.1. Overview
- 16.2.2.2. Products
- 16.2.2.3. SWOT Analysis
- 16.2.2.4. Recent Developments
- 16.2.2.5. Financials (Based on Availability)
- 16.2.3 Archer Daniels Midland Company
- 16.2.3.1. Overview
- 16.2.3.2. Products
- 16.2.3.3. SWOT Analysis
- 16.2.3.4. Recent Developments
- 16.2.3.5. Financials (Based on Availability)
- 16.2.4 BASF SE
- 16.2.4.1. Overview
- 16.2.4.2. Products
- 16.2.4.3. SWOT Analysis
- 16.2.4.4. Recent Developments
- 16.2.4.5. Financials (Based on Availability)
- 16.2.5 Koninklijke DSM N V
- 16.2.5.1. Overview
- 16.2.5.2. Products
- 16.2.5.3. SWOT Analysis
- 16.2.5.4. Recent Developments
- 16.2.5.5. Financials (Based on Availability)
- 16.2.6 Corbion N V
- 16.2.6.1. Overview
- 16.2.6.2. Products
- 16.2.6.3. SWOT Analysis
- 16.2.6.4. Recent Developments
- 16.2.6.5. Financials (Based on Availability)
- 16.2.7 Neptune Wellness Solutions
- 16.2.7.1. Overview
- 16.2.7.2. Products
- 16.2.7.3. SWOT Analysis
- 16.2.7.4. Recent Developments
- 16.2.7.5. Financials (Based on Availability)
- 16.2.8 POLARIS
- 16.2.8.1. Overview
- 16.2.8.2. Products
- 16.2.8.3. SWOT Analysis
- 16.2.8.4. Recent Developments
- 16.2.8.5. Financials (Based on Availability)
- 16.2.9 Algalif
- 16.2.9.1. Overview
- 16.2.9.2. Products
- 16.2.9.3. SWOT Analysis
- 16.2.9.4. Recent Developments
- 16.2.9.5. Financials (Based on Availability)
- 16.2.10 DSM Nutritional Products
- 16.2.10.1. Overview
- 16.2.10.2. Products
- 16.2.10.3. SWOT Analysis
- 16.2.10.4. Recent Developments
- 16.2.10.5. Financials (Based on Availability)
- 16.2.1 Novotech Nutraceuticals Inc *List Not Exhaustive
List of Figures
- Figure 1: Global Algae Omega-3 Ingredients Industry Revenue Breakdown (Million, %) by Region 2024 & 2032
- Figure 2: Global Algae Omega-3 Ingredients Industry Volume Breakdown (K Tons, %) by Region 2024 & 2032
- Figure 3: North America Algae Omega-3 Ingredients Industry Revenue (Million), by Country 2024 & 2032
- Figure 4: North America Algae Omega-3 Ingredients Industry Volume (K Tons), by Country 2024 & 2032
- Figure 5: North America Algae Omega-3 Ingredients Industry Revenue Share (%), by Country 2024 & 2032
- Figure 6: North America Algae Omega-3 Ingredients Industry Volume Share (%), by Country 2024 & 2032
- Figure 7: Europe Algae Omega-3 Ingredients Industry Revenue (Million), by Country 2024 & 2032
- Figure 8: Europe Algae Omega-3 Ingredients Industry Volume (K Tons), by Country 2024 & 2032
- Figure 9: Europe Algae Omega-3 Ingredients Industry Revenue Share (%), by Country 2024 & 2032
- Figure 10: Europe Algae Omega-3 Ingredients Industry Volume Share (%), by Country 2024 & 2032
- Figure 11: Asia Pacific Algae Omega-3 Ingredients Industry Revenue (Million), by Country 2024 & 2032
- Figure 12: Asia Pacific Algae Omega-3 Ingredients Industry Volume (K Tons), by Country 2024 & 2032
- Figure 13: Asia Pacific Algae Omega-3 Ingredients Industry Revenue Share (%), by Country 2024 & 2032
- Figure 14: Asia Pacific Algae Omega-3 Ingredients Industry Volume Share (%), by Country 2024 & 2032
- Figure 15: South America Algae Omega-3 Ingredients Industry Revenue (Million), by Country 2024 & 2032
- Figure 16: South America Algae Omega-3 Ingredients Industry Volume (K Tons), by Country 2024 & 2032
- Figure 17: South America Algae Omega-3 Ingredients Industry Revenue Share (%), by Country 2024 & 2032
- Figure 18: South America Algae Omega-3 Ingredients Industry Volume Share (%), by Country 2024 & 2032
- Figure 19: Middle East and Africa Algae Omega-3 Ingredients Industry Revenue (Million), by Country 2024 & 2032
- Figure 20: Middle East and Africa Algae Omega-3 Ingredients Industry Volume (K Tons), by Country 2024 & 2032
- Figure 21: Middle East and Africa Algae Omega-3 Ingredients Industry Revenue Share (%), by Country 2024 & 2032
- Figure 22: Middle East and Africa Algae Omega-3 Ingredients Industry Volume Share (%), by Country 2024 & 2032
- Figure 23: North America Algae Omega-3 Ingredients Industry Revenue (Million), by Type 2024 & 2032
- Figure 24: North America Algae Omega-3 Ingredients Industry Volume (K Tons), by Type 2024 & 2032
- Figure 25: North America Algae Omega-3 Ingredients Industry Revenue Share (%), by Type 2024 & 2032
- Figure 26: North America Algae Omega-3 Ingredients Industry Volume Share (%), by Type 2024 & 2032
- Figure 27: North America Algae Omega-3 Ingredients Industry Revenue (Million), by Application 2024 & 2032
- Figure 28: North America Algae Omega-3 Ingredients Industry Volume (K Tons), by Application 2024 & 2032
- Figure 29: North America Algae Omega-3 Ingredients Industry Revenue Share (%), by Application 2024 & 2032
- Figure 30: North America Algae Omega-3 Ingredients Industry Volume Share (%), by Application 2024 & 2032
- Figure 31: North America Algae Omega-3 Ingredients Industry Revenue (Million), by Country 2024 & 2032
- Figure 32: North America Algae Omega-3 Ingredients Industry Volume (K Tons), by Country 2024 & 2032
- Figure 33: North America Algae Omega-3 Ingredients Industry Revenue Share (%), by Country 2024 & 2032
- Figure 34: North America Algae Omega-3 Ingredients Industry Volume Share (%), by Country 2024 & 2032
- Figure 35: Europe Algae Omega-3 Ingredients Industry Revenue (Million), by Type 2024 & 2032
- Figure 36: Europe Algae Omega-3 Ingredients Industry Volume (K Tons), by Type 2024 & 2032
- Figure 37: Europe Algae Omega-3 Ingredients Industry Revenue Share (%), by Type 2024 & 2032
- Figure 38: Europe Algae Omega-3 Ingredients Industry Volume Share (%), by Type 2024 & 2032
- Figure 39: Europe Algae Omega-3 Ingredients Industry Revenue (Million), by Application 2024 & 2032
- Figure 40: Europe Algae Omega-3 Ingredients Industry Volume (K Tons), by Application 2024 & 2032
- Figure 41: Europe Algae Omega-3 Ingredients Industry Revenue Share (%), by Application 2024 & 2032
- Figure 42: Europe Algae Omega-3 Ingredients Industry Volume Share (%), by Application 2024 & 2032
- Figure 43: Europe Algae Omega-3 Ingredients Industry Revenue (Million), by Country 2024 & 2032
- Figure 44: Europe Algae Omega-3 Ingredients Industry Volume (K Tons), by Country 2024 & 2032
- Figure 45: Europe Algae Omega-3 Ingredients Industry Revenue Share (%), by Country 2024 & 2032
- Figure 46: Europe Algae Omega-3 Ingredients Industry Volume Share (%), by Country 2024 & 2032
- Figure 47: Asia Pacific Algae Omega-3 Ingredients Industry Revenue (Million), by Type 2024 & 2032
- Figure 48: Asia Pacific Algae Omega-3 Ingredients Industry Volume (K Tons), by Type 2024 & 2032
- Figure 49: Asia Pacific Algae Omega-3 Ingredients Industry Revenue Share (%), by Type 2024 & 2032
- Figure 50: Asia Pacific Algae Omega-3 Ingredients Industry Volume Share (%), by Type 2024 & 2032
- Figure 51: Asia Pacific Algae Omega-3 Ingredients Industry Revenue (Million), by Application 2024 & 2032
- Figure 52: Asia Pacific Algae Omega-3 Ingredients Industry Volume (K Tons), by Application 2024 & 2032
- Figure 53: Asia Pacific Algae Omega-3 Ingredients Industry Revenue Share (%), by Application 2024 & 2032
- Figure 54: Asia Pacific Algae Omega-3 Ingredients Industry Volume Share (%), by Application 2024 & 2032
- Figure 55: Asia Pacific Algae Omega-3 Ingredients Industry Revenue (Million), by Country 2024 & 2032
- Figure 56: Asia Pacific Algae Omega-3 Ingredients Industry Volume (K Tons), by Country 2024 & 2032
- Figure 57: Asia Pacific Algae Omega-3 Ingredients Industry Revenue Share (%), by Country 2024 & 2032
- Figure 58: Asia Pacific Algae Omega-3 Ingredients Industry Volume Share (%), by Country 2024 & 2032
- Figure 59: South America Algae Omega-3 Ingredients Industry Revenue (Million), by Type 2024 & 2032
- Figure 60: South America Algae Omega-3 Ingredients Industry Volume (K Tons), by Type 2024 & 2032
- Figure 61: South America Algae Omega-3 Ingredients Industry Revenue Share (%), by Type 2024 & 2032
- Figure 62: South America Algae Omega-3 Ingredients Industry Volume Share (%), by Type 2024 & 2032
- Figure 63: South America Algae Omega-3 Ingredients Industry Revenue (Million), by Application 2024 & 2032
- Figure 64: South America Algae Omega-3 Ingredients Industry Volume (K Tons), by Application 2024 & 2032
- Figure 65: South America Algae Omega-3 Ingredients Industry Revenue Share (%), by Application 2024 & 2032
- Figure 66: South America Algae Omega-3 Ingredients Industry Volume Share (%), by Application 2024 & 2032
- Figure 67: South America Algae Omega-3 Ingredients Industry Revenue (Million), by Country 2024 & 2032
- Figure 68: South America Algae Omega-3 Ingredients Industry Volume (K Tons), by Country 2024 & 2032
- Figure 69: South America Algae Omega-3 Ingredients Industry Revenue Share (%), by Country 2024 & 2032
- Figure 70: South America Algae Omega-3 Ingredients Industry Volume Share (%), by Country 2024 & 2032
- Figure 71: Middle East and Africa Algae Omega-3 Ingredients Industry Revenue (Million), by Type 2024 & 2032
- Figure 72: Middle East and Africa Algae Omega-3 Ingredients Industry Volume (K Tons), by Type 2024 & 2032
- Figure 73: Middle East and Africa Algae Omega-3 Ingredients Industry Revenue Share (%), by Type 2024 & 2032
- Figure 74: Middle East and Africa Algae Omega-3 Ingredients Industry Volume Share (%), by Type 2024 & 2032
- Figure 75: Middle East and Africa Algae Omega-3 Ingredients Industry Revenue (Million), by Application 2024 & 2032
- Figure 76: Middle East and Africa Algae Omega-3 Ingredients Industry Volume (K Tons), by Application 2024 & 2032
- Figure 77: Middle East and Africa Algae Omega-3 Ingredients Industry Revenue Share (%), by Application 2024 & 2032
- Figure 78: Middle East and Africa Algae Omega-3 Ingredients Industry Volume Share (%), by Application 2024 & 2032
- Figure 79: Middle East and Africa Algae Omega-3 Ingredients Industry Revenue (Million), by Country 2024 & 2032
- Figure 80: Middle East and Africa Algae Omega-3 Ingredients Industry Volume (K Tons), by Country 2024 & 2032
- Figure 81: Middle East and Africa Algae Omega-3 Ingredients Industry Revenue Share (%), by Country 2024 & 2032
- Figure 82: Middle East and Africa Algae Omega-3 Ingredients Industry Volume Share (%), by Country 2024 & 2032
List of Tables
- Table 1: Global Algae Omega-3 Ingredients Industry Revenue Million Forecast, by Region 2019 & 2032
- Table 2: Global Algae Omega-3 Ingredients Industry Volume K Tons Forecast, by Region 2019 & 2032
- Table 3: Global Algae Omega-3 Ingredients Industry Revenue Million Forecast, by Type 2019 & 2032
- Table 4: Global Algae Omega-3 Ingredients Industry Volume K Tons Forecast, by Type 2019 & 2032
- Table 5: Global Algae Omega-3 Ingredients Industry Revenue Million Forecast, by Application 2019 & 2032
- Table 6: Global Algae Omega-3 Ingredients Industry Volume K Tons Forecast, by Application 2019 & 2032
- Table 7: Global Algae Omega-3 Ingredients Industry Revenue Million Forecast, by Region 2019 & 2032
- Table 8: Global Algae Omega-3 Ingredients Industry Volume K Tons Forecast, by Region 2019 & 2032
- Table 9: Global Algae Omega-3 Ingredients Industry Revenue Million Forecast, by Country 2019 & 2032
- Table 10: Global Algae Omega-3 Ingredients Industry Volume K Tons Forecast, by Country 2019 & 2032
- Table 11: United States Algae Omega-3 Ingredients Industry Revenue (Million) Forecast, by Application 2019 & 2032
- Table 12: United States Algae Omega-3 Ingredients Industry Volume (K Tons) Forecast, by Application 2019 & 2032
- Table 13: Canada Algae Omega-3 Ingredients Industry Revenue (Million) Forecast, by Application 2019 & 2032
- Table 14: Canada Algae Omega-3 Ingredients Industry Volume (K Tons) Forecast, by Application 2019 & 2032
- Table 15: Mexico Algae Omega-3 Ingredients Industry Revenue (Million) Forecast, by Application 2019 & 2032
- Table 16: Mexico Algae Omega-3 Ingredients Industry Volume (K Tons) Forecast, by Application 2019 & 2032
- Table 17: Rest of North America Algae Omega-3 Ingredients Industry Revenue (Million) Forecast, by Application 2019 & 2032
- Table 18: Rest of North America Algae Omega-3 Ingredients Industry Volume (K Tons) Forecast, by Application 2019 & 2032
- Table 19: Global Algae Omega-3 Ingredients Industry Revenue Million Forecast, by Country 2019 & 2032
- Table 20: Global Algae Omega-3 Ingredients Industry Volume K Tons Forecast, by Country 2019 & 2032
- Table 21: Spain Algae Omega-3 Ingredients Industry Revenue (Million) Forecast, by Application 2019 & 2032
- Table 22: Spain Algae Omega-3 Ingredients Industry Volume (K Tons) Forecast, by Application 2019 & 2032
- Table 23: United Kingdom Algae Omega-3 Ingredients Industry Revenue (Million) Forecast, by Application 2019 & 2032
- Table 24: United Kingdom Algae Omega-3 Ingredients Industry Volume (K Tons) Forecast, by Application 2019 & 2032
- Table 25: Germany Algae Omega-3 Ingredients Industry Revenue (Million) Forecast, by Application 2019 & 2032
- Table 26: Germany Algae Omega-3 Ingredients Industry Volume (K Tons) Forecast, by Application 2019 & 2032
- Table 27: France Algae Omega-3 Ingredients Industry Revenue (Million) Forecast, by Application 2019 & 2032
- Table 28: France Algae Omega-3 Ingredients Industry Volume (K Tons) Forecast, by Application 2019 & 2032
- Table 29: Italy Algae Omega-3 Ingredients Industry Revenue (Million) Forecast, by Application 2019 & 2032
- Table 30: Italy Algae Omega-3 Ingredients Industry Volume (K Tons) Forecast, by Application 2019 & 2032
- Table 31: Russia Algae Omega-3 Ingredients Industry Revenue (Million) Forecast, by Application 2019 & 2032
- Table 32: Russia Algae Omega-3 Ingredients Industry Volume (K Tons) Forecast, by Application 2019 & 2032
- Table 33: Rest of Europe Algae Omega-3 Ingredients Industry Revenue (Million) Forecast, by Application 2019 & 2032
- Table 34: Rest of Europe Algae Omega-3 Ingredients Industry Volume (K Tons) Forecast, by Application 2019 & 2032
- Table 35: Global Algae Omega-3 Ingredients Industry Revenue Million Forecast, by Country 2019 & 2032
- Table 36: Global Algae Omega-3 Ingredients Industry Volume K Tons Forecast, by Country 2019 & 2032
- Table 37: China Algae Omega-3 Ingredients Industry Revenue (Million) Forecast, by Application 2019 & 2032
- Table 38: China Algae Omega-3 Ingredients Industry Volume (K Tons) Forecast, by Application 2019 & 2032
- Table 39: Japan Algae Omega-3 Ingredients Industry Revenue (Million) Forecast, by Application 2019 & 2032
- Table 40: Japan Algae Omega-3 Ingredients Industry Volume (K Tons) Forecast, by Application 2019 & 2032
- Table 41: India Algae Omega-3 Ingredients Industry Revenue (Million) Forecast, by Application 2019 & 2032
- Table 42: India Algae Omega-3 Ingredients Industry Volume (K Tons) Forecast, by Application 2019 & 2032
- Table 43: Australia Algae Omega-3 Ingredients Industry Revenue (Million) Forecast, by Application 2019 & 2032
- Table 44: Australia Algae Omega-3 Ingredients Industry Volume (K Tons) Forecast, by Application 2019 & 2032
- Table 45: Rest of Asia Pacific Algae Omega-3 Ingredients Industry Revenue (Million) Forecast, by Application 2019 & 2032
- Table 46: Rest of Asia Pacific Algae Omega-3 Ingredients Industry Volume (K Tons) Forecast, by Application 2019 & 2032
- Table 47: Global Algae Omega-3 Ingredients Industry Revenue Million Forecast, by Country 2019 & 2032
- Table 48: Global Algae Omega-3 Ingredients Industry Volume K Tons Forecast, by Country 2019 & 2032
- Table 49: Brazil Algae Omega-3 Ingredients Industry Revenue (Million) Forecast, by Application 2019 & 2032
- Table 50: Brazil Algae Omega-3 Ingredients Industry Volume (K Tons) Forecast, by Application 2019 & 2032
- Table 51: Argentina Algae Omega-3 Ingredients Industry Revenue (Million) Forecast, by Application 2019 & 2032
- Table 52: Argentina Algae Omega-3 Ingredients Industry Volume (K Tons) Forecast, by Application 2019 & 2032
- Table 53: Rest of South America Algae Omega-3 Ingredients Industry Revenue (Million) Forecast, by Application 2019 & 2032
- Table 54: Rest of South America Algae Omega-3 Ingredients Industry Volume (K Tons) Forecast, by Application 2019 & 2032
- Table 55: Global Algae Omega-3 Ingredients Industry Revenue Million Forecast, by Country 2019 & 2032
- Table 56: Global Algae Omega-3 Ingredients Industry Volume K Tons Forecast, by Country 2019 & 2032
- Table 57: South Africa Algae Omega-3 Ingredients Industry Revenue (Million) Forecast, by Application 2019 & 2032
- Table 58: South Africa Algae Omega-3 Ingredients Industry Volume (K Tons) Forecast, by Application 2019 & 2032
- Table 59: Saudi Arabia Algae Omega-3 Ingredients Industry Revenue (Million) Forecast, by Application 2019 & 2032
- Table 60: Saudi Arabia Algae Omega-3 Ingredients Industry Volume (K Tons) Forecast, by Application 2019 & 2032
- Table 61: Rest of Middle East and Africa Algae Omega-3 Ingredients Industry Revenue (Million) Forecast, by Application 2019 & 2032
- Table 62: Rest of Middle East and Africa Algae Omega-3 Ingredients Industry Volume (K Tons) Forecast, by Application 2019 & 2032
- Table 63: Global Algae Omega-3 Ingredients Industry Revenue Million Forecast, by Type 2019 & 2032
- Table 64: Global Algae Omega-3 Ingredients Industry Volume K Tons Forecast, by Type 2019 & 2032
- Table 65: Global Algae Omega-3 Ingredients Industry Revenue Million Forecast, by Application 2019 & 2032
- Table 66: Global Algae Omega-3 Ingredients Industry Volume K Tons Forecast, by Application 2019 & 2032
- Table 67: Global Algae Omega-3 Ingredients Industry Revenue Million Forecast, by Country 2019 & 2032
- Table 68: Global Algae Omega-3 Ingredients Industry Volume K Tons Forecast, by Country 2019 & 2032
- Table 69: United States Algae Omega-3 Ingredients Industry Revenue (Million) Forecast, by Application 2019 & 2032
- Table 70: United States Algae Omega-3 Ingredients Industry Volume (K Tons) Forecast, by Application 2019 & 2032
- Table 71: Canada Algae Omega-3 Ingredients Industry Revenue (Million) Forecast, by Application 2019 & 2032
- Table 72: Canada Algae Omega-3 Ingredients Industry Volume (K Tons) Forecast, by Application 2019 & 2032
- Table 73: Mexico Algae Omega-3 Ingredients Industry Revenue (Million) Forecast, by Application 2019 & 2032
- Table 74: Mexico Algae Omega-3 Ingredients Industry Volume (K Tons) Forecast, by Application 2019 & 2032
- Table 75: Rest of North America Algae Omega-3 Ingredients Industry Revenue (Million) Forecast, by Application 2019 & 2032
- Table 76: Rest of North America Algae Omega-3 Ingredients Industry Volume (K Tons) Forecast, by Application 2019 & 2032
- Table 77: Global Algae Omega-3 Ingredients Industry Revenue Million Forecast, by Type 2019 & 2032
- Table 78: Global Algae Omega-3 Ingredients Industry Volume K Tons Forecast, by Type 2019 & 2032
- Table 79: Global Algae Omega-3 Ingredients Industry Revenue Million Forecast, by Application 2019 & 2032
- Table 80: Global Algae Omega-3 Ingredients Industry Volume K Tons Forecast, by Application 2019 & 2032
- Table 81: Global Algae Omega-3 Ingredients Industry Revenue Million Forecast, by Country 2019 & 2032
- Table 82: Global Algae Omega-3 Ingredients Industry Volume K Tons Forecast, by Country 2019 & 2032
- Table 83: Spain Algae Omega-3 Ingredients Industry Revenue (Million) Forecast, by Application 2019 & 2032
- Table 84: Spain Algae Omega-3 Ingredients Industry Volume (K Tons) Forecast, by Application 2019 & 2032
- Table 85: United Kingdom Algae Omega-3 Ingredients Industry Revenue (Million) Forecast, by Application 2019 & 2032
- Table 86: United Kingdom Algae Omega-3 Ingredients Industry Volume (K Tons) Forecast, by Application 2019 & 2032
- Table 87: Germany Algae Omega-3 Ingredients Industry Revenue (Million) Forecast, by Application 2019 & 2032
- Table 88: Germany Algae Omega-3 Ingredients Industry Volume (K Tons) Forecast, by Application 2019 & 2032
- Table 89: France Algae Omega-3 Ingredients Industry Revenue (Million) Forecast, by Application 2019 & 2032
- Table 90: France Algae Omega-3 Ingredients Industry Volume (K Tons) Forecast, by Application 2019 & 2032
- Table 91: Italy Algae Omega-3 Ingredients Industry Revenue (Million) Forecast, by Application 2019 & 2032
- Table 92: Italy Algae Omega-3 Ingredients Industry Volume (K Tons) Forecast, by Application 2019 & 2032
- Table 93: Russia Algae Omega-3 Ingredients Industry Revenue (Million) Forecast, by Application 2019 & 2032
- Table 94: Russia Algae Omega-3 Ingredients Industry Volume (K Tons) Forecast, by Application 2019 & 2032
- Table 95: Rest of Europe Algae Omega-3 Ingredients Industry Revenue (Million) Forecast, by Application 2019 & 2032
- Table 96: Rest of Europe Algae Omega-3 Ingredients Industry Volume (K Tons) Forecast, by Application 2019 & 2032
- Table 97: Global Algae Omega-3 Ingredients Industry Revenue Million Forecast, by Type 2019 & 2032
- Table 98: Global Algae Omega-3 Ingredients Industry Volume K Tons Forecast, by Type 2019 & 2032
- Table 99: Global Algae Omega-3 Ingredients Industry Revenue Million Forecast, by Application 2019 & 2032
- Table 100: Global Algae Omega-3 Ingredients Industry Volume K Tons Forecast, by Application 2019 & 2032
- Table 101: Global Algae Omega-3 Ingredients Industry Revenue Million Forecast, by Country 2019 & 2032
- Table 102: Global Algae Omega-3 Ingredients Industry Volume K Tons Forecast, by Country 2019 & 2032
- Table 103: China Algae Omega-3 Ingredients Industry Revenue (Million) Forecast, by Application 2019 & 2032
- Table 104: China Algae Omega-3 Ingredients Industry Volume (K Tons) Forecast, by Application 2019 & 2032
- Table 105: Japan Algae Omega-3 Ingredients Industry Revenue (Million) Forecast, by Application 2019 & 2032
- Table 106: Japan Algae Omega-3 Ingredients Industry Volume (K Tons) Forecast, by Application 2019 & 2032
- Table 107: India Algae Omega-3 Ingredients Industry Revenue (Million) Forecast, by Application 2019 & 2032
- Table 108: India Algae Omega-3 Ingredients Industry Volume (K Tons) Forecast, by Application 2019 & 2032
- Table 109: Australia Algae Omega-3 Ingredients Industry Revenue (Million) Forecast, by Application 2019 & 2032
- Table 110: Australia Algae Omega-3 Ingredients Industry Volume (K Tons) Forecast, by Application 2019 & 2032
- Table 111: Rest of Asia Pacific Algae Omega-3 Ingredients Industry Revenue (Million) Forecast, by Application 2019 & 2032
- Table 112: Rest of Asia Pacific Algae Omega-3 Ingredients Industry Volume (K Tons) Forecast, by Application 2019 & 2032
- Table 113: Global Algae Omega-3 Ingredients Industry Revenue Million Forecast, by Type 2019 & 2032
- Table 114: Global Algae Omega-3 Ingredients Industry Volume K Tons Forecast, by Type 2019 & 2032
- Table 115: Global Algae Omega-3 Ingredients Industry Revenue Million Forecast, by Application 2019 & 2032
- Table 116: Global Algae Omega-3 Ingredients Industry Volume K Tons Forecast, by Application 2019 & 2032
- Table 117: Global Algae Omega-3 Ingredients Industry Revenue Million Forecast, by Country 2019 & 2032
- Table 118: Global Algae Omega-3 Ingredients Industry Volume K Tons Forecast, by Country 2019 & 2032
- Table 119: Brazil Algae Omega-3 Ingredients Industry Revenue (Million) Forecast, by Application 2019 & 2032
- Table 120: Brazil Algae Omega-3 Ingredients Industry Volume (K Tons) Forecast, by Application 2019 & 2032
- Table 121: Argentina Algae Omega-3 Ingredients Industry Revenue (Million) Forecast, by Application 2019 & 2032
- Table 122: Argentina Algae Omega-3 Ingredients Industry Volume (K Tons) Forecast, by Application 2019 & 2032
- Table 123: Rest of South America Algae Omega-3 Ingredients Industry Revenue (Million) Forecast, by Application 2019 & 2032
- Table 124: Rest of South America Algae Omega-3 Ingredients Industry Volume (K Tons) Forecast, by Application 2019 & 2032
- Table 125: Global Algae Omega-3 Ingredients Industry Revenue Million Forecast, by Type 2019 & 2032
- Table 126: Global Algae Omega-3 Ingredients Industry Volume K Tons Forecast, by Type 2019 & 2032
- Table 127: Global Algae Omega-3 Ingredients Industry Revenue Million Forecast, by Application 2019 & 2032
- Table 128: Global Algae Omega-3 Ingredients Industry Volume K Tons Forecast, by Application 2019 & 2032
- Table 129: Global Algae Omega-3 Ingredients Industry Revenue Million Forecast, by Country 2019 & 2032
- Table 130: Global Algae Omega-3 Ingredients Industry Volume K Tons Forecast, by Country 2019 & 2032
- Table 131: South Africa Algae Omega-3 Ingredients Industry Revenue (Million) Forecast, by Application 2019 & 2032
- Table 132: South Africa Algae Omega-3 Ingredients Industry Volume (K Tons) Forecast, by Application 2019 & 2032
- Table 133: Saudi Arabia Algae Omega-3 Ingredients Industry Revenue (Million) Forecast, by Application 2019 & 2032
- Table 134: Saudi Arabia Algae Omega-3 Ingredients Industry Volume (K Tons) Forecast, by Application 2019 & 2032
- Table 135: Rest of Middle East and Africa Algae Omega-3 Ingredients Industry Revenue (Million) Forecast, by Application 2019 & 2032
- Table 136: Rest of Middle East and Africa Algae Omega-3 Ingredients Industry Volume (K Tons) Forecast, by Application 2019 & 2032
Frequently Asked Questions
1. What is the projected Compound Annual Growth Rate (CAGR) of the Algae Omega-3 Ingredients Industry?
The projected CAGR is approximately 13.36%.
2. Which companies are prominent players in the Algae Omega-3 Ingredients Industry?
Key companies in the market include Novotech Nutraceuticals Inc *List Not Exhaustive, Source Omega LLC, Archer Daniels Midland Company, BASF SE, Koninklijke DSM N V, Corbion N V, Neptune Wellness Solutions, POLARIS, Algalif , DSM Nutritional Products.
3. What are the main segments of the Algae Omega-3 Ingredients Industry?
The market segments include Type, Application.
4. Can you provide details about the market size?
The market size is estimated to be USD 1.11 Million as of 2022.
5. What are some drivers contributing to market growth?
Increasing Demand For Convenience & Processed Food.
6. What are the notable trends driving market growth?
Increasing Demand for EPA/DHA-Based Algae Omega-3 in Infant Formulations.
7. Are there any restraints impacting market growth?
Increased Consumer Awareness On Side-Effects Of Chemical Additives.
8. Can you provide examples of recent developments in the market?
N/A
9. What pricing options are available for accessing the report?
Pricing options include single-user, multi-user, and enterprise licenses priced at USD 4750, USD 5250, and USD 8750 respectively.
10. Is the market size provided in terms of value or volume?
The market size is provided in terms of value, measured in Million and volume, measured in K Tons.
11. Are there any specific market keywords associated with the report?
Yes, the market keyword associated with the report is "Algae Omega-3 Ingredients Industry," which aids in identifying and referencing the specific market segment covered.
12. How do I determine which pricing option suits my needs best?
The pricing options vary based on user requirements and access needs. Individual users may opt for single-user licenses, while businesses requiring broader access may choose multi-user or enterprise licenses for cost-effective access to the report.
13. Are there any additional resources or data provided in the Algae Omega-3 Ingredients Industry report?
While the report offers comprehensive insights, it's advisable to review the specific contents or supplementary materials provided to ascertain if additional resources or data are available.
14. How can I stay updated on further developments or reports in the Algae Omega-3 Ingredients Industry?
To stay informed about further developments, trends, and reports in the Algae Omega-3 Ingredients Industry, consider subscribing to industry newsletters, following relevant companies and organizations, or regularly checking reputable industry news sources and publications.
Methodology
Step 1 - Identification of Relevant Samples Size from Population Database


Step 2 - Approaches for Defining Global Market Size (Value, Volume* & Price*)

Note*: In applicable scenarios
Step 3 - Data Sources
Primary Research
- Web Analytics
- Survey Reports
- Research Institute
- Latest Research Reports
- Opinion Leaders
Secondary Research
- Annual Reports
- White Paper
- Latest Press Release
- Industry Association
- Paid Database
- Investor Presentations

Step 4 - Data Triangulation
Involves using different sources of information in order to increase the validity of a study
These sources are likely to be stakeholders in a program - participants, other researchers, program staff, other community members, and so on.
Then we put all data in single framework & apply various statistical tools to find out the dynamic on the market.
During the analysis stage, feedback from the stakeholder groups would be compared to determine areas of agreement as well as areas of divergence


