
Key Insights
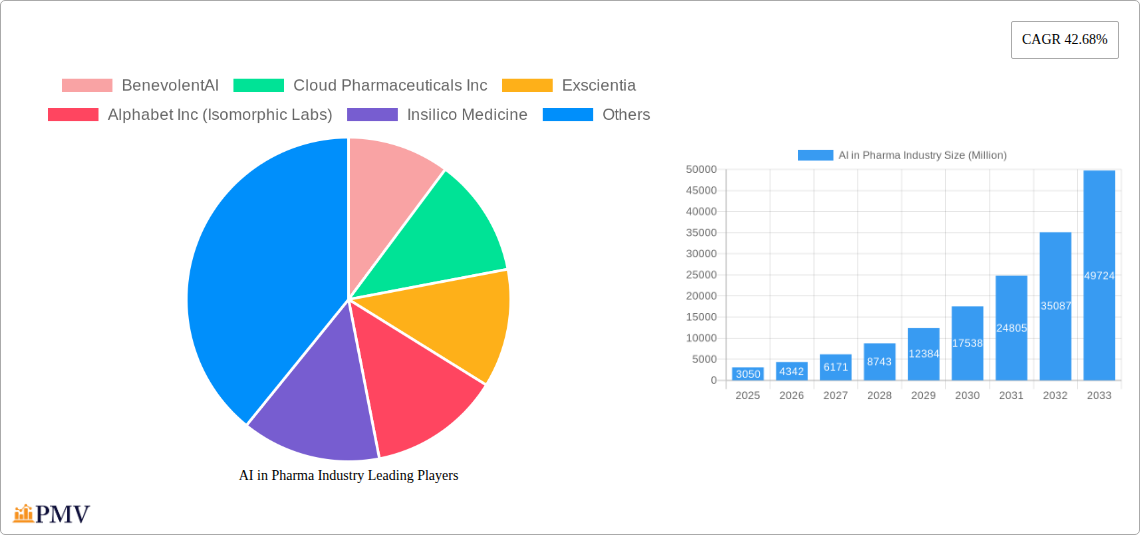
The AI in Pharma market is experiencing explosive growth, projected to reach \$3.05 billion in 2025 and exhibiting a remarkable Compound Annual Growth Rate (CAGR) of 42.68% from 2025 to 2033. This rapid expansion is driven by several key factors. Firstly, the increasing complexity of drug discovery and development necessitates innovative solutions to accelerate timelines and reduce costs. AI algorithms excel at analyzing vast datasets, identifying promising drug candidates, and optimizing clinical trial designs, offering significant efficiency gains. Secondly, the rising prevalence of chronic diseases and growing demand for personalized medicine fuel the need for more effective and targeted therapies, areas where AI is proving invaluable. Technological advancements in machine learning, particularly deep learning and natural language processing, are further propelling market growth by enhancing the accuracy and speed of AI-driven drug discovery and development processes. The market segmentation reveals strong growth across various technologies (Machine Learning leading the way), software and services, and applications spanning drug discovery, clinical trials, and laboratory automation.
Major players like BenevolentAI, Exscientia, and Insilico Medicine are at the forefront of this transformation, leveraging AI to revolutionize pharmaceutical R&D. The regional landscape indicates strong market presence in North America, driven by substantial investments in AI research and development and a robust pharmaceutical industry infrastructure. Europe and Asia Pacific also demonstrate significant growth potential, fueled by increasing adoption of AI technologies and supportive government initiatives. While challenges remain, such as data privacy concerns and the need for regulatory clarity, the overall outlook for the AI in Pharma market remains exceptionally positive. The substantial investment in this sector and the demonstrated ability of AI to improve various aspects of the pharmaceutical pipeline strongly suggest continued market expansion well into the next decade. The market's future trajectory will likely be shaped by further advancements in AI algorithms, increased collaborations between pharmaceutical companies and technology providers, and the successful integration of AI into established pharmaceutical workflows.
AI in Pharma Industry: A Comprehensive Market Report (2019-2033)
This comprehensive report provides a detailed analysis of the AI in Pharma Industry market, offering invaluable insights for stakeholders seeking to navigate this rapidly evolving landscape. The study period spans from 2019 to 2033, with a base year of 2025 and a forecast period of 2025-2033. The report projects a market value exceeding $XX Million by 2033, exhibiting a robust Compound Annual Growth Rate (CAGR) of XX%. This in-depth analysis incorporates data from the historical period (2019-2024) and leverages advanced market forecasting techniques to provide accurate and actionable insights. Key players such as BenevolentAI, Cloud Pharmaceuticals Inc, Exscientia, Alphabet Inc (Isomorphic Labs), Insilico Medicine, Atomwise Inc, Deargen Inc, XtalPi Inc, Cyclica Inc, Euretos, Deep Genomics, and InveniAI LLC are profiled, showcasing their strategic initiatives and market positioning.
AI in Pharma Industry Market Structure & Competitive Dynamics
The AI in Pharma Industry market is characterized by a moderately concentrated structure, with a few major players holding significant market share. However, the market is also highly dynamic, with numerous smaller companies and startups contributing to innovation. The competitive landscape is shaped by factors including technological advancements, regulatory approvals, and strategic partnerships. Market concentration is estimated at approximately XX%, with the top five players commanding a combined share of XX%. Mergers and acquisitions (M&A) activity has been substantial, with deal values exceeding $XX Million in the past five years. Notable M&A activities include [insert details of specific M&A deals with deal values, if available, otherwise use “XX Million” as a placeholder]. The regulatory framework plays a crucial role, impacting the speed of innovation and market entry. End-user trends, such as the increasing focus on personalized medicine and precision therapies, are driving demand for AI-powered solutions. The market is experiencing rapid innovation, with new products and services emerging constantly. Substitute technologies are relatively limited, but advancements in other areas of drug discovery and development could potentially pose a threat in the long term.
AI in Pharma Industry Industry Trends & Insights
The AI in Pharma Industry market is witnessing exponential growth, driven by several key factors. Technological advancements, particularly in machine learning and deep learning, are significantly accelerating drug discovery and development processes. The increasing availability of large datasets, coupled with improved computational power, is enabling the development of more sophisticated AI algorithms. Consumer preferences are shifting towards personalized and targeted therapies, creating a strong demand for AI-powered solutions that can tailor treatments to individual patient needs. The market is also influenced by regulatory changes and government initiatives promoting the adoption of AI in healthcare. The market is estimated to reach $XX Million by 2025 and is projected to grow at a CAGR of XX% from 2025 to 2033. Market penetration is expected to increase significantly, driven by the increasing awareness of the benefits of AI-powered solutions among pharmaceutical companies. The growing adoption of cloud-based platforms is further enhancing accessibility and affordability. However, challenges remain, including data privacy concerns and the need for robust regulatory frameworks to ensure the safety and efficacy of AI-driven therapies.

Dominant Markets & Segments in AI in Pharma Industry
Leading Region: North America currently dominates the AI in Pharma Industry market, driven by significant investments in R&D, a robust technological infrastructure, and the presence of key players. The region's strong regulatory environment and well-established healthcare systems also contribute to its dominance. Europe is also experiencing rapid growth, fuelled by increasing government support and a rising number of AI startups.
Leading Country: The United States is the leading country in the market due to its concentration of pharmaceutical companies, cutting-edge research institutions, and substantial venture capital funding.
Technology: Machine learning holds the largest market share due to its versatility and applicability across various aspects of drug discovery and development. Other technologies are also gaining traction, such as natural language processing (NLP) for analyzing medical literature and computer vision for analyzing medical images.
Type: Software solutions dominate, followed by services like consulting and AI-powered platform development. The market for AI services is expected to grow rapidly as companies increasingly seek external expertise.
Application: Drug discovery is the largest application segment, driven by the significant potential for AI to accelerate and optimize the drug development process. Clinical trials are also a major area of application, with AI playing a crucial role in patient recruitment, trial design, and data analysis. Laboratory automation is another significant area, with AI-powered robots and systems automating routine tasks and improving efficiency. Other applications are emerging, such as personalized medicine and real-world evidence generation.
Key drivers for these dominant segments include robust regulatory environments, funding opportunities, and a high concentration of specialized talent and resources. Furthermore, the presence of major pharmaceutical companies and research institutions plays a significant role in driving growth.
AI in Pharma Industry Product Innovations
Recent product innovations include AI-powered platforms for drug discovery, clinical trial optimization tools, and laboratory automation systems. These innovations offer significant competitive advantages by accelerating drug development timelines, reducing costs, and improving the accuracy of predictions. The ongoing trend is towards more sophisticated algorithms, incorporating diverse data sources and addressing challenges associated with data heterogeneity and bias. This trend is significantly influenced by increasing computational power and advancements in machine learning methodologies.
Report Segmentation & Scope
The report segments the AI in Pharma Industry market by technology (Machine Learning, Other Technologies), type (Software, Services), and application (Drug Discovery, Clinical Trial, Laboratory Automation, Other Applications). Each segment is analyzed in detail, providing projections for market size, growth rates, and competitive dynamics. For example, the Machine Learning segment is projected to witness substantial growth, driven by its widespread adoption in drug discovery and clinical trials. The Software segment is expected to maintain its dominant position, while the Services segment is poised for rapid expansion due to growing demand for customized AI solutions. The Drug Discovery application segment is anticipated to retain its leading position due to the potential of AI to accelerate drug development cycles and reduce costs.
Key Drivers of AI in Pharma Industry Growth
Several factors are driving the growth of the AI in Pharma Industry market. Technological advancements in machine learning and artificial intelligence are enabling the development of sophisticated algorithms and models for drug discovery and development. Increased funding from both public and private sources is fueling innovation. The growing need for personalized medicine and precise therapies is also driving demand for AI-powered solutions. Favorable regulatory environments in some regions are encouraging the adoption of AI technologies in healthcare. Examples include the FDA's initiatives to streamline the approval process for AI-powered medical devices.
Challenges in the AI in Pharma Industry Sector
The AI in Pharma Industry sector faces several challenges, including the high cost of developing and implementing AI-powered solutions, the need for robust data security and privacy measures, and the potential for bias in algorithms. Regulatory hurdles related to the approval of AI-driven therapies and the lack of standardization across data formats are also significant barriers to market growth. Moreover, supply chain issues related to access to specialized hardware and software can hinder innovation. These factors can collectively result in a projected loss of $XX Million annually.
Leading Players in the AI in Pharma Industry Market
- BenevolentAI
- Cloud Pharmaceuticals Inc
- Exscientia
- Alphabet Inc (Isomorphic Labs)
- Insilico Medicine
- Atomwise Inc
- Deargen Inc
- XtalPi Inc
- Cyclica Inc
- Euretos
- Deep Genomics
- InveniAI LLC
Key Developments in AI in Pharma Industry Sector
December 2022: Cyclica Inc and SK Chemicals Co., Ltd. partnered to develop AI-driven therapies across various disease areas. This partnership signifies the growing importance of AI in drug discovery and development collaborations.
October 2022: Deerfield Management and BioSymetrics launched a five-year joint venture to accelerate the advancement of new therapeutics, focusing on cardiovascular and neurological diseases. This collaboration highlights the increased interest in leveraging AI for target discovery and validation.
Strategic AI in Pharma Industry Market Outlook
The future of the AI in Pharma Industry market is bright, with significant growth potential driven by continuous technological advancements, increased investments in research and development, and growing demand for personalized medicine. Strategic opportunities exist for companies that can develop innovative AI-powered solutions that address unmet medical needs, improve the efficiency of drug discovery and development, and enhance patient care. The market is poised for significant expansion as AI becomes further integrated into all aspects of the pharmaceutical industry. This integration will lead to breakthroughs in drug discovery, personalized medicine, and improved healthcare outcomes.
AI in Pharma Industry Segmentation
-
1. Technology
- 1.1. Machine Learning
- 1.2. Other Technologies
-
2. Type
- 2.1. Software
- 2.2. Services
-
3. Application
- 3.1. Drug Discovery
- 3.2. Clinical Trial
- 3.3. Laboratory Automation
- 3.4. Other Applications
AI in Pharma Industry Segmentation By Geography
-
1. North America
- 1.1. United States
- 1.2. Canada
- 1.3. Mexico
-
2. Europe
- 2.1. Germany
- 2.2. United Kingdom
- 2.3. France
- 2.4. Italy
- 2.5. Spain
- 2.6. Rest of Europe
-
3. Asia Pacific
- 3.1. China
- 3.2. Japan
- 3.3. India
- 3.4. Australia
- 3.5. South Korea
- 3.6. Rest of Asia Pacific
-
4. Middle East and Africa
- 4.1. GCC
- 4.2. South Africa
- 4.3. Rest of Middle East and Africa
-
5. South America
- 5.1. Brazil
- 5.2. Argentina
- 5.3. Rest of South America

AI in Pharma Industry REPORT HIGHLIGHTS
| Aspects | Details |
|---|---|
| Study Period | 2019-2033 |
| Base Year | 2024 |
| Estimated Year | 2025 |
| Forecast Period | 2025-2033 |
| Historical Period | 2019-2024 |
| Growth Rate | CAGR of 42.68% from 2019-2033 |
| Segmentation |
|
Table of Contents
- 1. Introduction
- 1.1. Research Scope
- 1.2. Market Segmentation
- 1.3. Research Methodology
- 1.4. Definitions and Assumptions
- 2. Executive Summary
- 2.1. Introduction
- 3. Market Dynamics
- 3.1. Introduction
- 3.2. Market Drivers
- 3.2.1. Growing Number of Cross-industry Collaborations and Partnerships; Surge In Adoption of Artificial Intelligence (AI) for Clinical Trials; Increasing Need to Reduce Drug Discovery & Development Costs and Timelines
- 3.3. Market Restrains
- 3.3.1. Inadequate Availability of Skilled Professionals; Incompatible Healthcare IT Infrastructure
- 3.4. Market Trends
- 3.4.1. Drug Discovery Segment is Expected to Witness Significant Growth in the Market Over the Forecast Period
- 4. Market Factor Analysis
- 4.1. Porters Five Forces
- 4.2. Supply/Value Chain
- 4.3. PESTEL analysis
- 4.4. Market Entropy
- 4.5. Patent/Trademark Analysis
- 5. Global AI in Pharma Industry Analysis, Insights and Forecast, 2019-2031
- 5.1. Market Analysis, Insights and Forecast - by Technology
- 5.1.1. Machine Learning
- 5.1.2. Other Technologies
- 5.2. Market Analysis, Insights and Forecast - by Type
- 5.2.1. Software
- 5.2.2. Services
- 5.3. Market Analysis, Insights and Forecast - by Application
- 5.3.1. Drug Discovery
- 5.3.2. Clinical Trial
- 5.3.3. Laboratory Automation
- 5.3.4. Other Applications
- 5.4. Market Analysis, Insights and Forecast - by Region
- 5.4.1. North America
- 5.4.2. Europe
- 5.4.3. Asia Pacific
- 5.4.4. Middle East and Africa
- 5.4.5. South America
- 5.1. Market Analysis, Insights and Forecast - by Technology
- 6. North America AI in Pharma Industry Analysis, Insights and Forecast, 2019-2031
- 6.1. Market Analysis, Insights and Forecast - by Technology
- 6.1.1. Machine Learning
- 6.1.2. Other Technologies
- 6.2. Market Analysis, Insights and Forecast - by Type
- 6.2.1. Software
- 6.2.2. Services
- 6.3. Market Analysis, Insights and Forecast - by Application
- 6.3.1. Drug Discovery
- 6.3.2. Clinical Trial
- 6.3.3. Laboratory Automation
- 6.3.4. Other Applications
- 6.1. Market Analysis, Insights and Forecast - by Technology
- 7. Europe AI in Pharma Industry Analysis, Insights and Forecast, 2019-2031
- 7.1. Market Analysis, Insights and Forecast - by Technology
- 7.1.1. Machine Learning
- 7.1.2. Other Technologies
- 7.2. Market Analysis, Insights and Forecast - by Type
- 7.2.1. Software
- 7.2.2. Services
- 7.3. Market Analysis, Insights and Forecast - by Application
- 7.3.1. Drug Discovery
- 7.3.2. Clinical Trial
- 7.3.3. Laboratory Automation
- 7.3.4. Other Applications
- 7.1. Market Analysis, Insights and Forecast - by Technology
- 8. Asia Pacific AI in Pharma Industry Analysis, Insights and Forecast, 2019-2031
- 8.1. Market Analysis, Insights and Forecast - by Technology
- 8.1.1. Machine Learning
- 8.1.2. Other Technologies
- 8.2. Market Analysis, Insights and Forecast - by Type
- 8.2.1. Software
- 8.2.2. Services
- 8.3. Market Analysis, Insights and Forecast - by Application
- 8.3.1. Drug Discovery
- 8.3.2. Clinical Trial
- 8.3.3. Laboratory Automation
- 8.3.4. Other Applications
- 8.1. Market Analysis, Insights and Forecast - by Technology
- 9. Middle East and Africa AI in Pharma Industry Analysis, Insights and Forecast, 2019-2031
- 9.1. Market Analysis, Insights and Forecast - by Technology
- 9.1.1. Machine Learning
- 9.1.2. Other Technologies
- 9.2. Market Analysis, Insights and Forecast - by Type
- 9.2.1. Software
- 9.2.2. Services
- 9.3. Market Analysis, Insights and Forecast - by Application
- 9.3.1. Drug Discovery
- 9.3.2. Clinical Trial
- 9.3.3. Laboratory Automation
- 9.3.4. Other Applications
- 9.1. Market Analysis, Insights and Forecast - by Technology
- 10. South America AI in Pharma Industry Analysis, Insights and Forecast, 2019-2031
- 10.1. Market Analysis, Insights and Forecast - by Technology
- 10.1.1. Machine Learning
- 10.1.2. Other Technologies
- 10.2. Market Analysis, Insights and Forecast - by Type
- 10.2.1. Software
- 10.2.2. Services
- 10.3. Market Analysis, Insights and Forecast - by Application
- 10.3.1. Drug Discovery
- 10.3.2. Clinical Trial
- 10.3.3. Laboratory Automation
- 10.3.4. Other Applications
- 10.1. Market Analysis, Insights and Forecast - by Technology
- 11. North America AI in Pharma Industry Analysis, Insights and Forecast, 2019-2031
- 11.1. Market Analysis, Insights and Forecast - By Country/Sub-region
- 11.1.1 United States
- 11.1.2 Canada
- 11.1.3 Mexico
- 12. Europe AI in Pharma Industry Analysis, Insights and Forecast, 2019-2031
- 12.1. Market Analysis, Insights and Forecast - By Country/Sub-region
- 12.1.1 Germany
- 12.1.2 United Kingdom
- 12.1.3 France
- 12.1.4 Italy
- 12.1.5 Spain
- 12.1.6 Rest of Europe
- 13. Asia Pacific AI in Pharma Industry Analysis, Insights and Forecast, 2019-2031
- 13.1. Market Analysis, Insights and Forecast - By Country/Sub-region
- 13.1.1 China
- 13.1.2 Japan
- 13.1.3 India
- 13.1.4 Australia
- 13.1.5 South Korea
- 13.1.6 Rest of Asia Pacific
- 14. Middle East and Africa AI in Pharma Industry Analysis, Insights and Forecast, 2019-2031
- 14.1. Market Analysis, Insights and Forecast - By Country/Sub-region
- 14.1.1 GCC
- 14.1.2 South Africa
- 14.1.3 Rest of Middle East and Africa
- 15. South America AI in Pharma Industry Analysis, Insights and Forecast, 2019-2031
- 15.1. Market Analysis, Insights and Forecast - By Country/Sub-region
- 15.1.1 Brazil
- 15.1.2 Argentina
- 15.1.3 Rest of South America
- 16. Competitive Analysis
- 16.1. Global Market Share Analysis 2024
- 16.2. Company Profiles
- 16.2.1 BenevolentAI
- 16.2.1.1. Overview
- 16.2.1.2. Products
- 16.2.1.3. SWOT Analysis
- 16.2.1.4. Recent Developments
- 16.2.1.5. Financials (Based on Availability)
- 16.2.2 Cloud Pharmaceuticals Inc
- 16.2.2.1. Overview
- 16.2.2.2. Products
- 16.2.2.3. SWOT Analysis
- 16.2.2.4. Recent Developments
- 16.2.2.5. Financials (Based on Availability)
- 16.2.3 Exscientia
- 16.2.3.1. Overview
- 16.2.3.2. Products
- 16.2.3.3. SWOT Analysis
- 16.2.3.4. Recent Developments
- 16.2.3.5. Financials (Based on Availability)
- 16.2.4 Alphabet Inc (Isomorphic Labs)
- 16.2.4.1. Overview
- 16.2.4.2. Products
- 16.2.4.3. SWOT Analysis
- 16.2.4.4. Recent Developments
- 16.2.4.5. Financials (Based on Availability)
- 16.2.5 Insilico Medicine
- 16.2.5.1. Overview
- 16.2.5.2. Products
- 16.2.5.3. SWOT Analysis
- 16.2.5.4. Recent Developments
- 16.2.5.5. Financials (Based on Availability)
- 16.2.6 Atomwise Inc
- 16.2.6.1. Overview
- 16.2.6.2. Products
- 16.2.6.3. SWOT Analysis
- 16.2.6.4. Recent Developments
- 16.2.6.5. Financials (Based on Availability)
- 16.2.7 Deargen Inc
- 16.2.7.1. Overview
- 16.2.7.2. Products
- 16.2.7.3. SWOT Analysis
- 16.2.7.4. Recent Developments
- 16.2.7.5. Financials (Based on Availability)
- 16.2.8 XtalPi Inc
- 16.2.8.1. Overview
- 16.2.8.2. Products
- 16.2.8.3. SWOT Analysis
- 16.2.8.4. Recent Developments
- 16.2.8.5. Financials (Based on Availability)
- 16.2.9 Cyclica Inc
- 16.2.9.1. Overview
- 16.2.9.2. Products
- 16.2.9.3. SWOT Analysis
- 16.2.9.4. Recent Developments
- 16.2.9.5. Financials (Based on Availability)
- 16.2.10 Euretos
- 16.2.10.1. Overview
- 16.2.10.2. Products
- 16.2.10.3. SWOT Analysis
- 16.2.10.4. Recent Developments
- 16.2.10.5. Financials (Based on Availability)
- 16.2.11 Deep Genomics
- 16.2.11.1. Overview
- 16.2.11.2. Products
- 16.2.11.3. SWOT Analysis
- 16.2.11.4. Recent Developments
- 16.2.11.5. Financials (Based on Availability)
- 16.2.12 InveniAI LLC
- 16.2.12.1. Overview
- 16.2.12.2. Products
- 16.2.12.3. SWOT Analysis
- 16.2.12.4. Recent Developments
- 16.2.12.5. Financials (Based on Availability)
- 16.2.1 BenevolentAI
List of Figures
- Figure 1: Global AI in Pharma Industry Revenue Breakdown (Million, %) by Region 2024 & 2032
- Figure 2: Global AI in Pharma Industry Volume Breakdown (K Unit, %) by Region 2024 & 2032
- Figure 3: North America AI in Pharma Industry Revenue (Million), by Country 2024 & 2032
- Figure 4: North America AI in Pharma Industry Volume (K Unit), by Country 2024 & 2032
- Figure 5: North America AI in Pharma Industry Revenue Share (%), by Country 2024 & 2032
- Figure 6: North America AI in Pharma Industry Volume Share (%), by Country 2024 & 2032
- Figure 7: Europe AI in Pharma Industry Revenue (Million), by Country 2024 & 2032
- Figure 8: Europe AI in Pharma Industry Volume (K Unit), by Country 2024 & 2032
- Figure 9: Europe AI in Pharma Industry Revenue Share (%), by Country 2024 & 2032
- Figure 10: Europe AI in Pharma Industry Volume Share (%), by Country 2024 & 2032
- Figure 11: Asia Pacific AI in Pharma Industry Revenue (Million), by Country 2024 & 2032
- Figure 12: Asia Pacific AI in Pharma Industry Volume (K Unit), by Country 2024 & 2032
- Figure 13: Asia Pacific AI in Pharma Industry Revenue Share (%), by Country 2024 & 2032
- Figure 14: Asia Pacific AI in Pharma Industry Volume Share (%), by Country 2024 & 2032
- Figure 15: Middle East and Africa AI in Pharma Industry Revenue (Million), by Country 2024 & 2032
- Figure 16: Middle East and Africa AI in Pharma Industry Volume (K Unit), by Country 2024 & 2032
- Figure 17: Middle East and Africa AI in Pharma Industry Revenue Share (%), by Country 2024 & 2032
- Figure 18: Middle East and Africa AI in Pharma Industry Volume Share (%), by Country 2024 & 2032
- Figure 19: South America AI in Pharma Industry Revenue (Million), by Country 2024 & 2032
- Figure 20: South America AI in Pharma Industry Volume (K Unit), by Country 2024 & 2032
- Figure 21: South America AI in Pharma Industry Revenue Share (%), by Country 2024 & 2032
- Figure 22: South America AI in Pharma Industry Volume Share (%), by Country 2024 & 2032
- Figure 23: North America AI in Pharma Industry Revenue (Million), by Technology 2024 & 2032
- Figure 24: North America AI in Pharma Industry Volume (K Unit), by Technology 2024 & 2032
- Figure 25: North America AI in Pharma Industry Revenue Share (%), by Technology 2024 & 2032
- Figure 26: North America AI in Pharma Industry Volume Share (%), by Technology 2024 & 2032
- Figure 27: North America AI in Pharma Industry Revenue (Million), by Type 2024 & 2032
- Figure 28: North America AI in Pharma Industry Volume (K Unit), by Type 2024 & 2032
- Figure 29: North America AI in Pharma Industry Revenue Share (%), by Type 2024 & 2032
- Figure 30: North America AI in Pharma Industry Volume Share (%), by Type 2024 & 2032
- Figure 31: North America AI in Pharma Industry Revenue (Million), by Application 2024 & 2032
- Figure 32: North America AI in Pharma Industry Volume (K Unit), by Application 2024 & 2032
- Figure 33: North America AI in Pharma Industry Revenue Share (%), by Application 2024 & 2032
- Figure 34: North America AI in Pharma Industry Volume Share (%), by Application 2024 & 2032
- Figure 35: North America AI in Pharma Industry Revenue (Million), by Country 2024 & 2032
- Figure 36: North America AI in Pharma Industry Volume (K Unit), by Country 2024 & 2032
- Figure 37: North America AI in Pharma Industry Revenue Share (%), by Country 2024 & 2032
- Figure 38: North America AI in Pharma Industry Volume Share (%), by Country 2024 & 2032
- Figure 39: Europe AI in Pharma Industry Revenue (Million), by Technology 2024 & 2032
- Figure 40: Europe AI in Pharma Industry Volume (K Unit), by Technology 2024 & 2032
- Figure 41: Europe AI in Pharma Industry Revenue Share (%), by Technology 2024 & 2032
- Figure 42: Europe AI in Pharma Industry Volume Share (%), by Technology 2024 & 2032
- Figure 43: Europe AI in Pharma Industry Revenue (Million), by Type 2024 & 2032
- Figure 44: Europe AI in Pharma Industry Volume (K Unit), by Type 2024 & 2032
- Figure 45: Europe AI in Pharma Industry Revenue Share (%), by Type 2024 & 2032
- Figure 46: Europe AI in Pharma Industry Volume Share (%), by Type 2024 & 2032
- Figure 47: Europe AI in Pharma Industry Revenue (Million), by Application 2024 & 2032
- Figure 48: Europe AI in Pharma Industry Volume (K Unit), by Application 2024 & 2032
- Figure 49: Europe AI in Pharma Industry Revenue Share (%), by Application 2024 & 2032
- Figure 50: Europe AI in Pharma Industry Volume Share (%), by Application 2024 & 2032
- Figure 51: Europe AI in Pharma Industry Revenue (Million), by Country 2024 & 2032
- Figure 52: Europe AI in Pharma Industry Volume (K Unit), by Country 2024 & 2032
- Figure 53: Europe AI in Pharma Industry Revenue Share (%), by Country 2024 & 2032
- Figure 54: Europe AI in Pharma Industry Volume Share (%), by Country 2024 & 2032
- Figure 55: Asia Pacific AI in Pharma Industry Revenue (Million), by Technology 2024 & 2032
- Figure 56: Asia Pacific AI in Pharma Industry Volume (K Unit), by Technology 2024 & 2032
- Figure 57: Asia Pacific AI in Pharma Industry Revenue Share (%), by Technology 2024 & 2032
- Figure 58: Asia Pacific AI in Pharma Industry Volume Share (%), by Technology 2024 & 2032
- Figure 59: Asia Pacific AI in Pharma Industry Revenue (Million), by Type 2024 & 2032
- Figure 60: Asia Pacific AI in Pharma Industry Volume (K Unit), by Type 2024 & 2032
- Figure 61: Asia Pacific AI in Pharma Industry Revenue Share (%), by Type 2024 & 2032
- Figure 62: Asia Pacific AI in Pharma Industry Volume Share (%), by Type 2024 & 2032
- Figure 63: Asia Pacific AI in Pharma Industry Revenue (Million), by Application 2024 & 2032
- Figure 64: Asia Pacific AI in Pharma Industry Volume (K Unit), by Application 2024 & 2032
- Figure 65: Asia Pacific AI in Pharma Industry Revenue Share (%), by Application 2024 & 2032
- Figure 66: Asia Pacific AI in Pharma Industry Volume Share (%), by Application 2024 & 2032
- Figure 67: Asia Pacific AI in Pharma Industry Revenue (Million), by Country 2024 & 2032
- Figure 68: Asia Pacific AI in Pharma Industry Volume (K Unit), by Country 2024 & 2032
- Figure 69: Asia Pacific AI in Pharma Industry Revenue Share (%), by Country 2024 & 2032
- Figure 70: Asia Pacific AI in Pharma Industry Volume Share (%), by Country 2024 & 2032
- Figure 71: Middle East and Africa AI in Pharma Industry Revenue (Million), by Technology 2024 & 2032
- Figure 72: Middle East and Africa AI in Pharma Industry Volume (K Unit), by Technology 2024 & 2032
- Figure 73: Middle East and Africa AI in Pharma Industry Revenue Share (%), by Technology 2024 & 2032
- Figure 74: Middle East and Africa AI in Pharma Industry Volume Share (%), by Technology 2024 & 2032
- Figure 75: Middle East and Africa AI in Pharma Industry Revenue (Million), by Type 2024 & 2032
- Figure 76: Middle East and Africa AI in Pharma Industry Volume (K Unit), by Type 2024 & 2032
- Figure 77: Middle East and Africa AI in Pharma Industry Revenue Share (%), by Type 2024 & 2032
- Figure 78: Middle East and Africa AI in Pharma Industry Volume Share (%), by Type 2024 & 2032
- Figure 79: Middle East and Africa AI in Pharma Industry Revenue (Million), by Application 2024 & 2032
- Figure 80: Middle East and Africa AI in Pharma Industry Volume (K Unit), by Application 2024 & 2032
- Figure 81: Middle East and Africa AI in Pharma Industry Revenue Share (%), by Application 2024 & 2032
- Figure 82: Middle East and Africa AI in Pharma Industry Volume Share (%), by Application 2024 & 2032
- Figure 83: Middle East and Africa AI in Pharma Industry Revenue (Million), by Country 2024 & 2032
- Figure 84: Middle East and Africa AI in Pharma Industry Volume (K Unit), by Country 2024 & 2032
- Figure 85: Middle East and Africa AI in Pharma Industry Revenue Share (%), by Country 2024 & 2032
- Figure 86: Middle East and Africa AI in Pharma Industry Volume Share (%), by Country 2024 & 2032
- Figure 87: South America AI in Pharma Industry Revenue (Million), by Technology 2024 & 2032
- Figure 88: South America AI in Pharma Industry Volume (K Unit), by Technology 2024 & 2032
- Figure 89: South America AI in Pharma Industry Revenue Share (%), by Technology 2024 & 2032
- Figure 90: South America AI in Pharma Industry Volume Share (%), by Technology 2024 & 2032
- Figure 91: South America AI in Pharma Industry Revenue (Million), by Type 2024 & 2032
- Figure 92: South America AI in Pharma Industry Volume (K Unit), by Type 2024 & 2032
- Figure 93: South America AI in Pharma Industry Revenue Share (%), by Type 2024 & 2032
- Figure 94: South America AI in Pharma Industry Volume Share (%), by Type 2024 & 2032
- Figure 95: South America AI in Pharma Industry Revenue (Million), by Application 2024 & 2032
- Figure 96: South America AI in Pharma Industry Volume (K Unit), by Application 2024 & 2032
- Figure 97: South America AI in Pharma Industry Revenue Share (%), by Application 2024 & 2032
- Figure 98: South America AI in Pharma Industry Volume Share (%), by Application 2024 & 2032
- Figure 99: South America AI in Pharma Industry Revenue (Million), by Country 2024 & 2032
- Figure 100: South America AI in Pharma Industry Volume (K Unit), by Country 2024 & 2032
- Figure 101: South America AI in Pharma Industry Revenue Share (%), by Country 2024 & 2032
- Figure 102: South America AI in Pharma Industry Volume Share (%), by Country 2024 & 2032
List of Tables
- Table 1: Global AI in Pharma Industry Revenue Million Forecast, by Region 2019 & 2032
- Table 2: Global AI in Pharma Industry Volume K Unit Forecast, by Region 2019 & 2032
- Table 3: Global AI in Pharma Industry Revenue Million Forecast, by Technology 2019 & 2032
- Table 4: Global AI in Pharma Industry Volume K Unit Forecast, by Technology 2019 & 2032
- Table 5: Global AI in Pharma Industry Revenue Million Forecast, by Type 2019 & 2032
- Table 6: Global AI in Pharma Industry Volume K Unit Forecast, by Type 2019 & 2032
- Table 7: Global AI in Pharma Industry Revenue Million Forecast, by Application 2019 & 2032
- Table 8: Global AI in Pharma Industry Volume K Unit Forecast, by Application 2019 & 2032
- Table 9: Global AI in Pharma Industry Revenue Million Forecast, by Region 2019 & 2032
- Table 10: Global AI in Pharma Industry Volume K Unit Forecast, by Region 2019 & 2032
- Table 11: Global AI in Pharma Industry Revenue Million Forecast, by Country 2019 & 2032
- Table 12: Global AI in Pharma Industry Volume K Unit Forecast, by Country 2019 & 2032
- Table 13: United States AI in Pharma Industry Revenue (Million) Forecast, by Application 2019 & 2032
- Table 14: United States AI in Pharma Industry Volume (K Unit) Forecast, by Application 2019 & 2032
- Table 15: Canada AI in Pharma Industry Revenue (Million) Forecast, by Application 2019 & 2032
- Table 16: Canada AI in Pharma Industry Volume (K Unit) Forecast, by Application 2019 & 2032
- Table 17: Mexico AI in Pharma Industry Revenue (Million) Forecast, by Application 2019 & 2032
- Table 18: Mexico AI in Pharma Industry Volume (K Unit) Forecast, by Application 2019 & 2032
- Table 19: Global AI in Pharma Industry Revenue Million Forecast, by Country 2019 & 2032
- Table 20: Global AI in Pharma Industry Volume K Unit Forecast, by Country 2019 & 2032
- Table 21: Germany AI in Pharma Industry Revenue (Million) Forecast, by Application 2019 & 2032
- Table 22: Germany AI in Pharma Industry Volume (K Unit) Forecast, by Application 2019 & 2032
- Table 23: United Kingdom AI in Pharma Industry Revenue (Million) Forecast, by Application 2019 & 2032
- Table 24: United Kingdom AI in Pharma Industry Volume (K Unit) Forecast, by Application 2019 & 2032
- Table 25: France AI in Pharma Industry Revenue (Million) Forecast, by Application 2019 & 2032
- Table 26: France AI in Pharma Industry Volume (K Unit) Forecast, by Application 2019 & 2032
- Table 27: Italy AI in Pharma Industry Revenue (Million) Forecast, by Application 2019 & 2032
- Table 28: Italy AI in Pharma Industry Volume (K Unit) Forecast, by Application 2019 & 2032
- Table 29: Spain AI in Pharma Industry Revenue (Million) Forecast, by Application 2019 & 2032
- Table 30: Spain AI in Pharma Industry Volume (K Unit) Forecast, by Application 2019 & 2032
- Table 31: Rest of Europe AI in Pharma Industry Revenue (Million) Forecast, by Application 2019 & 2032
- Table 32: Rest of Europe AI in Pharma Industry Volume (K Unit) Forecast, by Application 2019 & 2032
- Table 33: Global AI in Pharma Industry Revenue Million Forecast, by Country 2019 & 2032
- Table 34: Global AI in Pharma Industry Volume K Unit Forecast, by Country 2019 & 2032
- Table 35: China AI in Pharma Industry Revenue (Million) Forecast, by Application 2019 & 2032
- Table 36: China AI in Pharma Industry Volume (K Unit) Forecast, by Application 2019 & 2032
- Table 37: Japan AI in Pharma Industry Revenue (Million) Forecast, by Application 2019 & 2032
- Table 38: Japan AI in Pharma Industry Volume (K Unit) Forecast, by Application 2019 & 2032
- Table 39: India AI in Pharma Industry Revenue (Million) Forecast, by Application 2019 & 2032
- Table 40: India AI in Pharma Industry Volume (K Unit) Forecast, by Application 2019 & 2032
- Table 41: Australia AI in Pharma Industry Revenue (Million) Forecast, by Application 2019 & 2032
- Table 42: Australia AI in Pharma Industry Volume (K Unit) Forecast, by Application 2019 & 2032
- Table 43: South Korea AI in Pharma Industry Revenue (Million) Forecast, by Application 2019 & 2032
- Table 44: South Korea AI in Pharma Industry Volume (K Unit) Forecast, by Application 2019 & 2032
- Table 45: Rest of Asia Pacific AI in Pharma Industry Revenue (Million) Forecast, by Application 2019 & 2032
- Table 46: Rest of Asia Pacific AI in Pharma Industry Volume (K Unit) Forecast, by Application 2019 & 2032
- Table 47: Global AI in Pharma Industry Revenue Million Forecast, by Country 2019 & 2032
- Table 48: Global AI in Pharma Industry Volume K Unit Forecast, by Country 2019 & 2032
- Table 49: GCC AI in Pharma Industry Revenue (Million) Forecast, by Application 2019 & 2032
- Table 50: GCC AI in Pharma Industry Volume (K Unit) Forecast, by Application 2019 & 2032
- Table 51: South Africa AI in Pharma Industry Revenue (Million) Forecast, by Application 2019 & 2032
- Table 52: South Africa AI in Pharma Industry Volume (K Unit) Forecast, by Application 2019 & 2032
- Table 53: Rest of Middle East and Africa AI in Pharma Industry Revenue (Million) Forecast, by Application 2019 & 2032
- Table 54: Rest of Middle East and Africa AI in Pharma Industry Volume (K Unit) Forecast, by Application 2019 & 2032
- Table 55: Global AI in Pharma Industry Revenue Million Forecast, by Country 2019 & 2032
- Table 56: Global AI in Pharma Industry Volume K Unit Forecast, by Country 2019 & 2032
- Table 57: Brazil AI in Pharma Industry Revenue (Million) Forecast, by Application 2019 & 2032
- Table 58: Brazil AI in Pharma Industry Volume (K Unit) Forecast, by Application 2019 & 2032
- Table 59: Argentina AI in Pharma Industry Revenue (Million) Forecast, by Application 2019 & 2032
- Table 60: Argentina AI in Pharma Industry Volume (K Unit) Forecast, by Application 2019 & 2032
- Table 61: Rest of South America AI in Pharma Industry Revenue (Million) Forecast, by Application 2019 & 2032
- Table 62: Rest of South America AI in Pharma Industry Volume (K Unit) Forecast, by Application 2019 & 2032
- Table 63: Global AI in Pharma Industry Revenue Million Forecast, by Technology 2019 & 2032
- Table 64: Global AI in Pharma Industry Volume K Unit Forecast, by Technology 2019 & 2032
- Table 65: Global AI in Pharma Industry Revenue Million Forecast, by Type 2019 & 2032
- Table 66: Global AI in Pharma Industry Volume K Unit Forecast, by Type 2019 & 2032
- Table 67: Global AI in Pharma Industry Revenue Million Forecast, by Application 2019 & 2032
- Table 68: Global AI in Pharma Industry Volume K Unit Forecast, by Application 2019 & 2032
- Table 69: Global AI in Pharma Industry Revenue Million Forecast, by Country 2019 & 2032
- Table 70: Global AI in Pharma Industry Volume K Unit Forecast, by Country 2019 & 2032
- Table 71: United States AI in Pharma Industry Revenue (Million) Forecast, by Application 2019 & 2032
- Table 72: United States AI in Pharma Industry Volume (K Unit) Forecast, by Application 2019 & 2032
- Table 73: Canada AI in Pharma Industry Revenue (Million) Forecast, by Application 2019 & 2032
- Table 74: Canada AI in Pharma Industry Volume (K Unit) Forecast, by Application 2019 & 2032
- Table 75: Mexico AI in Pharma Industry Revenue (Million) Forecast, by Application 2019 & 2032
- Table 76: Mexico AI in Pharma Industry Volume (K Unit) Forecast, by Application 2019 & 2032
- Table 77: Global AI in Pharma Industry Revenue Million Forecast, by Technology 2019 & 2032
- Table 78: Global AI in Pharma Industry Volume K Unit Forecast, by Technology 2019 & 2032
- Table 79: Global AI in Pharma Industry Revenue Million Forecast, by Type 2019 & 2032
- Table 80: Global AI in Pharma Industry Volume K Unit Forecast, by Type 2019 & 2032
- Table 81: Global AI in Pharma Industry Revenue Million Forecast, by Application 2019 & 2032
- Table 82: Global AI in Pharma Industry Volume K Unit Forecast, by Application 2019 & 2032
- Table 83: Global AI in Pharma Industry Revenue Million Forecast, by Country 2019 & 2032
- Table 84: Global AI in Pharma Industry Volume K Unit Forecast, by Country 2019 & 2032
- Table 85: Germany AI in Pharma Industry Revenue (Million) Forecast, by Application 2019 & 2032
- Table 86: Germany AI in Pharma Industry Volume (K Unit) Forecast, by Application 2019 & 2032
- Table 87: United Kingdom AI in Pharma Industry Revenue (Million) Forecast, by Application 2019 & 2032
- Table 88: United Kingdom AI in Pharma Industry Volume (K Unit) Forecast, by Application 2019 & 2032
- Table 89: France AI in Pharma Industry Revenue (Million) Forecast, by Application 2019 & 2032
- Table 90: France AI in Pharma Industry Volume (K Unit) Forecast, by Application 2019 & 2032
- Table 91: Italy AI in Pharma Industry Revenue (Million) Forecast, by Application 2019 & 2032
- Table 92: Italy AI in Pharma Industry Volume (K Unit) Forecast, by Application 2019 & 2032
- Table 93: Spain AI in Pharma Industry Revenue (Million) Forecast, by Application 2019 & 2032
- Table 94: Spain AI in Pharma Industry Volume (K Unit) Forecast, by Application 2019 & 2032
- Table 95: Rest of Europe AI in Pharma Industry Revenue (Million) Forecast, by Application 2019 & 2032
- Table 96: Rest of Europe AI in Pharma Industry Volume (K Unit) Forecast, by Application 2019 & 2032
- Table 97: Global AI in Pharma Industry Revenue Million Forecast, by Technology 2019 & 2032
- Table 98: Global AI in Pharma Industry Volume K Unit Forecast, by Technology 2019 & 2032
- Table 99: Global AI in Pharma Industry Revenue Million Forecast, by Type 2019 & 2032
- Table 100: Global AI in Pharma Industry Volume K Unit Forecast, by Type 2019 & 2032
- Table 101: Global AI in Pharma Industry Revenue Million Forecast, by Application 2019 & 2032
- Table 102: Global AI in Pharma Industry Volume K Unit Forecast, by Application 2019 & 2032
- Table 103: Global AI in Pharma Industry Revenue Million Forecast, by Country 2019 & 2032
- Table 104: Global AI in Pharma Industry Volume K Unit Forecast, by Country 2019 & 2032
- Table 105: China AI in Pharma Industry Revenue (Million) Forecast, by Application 2019 & 2032
- Table 106: China AI in Pharma Industry Volume (K Unit) Forecast, by Application 2019 & 2032
- Table 107: Japan AI in Pharma Industry Revenue (Million) Forecast, by Application 2019 & 2032
- Table 108: Japan AI in Pharma Industry Volume (K Unit) Forecast, by Application 2019 & 2032
- Table 109: India AI in Pharma Industry Revenue (Million) Forecast, by Application 2019 & 2032
- Table 110: India AI in Pharma Industry Volume (K Unit) Forecast, by Application 2019 & 2032
- Table 111: Australia AI in Pharma Industry Revenue (Million) Forecast, by Application 2019 & 2032
- Table 112: Australia AI in Pharma Industry Volume (K Unit) Forecast, by Application 2019 & 2032
- Table 113: South Korea AI in Pharma Industry Revenue (Million) Forecast, by Application 2019 & 2032
- Table 114: South Korea AI in Pharma Industry Volume (K Unit) Forecast, by Application 2019 & 2032
- Table 115: Rest of Asia Pacific AI in Pharma Industry Revenue (Million) Forecast, by Application 2019 & 2032
- Table 116: Rest of Asia Pacific AI in Pharma Industry Volume (K Unit) Forecast, by Application 2019 & 2032
- Table 117: Global AI in Pharma Industry Revenue Million Forecast, by Technology 2019 & 2032
- Table 118: Global AI in Pharma Industry Volume K Unit Forecast, by Technology 2019 & 2032
- Table 119: Global AI in Pharma Industry Revenue Million Forecast, by Type 2019 & 2032
- Table 120: Global AI in Pharma Industry Volume K Unit Forecast, by Type 2019 & 2032
- Table 121: Global AI in Pharma Industry Revenue Million Forecast, by Application 2019 & 2032
- Table 122: Global AI in Pharma Industry Volume K Unit Forecast, by Application 2019 & 2032
- Table 123: Global AI in Pharma Industry Revenue Million Forecast, by Country 2019 & 2032
- Table 124: Global AI in Pharma Industry Volume K Unit Forecast, by Country 2019 & 2032
- Table 125: GCC AI in Pharma Industry Revenue (Million) Forecast, by Application 2019 & 2032
- Table 126: GCC AI in Pharma Industry Volume (K Unit) Forecast, by Application 2019 & 2032
- Table 127: South Africa AI in Pharma Industry Revenue (Million) Forecast, by Application 2019 & 2032
- Table 128: South Africa AI in Pharma Industry Volume (K Unit) Forecast, by Application 2019 & 2032
- Table 129: Rest of Middle East and Africa AI in Pharma Industry Revenue (Million) Forecast, by Application 2019 & 2032
- Table 130: Rest of Middle East and Africa AI in Pharma Industry Volume (K Unit) Forecast, by Application 2019 & 2032
- Table 131: Global AI in Pharma Industry Revenue Million Forecast, by Technology 2019 & 2032
- Table 132: Global AI in Pharma Industry Volume K Unit Forecast, by Technology 2019 & 2032
- Table 133: Global AI in Pharma Industry Revenue Million Forecast, by Type 2019 & 2032
- Table 134: Global AI in Pharma Industry Volume K Unit Forecast, by Type 2019 & 2032
- Table 135: Global AI in Pharma Industry Revenue Million Forecast, by Application 2019 & 2032
- Table 136: Global AI in Pharma Industry Volume K Unit Forecast, by Application 2019 & 2032
- Table 137: Global AI in Pharma Industry Revenue Million Forecast, by Country 2019 & 2032
- Table 138: Global AI in Pharma Industry Volume K Unit Forecast, by Country 2019 & 2032
- Table 139: Brazil AI in Pharma Industry Revenue (Million) Forecast, by Application 2019 & 2032
- Table 140: Brazil AI in Pharma Industry Volume (K Unit) Forecast, by Application 2019 & 2032
- Table 141: Argentina AI in Pharma Industry Revenue (Million) Forecast, by Application 2019 & 2032
- Table 142: Argentina AI in Pharma Industry Volume (K Unit) Forecast, by Application 2019 & 2032
- Table 143: Rest of South America AI in Pharma Industry Revenue (Million) Forecast, by Application 2019 & 2032
- Table 144: Rest of South America AI in Pharma Industry Volume (K Unit) Forecast, by Application 2019 & 2032
Frequently Asked Questions
1. What is the projected Compound Annual Growth Rate (CAGR) of the AI in Pharma Industry?
The projected CAGR is approximately 42.68%.
2. Which companies are prominent players in the AI in Pharma Industry?
Key companies in the market include BenevolentAI, Cloud Pharmaceuticals Inc, Exscientia, Alphabet Inc (Isomorphic Labs), Insilico Medicine, Atomwise Inc, Deargen Inc, XtalPi Inc, Cyclica Inc, Euretos, Deep Genomics, InveniAI LLC.
3. What are the main segments of the AI in Pharma Industry?
The market segments include Technology, Type, Application.
4. Can you provide details about the market size?
The market size is estimated to be USD 3.05 Million as of 2022.
5. What are some drivers contributing to market growth?
Growing Number of Cross-industry Collaborations and Partnerships; Surge In Adoption of Artificial Intelligence (AI) for Clinical Trials; Increasing Need to Reduce Drug Discovery & Development Costs and Timelines.
6. What are the notable trends driving market growth?
Drug Discovery Segment is Expected to Witness Significant Growth in the Market Over the Forecast Period.
7. Are there any restraints impacting market growth?
Inadequate Availability of Skilled Professionals; Incompatible Healthcare IT Infrastructure.
8. Can you provide examples of recent developments in the market?
December 2022: Cyclica Inc and SK Chemicals Co., Ltd. entered an artificial intelligence (AI)-driven drug discovery and development partnership to develop therapies across a range of disease areas. Under the collaboration with SK Chemicals, Cyclica will deploy its robust, proprietary drug discovery platforms to identify novel drug candidates for challenging biological targets across therapeutic areas of mutual interest to Cyclica and SK Chemicals.
9. What pricing options are available for accessing the report?
Pricing options include single-user, multi-user, and enterprise licenses priced at USD 4750, USD 5250, and USD 8750 respectively.
10. Is the market size provided in terms of value or volume?
The market size is provided in terms of value, measured in Million and volume, measured in K Unit.
11. Are there any specific market keywords associated with the report?
Yes, the market keyword associated with the report is "AI in Pharma Industry," which aids in identifying and referencing the specific market segment covered.
12. How do I determine which pricing option suits my needs best?
The pricing options vary based on user requirements and access needs. Individual users may opt for single-user licenses, while businesses requiring broader access may choose multi-user or enterprise licenses for cost-effective access to the report.
13. Are there any additional resources or data provided in the AI in Pharma Industry report?
While the report offers comprehensive insights, it's advisable to review the specific contents or supplementary materials provided to ascertain if additional resources or data are available.
14. How can I stay updated on further developments or reports in the AI in Pharma Industry?
To stay informed about further developments, trends, and reports in the AI in Pharma Industry, consider subscribing to industry newsletters, following relevant companies and organizations, or regularly checking reputable industry news sources and publications.
Methodology
Step 1 - Identification of Relevant Samples Size from Population Database


Step 2 - Approaches for Defining Global Market Size (Value, Volume* & Price*)

Note*: In applicable scenarios
Step 3 - Data Sources
Primary Research
- Web Analytics
- Survey Reports
- Research Institute
- Latest Research Reports
- Opinion Leaders
Secondary Research
- Annual Reports
- White Paper
- Latest Press Release
- Industry Association
- Paid Database
- Investor Presentations

Step 4 - Data Triangulation
Involves using different sources of information in order to increase the validity of a study
These sources are likely to be stakeholders in a program - participants, other researchers, program staff, other community members, and so on.
Then we put all data in single framework & apply various statistical tools to find out the dynamic on the market.
During the analysis stage, feedback from the stakeholder groups would be compared to determine areas of agreement as well as areas of divergence


