
Key Insights
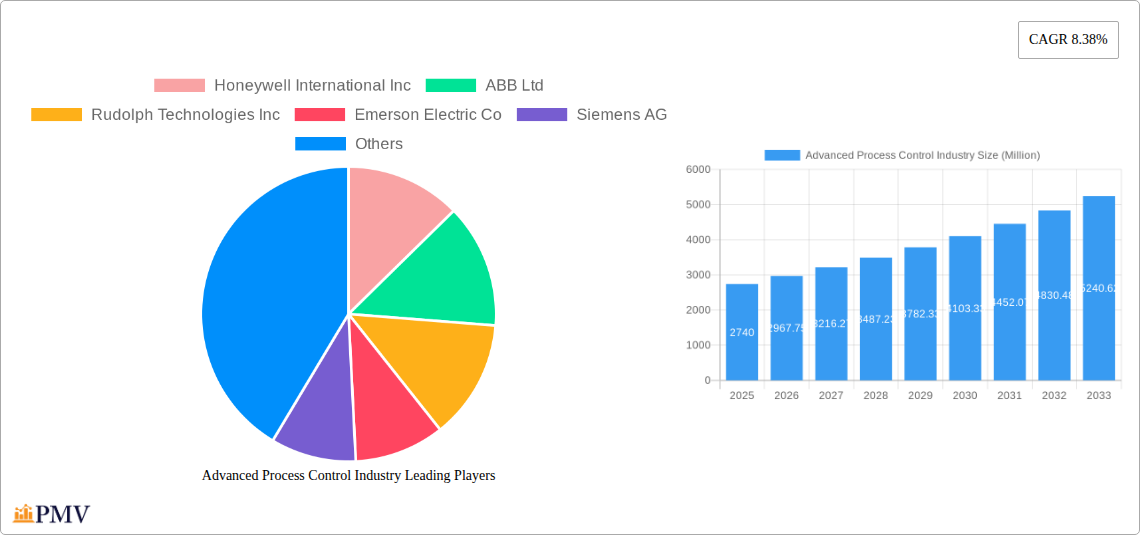
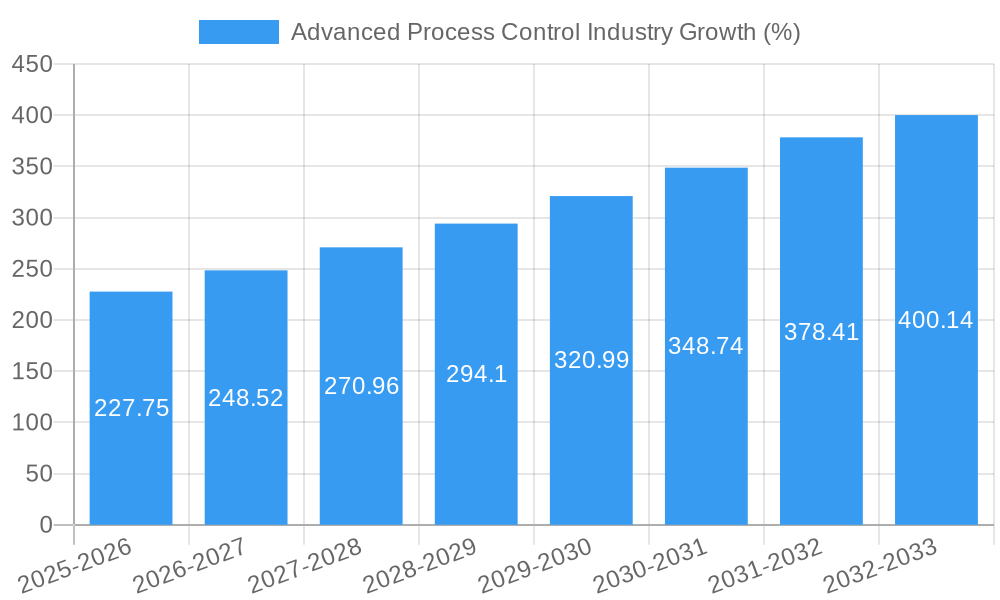
The Advanced Process Control (APC) industry is experiencing robust growth, projected to reach a market size of $2.74 billion in 2025, expanding at a compound annual growth rate (CAGR) of 8.38%. This expansion is driven by several key factors. The increasing need for enhanced operational efficiency and productivity across various industries, particularly oil and gas, petrochemicals, and pharmaceuticals, is a primary driver. These sectors are adopting APC solutions to optimize production processes, reduce waste, improve product quality, and enhance safety. The growing adoption of automation and Industry 4.0 technologies is further fueling market growth, enabling seamless integration of APC systems with existing infrastructure. Moreover, the rising demand for sophisticated control strategies like model predictive control (MPC) and advanced regulatory control (ARC) is contributing to this upward trend. Stringent environmental regulations and the need for sustainable operations also play a significant role, as APC systems offer precise control over emissions and resource consumption.
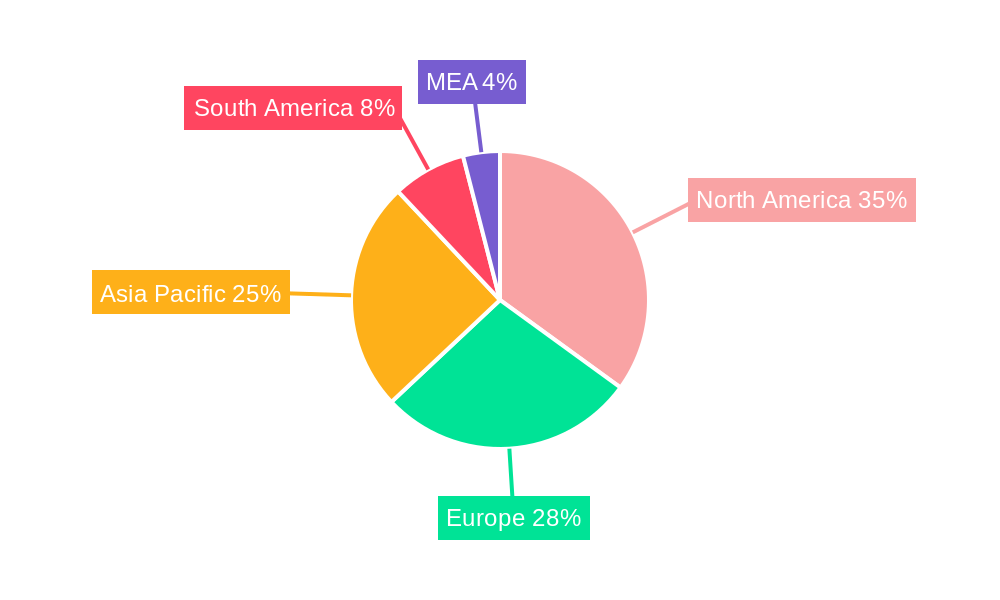
However, the market also faces some challenges. The high initial investment cost associated with implementing APC systems can act as a restraint, particularly for smaller companies. Furthermore, the complexity of integrating APC solutions into existing infrastructure and the need for specialized expertise can hinder adoption. Nevertheless, the long-term benefits of improved efficiency, reduced costs, and enhanced safety are expected to outweigh these challenges, ensuring continued growth of the APC market. The segmentation analysis reveals a strong demand across various end-user verticals, with North America and Asia-Pacific expected to dominate the market due to significant industrial activity and technological advancements in these regions. Competition is fierce, with major players such as Honeywell, ABB, Emerson, and Siemens constantly innovating and expanding their product portfolios to cater to the evolving needs of their customers.
Advanced Process Control Industry Market Report: 2019-2033
This comprehensive report provides a detailed analysis of the Advanced Process Control (APC) industry, projecting a market value of xx Million by 2033. The study covers the period from 2019 to 2033, with 2025 as the base and estimated year. It offers in-depth insights into market structure, competitive dynamics, dominant segments, technological advancements, and key growth drivers, enabling businesses to make informed strategic decisions.
Advanced Process Control Industry Market Structure & Competitive Dynamics
The Advanced Process Control market is characterized by a moderately concentrated structure, with key players like Honeywell International Inc, ABB Ltd, Emerson Electric Co, Siemens AG, and Rockwell Automation Inc holding significant market share. The market share of these top 5 companies is approximately xx%, indicating a competitive landscape with several significant players. The industry is witnessing increasing M&A activity, with deal values exceeding xx Million in the past five years, driven by the need to expand product portfolios and geographic reach. This consolidation trend is expected to continue, reshaping the competitive landscape in the coming years. Innovation ecosystems are thriving, particularly around advancements in artificial intelligence (AI), machine learning (ML), and digital twin technologies. Regulatory frameworks, particularly in sectors like oil and gas and pharmaceuticals, play a significant role in shaping market dynamics, requiring compliance with stringent safety and operational standards. Product substitutes are limited, primarily stemming from legacy control systems, but the ongoing technological advancements are increasingly favoring APC solutions. End-user trends favor integrated and automated solutions, increasing the demand for sophisticated APC systems.
- Market Concentration: High, with top 5 players holding xx% market share.
- M&A Activity: Significant, with deal values exceeding xx Million in the past 5 years.
- Innovation: Strong focus on AI, ML, and digital twin technologies.
- Regulatory Landscape: Stringent regulations impacting Oil & Gas, Pharma, and Chemical sectors.
- End-User Trends: Growing preference for integrated and automated solutions.
Advanced Process Control Industry Industry Trends & Insights
The Advanced Process Control industry is experiencing robust growth, driven by the increasing demand for improved efficiency, reduced operational costs, and enhanced product quality across diverse end-user verticals. The market is projected to register a Compound Annual Growth Rate (CAGR) of xx% during the forecast period (2025-2033). Technological advancements, such as the integration of AI and machine learning algorithms, are significantly impacting the industry, enabling real-time process optimization and predictive maintenance. Consumer preferences are shifting towards flexible, scalable, and easily integrable APC systems that can accommodate evolving operational needs. The competitive dynamics are intensifying, with established players investing heavily in research and development and expanding their product portfolios, while new entrants are leveraging innovative technologies to gain market share. Market penetration of APC systems is steadily increasing across different industries, driven by the compelling return on investment (ROI) offered by optimized processes and reduced downtime.
Dominant Markets & Segments in Advanced Process Control Industry
The Oil & Gas sector currently dominates the Advanced Process Control market, owing to the critical need for efficient resource management and stringent safety regulations. North America and Europe are the leading regions, fueled by robust industrial infrastructure and technological advancements. The Model Predictive Control (MPC) segment holds the largest market share by type, driven by its ability to optimize complex processes and improve overall efficiency.
- Leading Regions: North America, Europe
- Dominant End-user Vertical: Oil and Gas (due to its reliance on precise process control and high operational costs)
- Dominant Segment by Type: Model Predictive Control (MPC) (because of its advanced optimization capabilities)
Key Drivers:
- Economic Policies: Government incentives for industrial automation and digitalization.
- Infrastructure: Robust industrial infrastructure and the presence of major players.
- Technological Advancements: Continuous improvements in AI, ML, and sensor technologies.
Advanced Process Control Industry Product Innovations
Recent product innovations focus on enhancing system integration, improving user interfaces, and leveraging advanced analytics for predictive maintenance and process optimization. The integration of cloud-based platforms and the development of more user-friendly interfaces are key trends. New offerings are emphasizing scalability and flexibility to meet the specific requirements of diverse end-user verticals. These advancements enhance operational efficiency, reduce operational costs, and improve overall system reliability, providing significant competitive advantages.
Report Segmentation & Scope
The report segments the Advanced Process Control market by type (Advanced Regulatory Control, Model Predictive Control, Inferential Control, Sequential Control, and Compressor Control) and by end-user vertical (Oil and Gas, Petrochemical, Pharmaceutical, Food and Beverage, Energy and Power, Chemical, and Other End-user Verticals). Each segment's growth projections, market sizes, and competitive dynamics are detailed within the report. The Oil and Gas sector, for example, demonstrates substantial growth due to its need for optimization and safety. Similarly, the MPC segment shows significant potential given its advanced optimization capabilities.
Key Drivers of Advanced Process Control Industry Growth
The growth of the Advanced Process Control industry is driven by several factors, including the increasing demand for enhanced operational efficiency, stringent environmental regulations pushing for reduced emissions, and the rising adoption of Industry 4.0 technologies. The growing need to optimize complex processes, coupled with the availability of advanced analytics tools, is fueling the adoption of APC solutions. Government initiatives promoting digitalization within various industrial sectors further contribute to market growth.
Challenges in the Advanced Process Control Industry Sector
The Advanced Process Control industry faces several challenges, including the high initial investment costs associated with implementing APC systems, the complexity of integrating these systems into existing infrastructure, and the need for skilled personnel to operate and maintain these systems. Cybersecurity concerns also pose a significant challenge, requiring robust security measures to protect sensitive operational data. Supply chain disruptions and fluctuations in raw material costs can also impact profitability. These factors can collectively limit market expansion.
Leading Players in the Advanced Process Control Industry Market
- Honeywell International Inc
- ABB Ltd
- Rudolph Technologies Inc
- Emerson Electric Co
- Siemens AG
- General Electric Co
- Schneider Electric SE
- Rockwell Automation Inc
- Yokogawa Electric Corp
- Aspen Technology Inc
Key Developments in Advanced Process Control Industry Sector
- December 2023: Schneider Electric's collaboration with Power Investment Digital Division to explore the smart aluminum market highlights the expanding applications of APC in new sectors.
- October 2023: ABB's launch of the ABB Ability™ Expert Optimizer system demonstrates the increasing focus on energy efficiency and process optimization within the cement industry. The 3% reduction in thermal energy consumption at the Tokuyama Nanyo plant underscores the tangible benefits of advanced process control solutions.
Strategic Advanced Process Control Industry Market Outlook
The future of the Advanced Process Control industry appears promising, with continued growth driven by technological advancements and increasing demand across various sectors. Strategic opportunities exist in leveraging AI and ML for predictive maintenance, expanding into new and emerging markets, and developing more user-friendly and easily integrable APC systems. Focusing on cybersecurity and addressing skills gaps will be critical for long-term success. The integration of APC with other Industry 4.0 technologies will unlock further growth potential.
Advanced Process Control Industry Segmentation
-
1. Type
- 1.1. Advanced Regulatory Control
- 1.2. Model Predictive Control
- 1.3. Other Types
-
2. End-user Industry
- 2.1. Oil and Gas
- 2.2. Chemicals and Petrochemicals
- 2.3. Pharmaceutical
- 2.4. Food and Beverage
- 2.5. Energy and Power
- 2.6. Cement Industry
- 2.7. Metal Processing
- 2.8. Pulp and Paper
- 2.9. Other End-user Industries
Advanced Process Control Industry Segmentation By Geography
- 1. North America
- 2. Europe
- 3. Asia
- 4. Australia and New Zealand
- 5. Latin America
- 6. Middle East and Africa
Advanced Process Control Industry REPORT HIGHLIGHTS
| Aspects | Details |
|---|---|
| Study Period | 2019-2033 |
| Base Year | 2024 |
| Estimated Year | 2025 |
| Forecast Period | 2025-2033 |
| Historical Period | 2019-2024 |
| Growth Rate | CAGR of 8.38% from 2019-2033 |
| Segmentation |
|
Table of Contents
- 1. Introduction
- 1.1. Research Scope
- 1.2. Market Segmentation
- 1.3. Research Methodology
- 1.4. Definitions and Assumptions
- 2. Executive Summary
- 2.1. Introduction
- 3. Market Dynamics
- 3.1. Introduction
- 3.2. Market Drivers
- 3.2.1. Increasing Demand for Automation Solutions across Various Industries; Rising Safety and Security Concerns are Expected to Boost the Demand for APC Systems; Inclination of Enterprises Toward Energy-efficient Processes
- 3.3. Market Restrains
- 3.3.1. Associated Complexities Challenge the Market Growth
- 3.4. Market Trends
- 3.4.1. Oil and Gas is Expected to be the Largest Segment
- 4. Market Factor Analysis
- 4.1. Porters Five Forces
- 4.2. Supply/Value Chain
- 4.3. PESTEL analysis
- 4.4. Market Entropy
- 4.5. Patent/Trademark Analysis
- 5. Global Advanced Process Control Industry Analysis, Insights and Forecast, 2019-2031
- 5.1. Market Analysis, Insights and Forecast - by Type
- 5.1.1. Advanced Regulatory Control
- 5.1.2. Model Predictive Control
- 5.1.3. Other Types
- 5.2. Market Analysis, Insights and Forecast - by End-user Industry
- 5.2.1. Oil and Gas
- 5.2.2. Chemicals and Petrochemicals
- 5.2.3. Pharmaceutical
- 5.2.4. Food and Beverage
- 5.2.5. Energy and Power
- 5.2.6. Cement Industry
- 5.2.7. Metal Processing
- 5.2.8. Pulp and Paper
- 5.2.9. Other End-user Industries
- 5.3. Market Analysis, Insights and Forecast - by Region
- 5.3.1. North America
- 5.3.2. Europe
- 5.3.3. Asia
- 5.3.4. Australia and New Zealand
- 5.3.5. Latin America
- 5.3.6. Middle East and Africa
- 5.1. Market Analysis, Insights and Forecast - by Type
- 6. North America Advanced Process Control Industry Analysis, Insights and Forecast, 2019-2031
- 6.1. Market Analysis, Insights and Forecast - by Type
- 6.1.1. Advanced Regulatory Control
- 6.1.2. Model Predictive Control
- 6.1.3. Other Types
- 6.2. Market Analysis, Insights and Forecast - by End-user Industry
- 6.2.1. Oil and Gas
- 6.2.2. Chemicals and Petrochemicals
- 6.2.3. Pharmaceutical
- 6.2.4. Food and Beverage
- 6.2.5. Energy and Power
- 6.2.6. Cement Industry
- 6.2.7. Metal Processing
- 6.2.8. Pulp and Paper
- 6.2.9. Other End-user Industries
- 6.1. Market Analysis, Insights and Forecast - by Type
- 7. Europe Advanced Process Control Industry Analysis, Insights and Forecast, 2019-2031
- 7.1. Market Analysis, Insights and Forecast - by Type
- 7.1.1. Advanced Regulatory Control
- 7.1.2. Model Predictive Control
- 7.1.3. Other Types
- 7.2. Market Analysis, Insights and Forecast - by End-user Industry
- 7.2.1. Oil and Gas
- 7.2.2. Chemicals and Petrochemicals
- 7.2.3. Pharmaceutical
- 7.2.4. Food and Beverage
- 7.2.5. Energy and Power
- 7.2.6. Cement Industry
- 7.2.7. Metal Processing
- 7.2.8. Pulp and Paper
- 7.2.9. Other End-user Industries
- 7.1. Market Analysis, Insights and Forecast - by Type
- 8. Asia Advanced Process Control Industry Analysis, Insights and Forecast, 2019-2031
- 8.1. Market Analysis, Insights and Forecast - by Type
- 8.1.1. Advanced Regulatory Control
- 8.1.2. Model Predictive Control
- 8.1.3. Other Types
- 8.2. Market Analysis, Insights and Forecast - by End-user Industry
- 8.2.1. Oil and Gas
- 8.2.2. Chemicals and Petrochemicals
- 8.2.3. Pharmaceutical
- 8.2.4. Food and Beverage
- 8.2.5. Energy and Power
- 8.2.6. Cement Industry
- 8.2.7. Metal Processing
- 8.2.8. Pulp and Paper
- 8.2.9. Other End-user Industries
- 8.1. Market Analysis, Insights and Forecast - by Type
- 9. Australia and New Zealand Advanced Process Control Industry Analysis, Insights and Forecast, 2019-2031
- 9.1. Market Analysis, Insights and Forecast - by Type
- 9.1.1. Advanced Regulatory Control
- 9.1.2. Model Predictive Control
- 9.1.3. Other Types
- 9.2. Market Analysis, Insights and Forecast - by End-user Industry
- 9.2.1. Oil and Gas
- 9.2.2. Chemicals and Petrochemicals
- 9.2.3. Pharmaceutical
- 9.2.4. Food and Beverage
- 9.2.5. Energy and Power
- 9.2.6. Cement Industry
- 9.2.7. Metal Processing
- 9.2.8. Pulp and Paper
- 9.2.9. Other End-user Industries
- 9.1. Market Analysis, Insights and Forecast - by Type
- 10. Latin America Advanced Process Control Industry Analysis, Insights and Forecast, 2019-2031
- 10.1. Market Analysis, Insights and Forecast - by Type
- 10.1.1. Advanced Regulatory Control
- 10.1.2. Model Predictive Control
- 10.1.3. Other Types
- 10.2. Market Analysis, Insights and Forecast - by End-user Industry
- 10.2.1. Oil and Gas
- 10.2.2. Chemicals and Petrochemicals
- 10.2.3. Pharmaceutical
- 10.2.4. Food and Beverage
- 10.2.5. Energy and Power
- 10.2.6. Cement Industry
- 10.2.7. Metal Processing
- 10.2.8. Pulp and Paper
- 10.2.9. Other End-user Industries
- 10.1. Market Analysis, Insights and Forecast - by Type
- 11. Middle East and Africa Advanced Process Control Industry Analysis, Insights and Forecast, 2019-2031
- 11.1. Market Analysis, Insights and Forecast - by Type
- 11.1.1. Advanced Regulatory Control
- 11.1.2. Model Predictive Control
- 11.1.3. Other Types
- 11.2. Market Analysis, Insights and Forecast - by End-user Industry
- 11.2.1. Oil and Gas
- 11.2.2. Chemicals and Petrochemicals
- 11.2.3. Pharmaceutical
- 11.2.4. Food and Beverage
- 11.2.5. Energy and Power
- 11.2.6. Cement Industry
- 11.2.7. Metal Processing
- 11.2.8. Pulp and Paper
- 11.2.9. Other End-user Industries
- 11.1. Market Analysis, Insights and Forecast - by Type
- 12. North America Advanced Process Control Industry Analysis, Insights and Forecast, 2019-2031
- 12.1. Market Analysis, Insights and Forecast - By Country/Sub-region
- 12.1.1 United States
- 12.1.2 Canada
- 12.1.3 Mexico
- 13. Europe Advanced Process Control Industry Analysis, Insights and Forecast, 2019-2031
- 13.1. Market Analysis, Insights and Forecast - By Country/Sub-region
- 13.1.1 Germany
- 13.1.2 United Kingdom
- 13.1.3 France
- 13.1.4 Spain
- 13.1.5 Italy
- 13.1.6 Spain
- 13.1.7 Belgium
- 13.1.8 Netherland
- 13.1.9 Nordics
- 13.1.10 Rest of Europe
- 14. Asia Pacific Advanced Process Control Industry Analysis, Insights and Forecast, 2019-2031
- 14.1. Market Analysis, Insights and Forecast - By Country/Sub-region
- 14.1.1 China
- 14.1.2 Japan
- 14.1.3 India
- 14.1.4 South Korea
- 14.1.5 Southeast Asia
- 14.1.6 Australia
- 14.1.7 Indonesia
- 14.1.8 Phillipes
- 14.1.9 Singapore
- 14.1.10 Thailandc
- 14.1.11 Rest of Asia Pacific
- 15. South America Advanced Process Control Industry Analysis, Insights and Forecast, 2019-2031
- 15.1. Market Analysis, Insights and Forecast - By Country/Sub-region
- 15.1.1 Brazil
- 15.1.2 Argentina
- 15.1.3 Peru
- 15.1.4 Chile
- 15.1.5 Colombia
- 15.1.6 Ecuador
- 15.1.7 Venezuela
- 15.1.8 Rest of South America
- 16. North America Advanced Process Control Industry Analysis, Insights and Forecast, 2019-2031
- 16.1. Market Analysis, Insights and Forecast - By Country/Sub-region
- 16.1.1 United States
- 16.1.2 Canada
- 16.1.3 Mexico
- 17. MEA Advanced Process Control Industry Analysis, Insights and Forecast, 2019-2031
- 17.1. Market Analysis, Insights and Forecast - By Country/Sub-region
- 17.1.1 United Arab Emirates
- 17.1.2 Saudi Arabia
- 17.1.3 South Africa
- 17.1.4 Rest of Middle East and Africa
- 18. Competitive Analysis
- 18.1. Global Market Share Analysis 2024
- 18.2. Company Profiles
- 18.2.1 Honeywell International Inc
- 18.2.1.1. Overview
- 18.2.1.2. Products
- 18.2.1.3. SWOT Analysis
- 18.2.1.4. Recent Developments
- 18.2.1.5. Financials (Based on Availability)
- 18.2.2 ABB Ltd
- 18.2.2.1. Overview
- 18.2.2.2. Products
- 18.2.2.3. SWOT Analysis
- 18.2.2.4. Recent Developments
- 18.2.2.5. Financials (Based on Availability)
- 18.2.3 Rudolph Technologies Inc
- 18.2.3.1. Overview
- 18.2.3.2. Products
- 18.2.3.3. SWOT Analysis
- 18.2.3.4. Recent Developments
- 18.2.3.5. Financials (Based on Availability)
- 18.2.4 Emerson Electric Co
- 18.2.4.1. Overview
- 18.2.4.2. Products
- 18.2.4.3. SWOT Analysis
- 18.2.4.4. Recent Developments
- 18.2.4.5. Financials (Based on Availability)
- 18.2.5 Siemens AG
- 18.2.5.1. Overview
- 18.2.5.2. Products
- 18.2.5.3. SWOT Analysis
- 18.2.5.4. Recent Developments
- 18.2.5.5. Financials (Based on Availability)
- 18.2.6 General Electric Co
- 18.2.6.1. Overview
- 18.2.6.2. Products
- 18.2.6.3. SWOT Analysis
- 18.2.6.4. Recent Developments
- 18.2.6.5. Financials (Based on Availability)
- 18.2.7 Schneider Electric SE
- 18.2.7.1. Overview
- 18.2.7.2. Products
- 18.2.7.3. SWOT Analysis
- 18.2.7.4. Recent Developments
- 18.2.7.5. Financials (Based on Availability)
- 18.2.8 Rockwell Automation Inc
- 18.2.8.1. Overview
- 18.2.8.2. Products
- 18.2.8.3. SWOT Analysis
- 18.2.8.4. Recent Developments
- 18.2.8.5. Financials (Based on Availability)
- 18.2.9 Yokogawa Electric Corp
- 18.2.9.1. Overview
- 18.2.9.2. Products
- 18.2.9.3. SWOT Analysis
- 18.2.9.4. Recent Developments
- 18.2.9.5. Financials (Based on Availability)
- 18.2.10 Aspen Technology Inc
- 18.2.10.1. Overview
- 18.2.10.2. Products
- 18.2.10.3. SWOT Analysis
- 18.2.10.4. Recent Developments
- 18.2.10.5. Financials (Based on Availability)
- 18.2.1 Honeywell International Inc
List of Figures
- Figure 1: Global Advanced Process Control Industry Revenue Breakdown (Million, %) by Region 2024 & 2032
- Figure 2: North America Advanced Process Control Industry Revenue (Million), by Country 2024 & 2032
- Figure 3: North America Advanced Process Control Industry Revenue Share (%), by Country 2024 & 2032
- Figure 4: Europe Advanced Process Control Industry Revenue (Million), by Country 2024 & 2032
- Figure 5: Europe Advanced Process Control Industry Revenue Share (%), by Country 2024 & 2032
- Figure 6: Asia Pacific Advanced Process Control Industry Revenue (Million), by Country 2024 & 2032
- Figure 7: Asia Pacific Advanced Process Control Industry Revenue Share (%), by Country 2024 & 2032
- Figure 8: South America Advanced Process Control Industry Revenue (Million), by Country 2024 & 2032
- Figure 9: South America Advanced Process Control Industry Revenue Share (%), by Country 2024 & 2032
- Figure 10: North America Advanced Process Control Industry Revenue (Million), by Country 2024 & 2032
- Figure 11: North America Advanced Process Control Industry Revenue Share (%), by Country 2024 & 2032
- Figure 12: MEA Advanced Process Control Industry Revenue (Million), by Country 2024 & 2032
- Figure 13: MEA Advanced Process Control Industry Revenue Share (%), by Country 2024 & 2032
- Figure 14: North America Advanced Process Control Industry Revenue (Million), by Type 2024 & 2032
- Figure 15: North America Advanced Process Control Industry Revenue Share (%), by Type 2024 & 2032
- Figure 16: North America Advanced Process Control Industry Revenue (Million), by End-user Industry 2024 & 2032
- Figure 17: North America Advanced Process Control Industry Revenue Share (%), by End-user Industry 2024 & 2032
- Figure 18: North America Advanced Process Control Industry Revenue (Million), by Country 2024 & 2032
- Figure 19: North America Advanced Process Control Industry Revenue Share (%), by Country 2024 & 2032
- Figure 20: Europe Advanced Process Control Industry Revenue (Million), by Type 2024 & 2032
- Figure 21: Europe Advanced Process Control Industry Revenue Share (%), by Type 2024 & 2032
- Figure 22: Europe Advanced Process Control Industry Revenue (Million), by End-user Industry 2024 & 2032
- Figure 23: Europe Advanced Process Control Industry Revenue Share (%), by End-user Industry 2024 & 2032
- Figure 24: Europe Advanced Process Control Industry Revenue (Million), by Country 2024 & 2032
- Figure 25: Europe Advanced Process Control Industry Revenue Share (%), by Country 2024 & 2032
- Figure 26: Asia Advanced Process Control Industry Revenue (Million), by Type 2024 & 2032
- Figure 27: Asia Advanced Process Control Industry Revenue Share (%), by Type 2024 & 2032
- Figure 28: Asia Advanced Process Control Industry Revenue (Million), by End-user Industry 2024 & 2032
- Figure 29: Asia Advanced Process Control Industry Revenue Share (%), by End-user Industry 2024 & 2032
- Figure 30: Asia Advanced Process Control Industry Revenue (Million), by Country 2024 & 2032
- Figure 31: Asia Advanced Process Control Industry Revenue Share (%), by Country 2024 & 2032
- Figure 32: Australia and New Zealand Advanced Process Control Industry Revenue (Million), by Type 2024 & 2032
- Figure 33: Australia and New Zealand Advanced Process Control Industry Revenue Share (%), by Type 2024 & 2032
- Figure 34: Australia and New Zealand Advanced Process Control Industry Revenue (Million), by End-user Industry 2024 & 2032
- Figure 35: Australia and New Zealand Advanced Process Control Industry Revenue Share (%), by End-user Industry 2024 & 2032
- Figure 36: Australia and New Zealand Advanced Process Control Industry Revenue (Million), by Country 2024 & 2032
- Figure 37: Australia and New Zealand Advanced Process Control Industry Revenue Share (%), by Country 2024 & 2032
- Figure 38: Latin America Advanced Process Control Industry Revenue (Million), by Type 2024 & 2032
- Figure 39: Latin America Advanced Process Control Industry Revenue Share (%), by Type 2024 & 2032
- Figure 40: Latin America Advanced Process Control Industry Revenue (Million), by End-user Industry 2024 & 2032
- Figure 41: Latin America Advanced Process Control Industry Revenue Share (%), by End-user Industry 2024 & 2032
- Figure 42: Latin America Advanced Process Control Industry Revenue (Million), by Country 2024 & 2032
- Figure 43: Latin America Advanced Process Control Industry Revenue Share (%), by Country 2024 & 2032
- Figure 44: Middle East and Africa Advanced Process Control Industry Revenue (Million), by Type 2024 & 2032
- Figure 45: Middle East and Africa Advanced Process Control Industry Revenue Share (%), by Type 2024 & 2032
- Figure 46: Middle East and Africa Advanced Process Control Industry Revenue (Million), by End-user Industry 2024 & 2032
- Figure 47: Middle East and Africa Advanced Process Control Industry Revenue Share (%), by End-user Industry 2024 & 2032
- Figure 48: Middle East and Africa Advanced Process Control Industry Revenue (Million), by Country 2024 & 2032
- Figure 49: Middle East and Africa Advanced Process Control Industry Revenue Share (%), by Country 2024 & 2032
List of Tables
- Table 1: Global Advanced Process Control Industry Revenue Million Forecast, by Region 2019 & 2032
- Table 2: Global Advanced Process Control Industry Revenue Million Forecast, by Type 2019 & 2032
- Table 3: Global Advanced Process Control Industry Revenue Million Forecast, by End-user Industry 2019 & 2032
- Table 4: Global Advanced Process Control Industry Revenue Million Forecast, by Region 2019 & 2032
- Table 5: Global Advanced Process Control Industry Revenue Million Forecast, by Country 2019 & 2032
- Table 6: United States Advanced Process Control Industry Revenue (Million) Forecast, by Application 2019 & 2032
- Table 7: Canada Advanced Process Control Industry Revenue (Million) Forecast, by Application 2019 & 2032
- Table 8: Mexico Advanced Process Control Industry Revenue (Million) Forecast, by Application 2019 & 2032
- Table 9: Global Advanced Process Control Industry Revenue Million Forecast, by Country 2019 & 2032
- Table 10: Germany Advanced Process Control Industry Revenue (Million) Forecast, by Application 2019 & 2032
- Table 11: United Kingdom Advanced Process Control Industry Revenue (Million) Forecast, by Application 2019 & 2032
- Table 12: France Advanced Process Control Industry Revenue (Million) Forecast, by Application 2019 & 2032
- Table 13: Spain Advanced Process Control Industry Revenue (Million) Forecast, by Application 2019 & 2032
- Table 14: Italy Advanced Process Control Industry Revenue (Million) Forecast, by Application 2019 & 2032
- Table 15: Spain Advanced Process Control Industry Revenue (Million) Forecast, by Application 2019 & 2032
- Table 16: Belgium Advanced Process Control Industry Revenue (Million) Forecast, by Application 2019 & 2032
- Table 17: Netherland Advanced Process Control Industry Revenue (Million) Forecast, by Application 2019 & 2032
- Table 18: Nordics Advanced Process Control Industry Revenue (Million) Forecast, by Application 2019 & 2032
- Table 19: Rest of Europe Advanced Process Control Industry Revenue (Million) Forecast, by Application 2019 & 2032
- Table 20: Global Advanced Process Control Industry Revenue Million Forecast, by Country 2019 & 2032
- Table 21: China Advanced Process Control Industry Revenue (Million) Forecast, by Application 2019 & 2032
- Table 22: Japan Advanced Process Control Industry Revenue (Million) Forecast, by Application 2019 & 2032
- Table 23: India Advanced Process Control Industry Revenue (Million) Forecast, by Application 2019 & 2032
- Table 24: South Korea Advanced Process Control Industry Revenue (Million) Forecast, by Application 2019 & 2032
- Table 25: Southeast Asia Advanced Process Control Industry Revenue (Million) Forecast, by Application 2019 & 2032
- Table 26: Australia Advanced Process Control Industry Revenue (Million) Forecast, by Application 2019 & 2032
- Table 27: Indonesia Advanced Process Control Industry Revenue (Million) Forecast, by Application 2019 & 2032
- Table 28: Phillipes Advanced Process Control Industry Revenue (Million) Forecast, by Application 2019 & 2032
- Table 29: Singapore Advanced Process Control Industry Revenue (Million) Forecast, by Application 2019 & 2032
- Table 30: Thailandc Advanced Process Control Industry Revenue (Million) Forecast, by Application 2019 & 2032
- Table 31: Rest of Asia Pacific Advanced Process Control Industry Revenue (Million) Forecast, by Application 2019 & 2032
- Table 32: Global Advanced Process Control Industry Revenue Million Forecast, by Country 2019 & 2032
- Table 33: Brazil Advanced Process Control Industry Revenue (Million) Forecast, by Application 2019 & 2032
- Table 34: Argentina Advanced Process Control Industry Revenue (Million) Forecast, by Application 2019 & 2032
- Table 35: Peru Advanced Process Control Industry Revenue (Million) Forecast, by Application 2019 & 2032
- Table 36: Chile Advanced Process Control Industry Revenue (Million) Forecast, by Application 2019 & 2032
- Table 37: Colombia Advanced Process Control Industry Revenue (Million) Forecast, by Application 2019 & 2032
- Table 38: Ecuador Advanced Process Control Industry Revenue (Million) Forecast, by Application 2019 & 2032
- Table 39: Venezuela Advanced Process Control Industry Revenue (Million) Forecast, by Application 2019 & 2032
- Table 40: Rest of South America Advanced Process Control Industry Revenue (Million) Forecast, by Application 2019 & 2032
- Table 41: Global Advanced Process Control Industry Revenue Million Forecast, by Country 2019 & 2032
- Table 42: United States Advanced Process Control Industry Revenue (Million) Forecast, by Application 2019 & 2032
- Table 43: Canada Advanced Process Control Industry Revenue (Million) Forecast, by Application 2019 & 2032
- Table 44: Mexico Advanced Process Control Industry Revenue (Million) Forecast, by Application 2019 & 2032
- Table 45: Global Advanced Process Control Industry Revenue Million Forecast, by Country 2019 & 2032
- Table 46: United Arab Emirates Advanced Process Control Industry Revenue (Million) Forecast, by Application 2019 & 2032
- Table 47: Saudi Arabia Advanced Process Control Industry Revenue (Million) Forecast, by Application 2019 & 2032
- Table 48: South Africa Advanced Process Control Industry Revenue (Million) Forecast, by Application 2019 & 2032
- Table 49: Rest of Middle East and Africa Advanced Process Control Industry Revenue (Million) Forecast, by Application 2019 & 2032
- Table 50: Global Advanced Process Control Industry Revenue Million Forecast, by Type 2019 & 2032
- Table 51: Global Advanced Process Control Industry Revenue Million Forecast, by End-user Industry 2019 & 2032
- Table 52: Global Advanced Process Control Industry Revenue Million Forecast, by Country 2019 & 2032
- Table 53: Global Advanced Process Control Industry Revenue Million Forecast, by Type 2019 & 2032
- Table 54: Global Advanced Process Control Industry Revenue Million Forecast, by End-user Industry 2019 & 2032
- Table 55: Global Advanced Process Control Industry Revenue Million Forecast, by Country 2019 & 2032
- Table 56: Global Advanced Process Control Industry Revenue Million Forecast, by Type 2019 & 2032
- Table 57: Global Advanced Process Control Industry Revenue Million Forecast, by End-user Industry 2019 & 2032
- Table 58: Global Advanced Process Control Industry Revenue Million Forecast, by Country 2019 & 2032
- Table 59: Global Advanced Process Control Industry Revenue Million Forecast, by Type 2019 & 2032
- Table 60: Global Advanced Process Control Industry Revenue Million Forecast, by End-user Industry 2019 & 2032
- Table 61: Global Advanced Process Control Industry Revenue Million Forecast, by Country 2019 & 2032
- Table 62: Global Advanced Process Control Industry Revenue Million Forecast, by Type 2019 & 2032
- Table 63: Global Advanced Process Control Industry Revenue Million Forecast, by End-user Industry 2019 & 2032
- Table 64: Global Advanced Process Control Industry Revenue Million Forecast, by Country 2019 & 2032
- Table 65: Global Advanced Process Control Industry Revenue Million Forecast, by Type 2019 & 2032
- Table 66: Global Advanced Process Control Industry Revenue Million Forecast, by End-user Industry 2019 & 2032
- Table 67: Global Advanced Process Control Industry Revenue Million Forecast, by Country 2019 & 2032
Frequently Asked Questions
1. What is the projected Compound Annual Growth Rate (CAGR) of the Advanced Process Control Industry?
The projected CAGR is approximately 8.38%.
2. Which companies are prominent players in the Advanced Process Control Industry?
Key companies in the market include Honeywell International Inc, ABB Ltd, Rudolph Technologies Inc, Emerson Electric Co, Siemens AG, General Electric Co, Schneider Electric SE, Rockwell Automation Inc, Yokogawa Electric Corp, Aspen Technology Inc.
3. What are the main segments of the Advanced Process Control Industry?
The market segments include Type, End-user Industry.
4. Can you provide details about the market size?
The market size is estimated to be USD 2.74 Million as of 2022.
5. What are some drivers contributing to market growth?
Increasing Demand for Automation Solutions across Various Industries; Rising Safety and Security Concerns are Expected to Boost the Demand for APC Systems; Inclination of Enterprises Toward Energy-efficient Processes.
6. What are the notable trends driving market growth?
Oil and Gas is Expected to be the Largest Segment.
7. Are there any restraints impacting market growth?
Associated Complexities Challenge the Market Growth.
8. Can you provide examples of recent developments in the market?
December 2023: Schneider Electric collaborated with National Power Investment Group Digital Technology Co. Ltd (hereafter referred to as "Power Investment Digital Division") to jointly explore the smart aluminum (electrolytic aluminum, alumina) market. As part of the agreement, Schneider Electric and Power Investment Data will collaborate extensively in smart factories and smart manufacturing based on their vast accumulation and application experience in new-generation information technology and digital technology.
9. What pricing options are available for accessing the report?
Pricing options include single-user, multi-user, and enterprise licenses priced at USD 4750, USD 5250, and USD 8750 respectively.
10. Is the market size provided in terms of value or volume?
The market size is provided in terms of value, measured in Million.
11. Are there any specific market keywords associated with the report?
Yes, the market keyword associated with the report is "Advanced Process Control Industry," which aids in identifying and referencing the specific market segment covered.
12. How do I determine which pricing option suits my needs best?
The pricing options vary based on user requirements and access needs. Individual users may opt for single-user licenses, while businesses requiring broader access may choose multi-user or enterprise licenses for cost-effective access to the report.
13. Are there any additional resources or data provided in the Advanced Process Control Industry report?
While the report offers comprehensive insights, it's advisable to review the specific contents or supplementary materials provided to ascertain if additional resources or data are available.
14. How can I stay updated on further developments or reports in the Advanced Process Control Industry?
To stay informed about further developments, trends, and reports in the Advanced Process Control Industry, consider subscribing to industry newsletters, following relevant companies and organizations, or regularly checking reputable industry news sources and publications.
Methodology
Step 1 - Identification of Relevant Samples Size from Population Database


Step 2 - Approaches for Defining Global Market Size (Value, Volume* & Price*)

Note*: In applicable scenarios
Step 3 - Data Sources
Primary Research
- Web Analytics
- Survey Reports
- Research Institute
- Latest Research Reports
- Opinion Leaders
Secondary Research
- Annual Reports
- White Paper
- Latest Press Release
- Industry Association
- Paid Database
- Investor Presentations

Step 4 - Data Triangulation
Involves using different sources of information in order to increase the validity of a study
These sources are likely to be stakeholders in a program - participants, other researchers, program staff, other community members, and so on.
Then we put all data in single framework & apply various statistical tools to find out the dynamic on the market.
During the analysis stage, feedback from the stakeholder groups would be compared to determine areas of agreement as well as areas of divergence


