
Key Insights
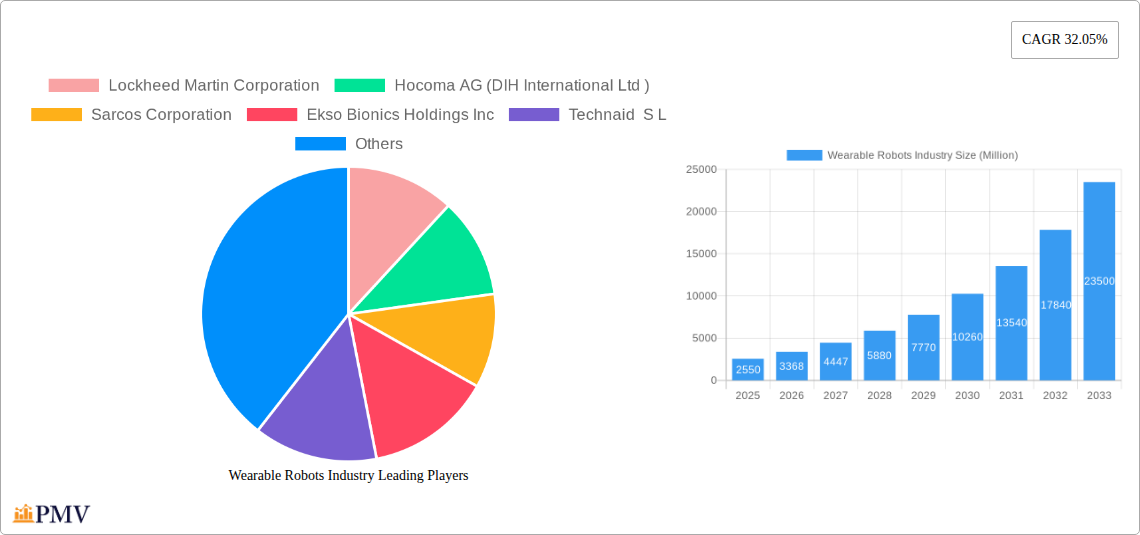
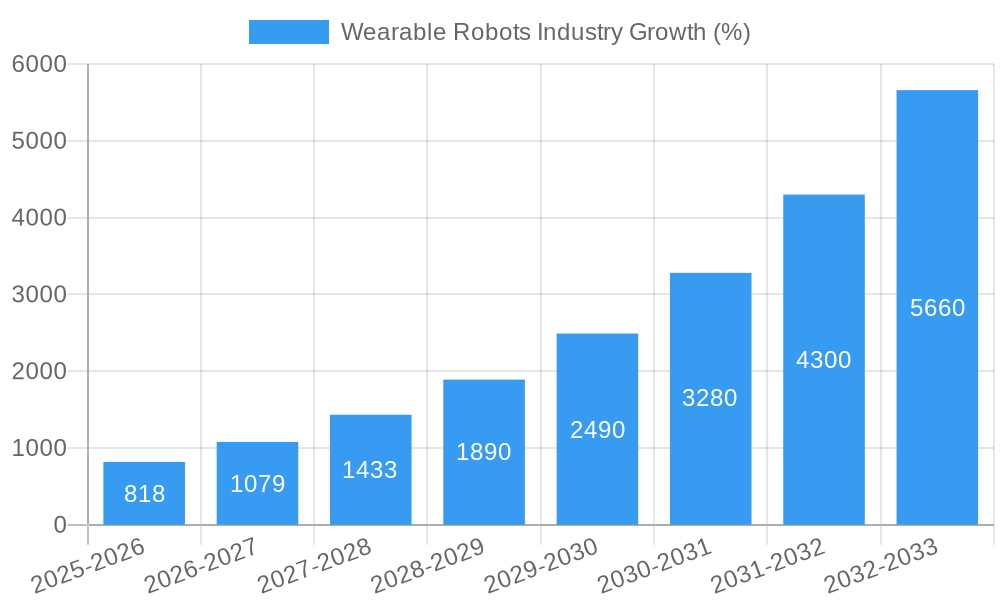
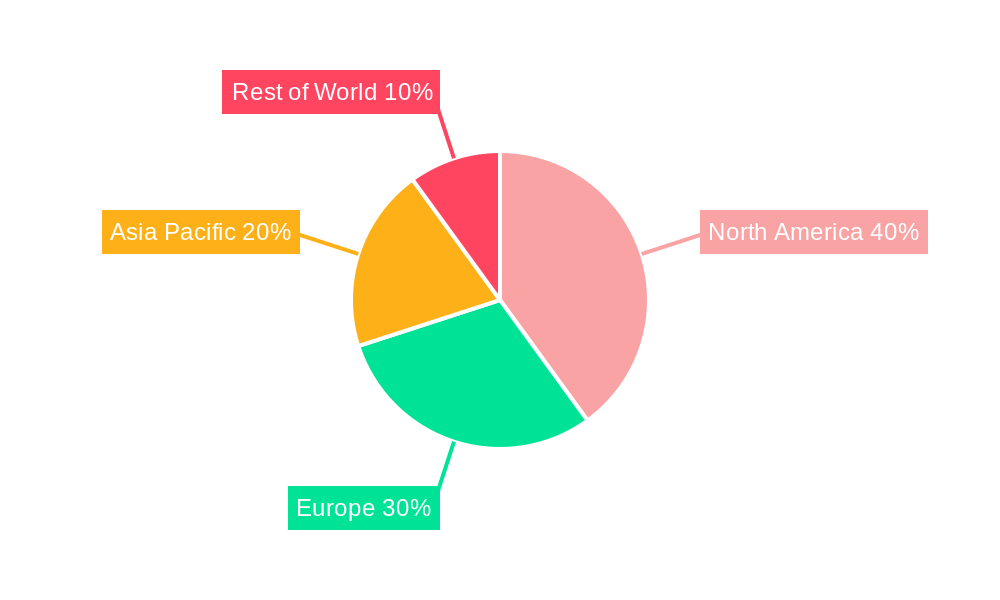
The global wearable robots market, valued at $2.55 billion in 2025, is projected to experience robust growth, exhibiting a compound annual growth rate (CAGR) of 32.05% from 2025 to 2033. This rapid expansion is driven by several key factors. Increasing demand for assistive devices in the healthcare sector, particularly for rehabilitation and elderly care, significantly fuels market growth. The rising prevalence of age-related physical impairments and the growing geriatric population globally contribute to this demand. Furthermore, the military and defense sectors are increasingly adopting wearable robots for enhanced soldier capabilities, boosting market size. Industrial applications, including material handling and construction, also contribute to market expansion, as exoskeletons improve worker safety and productivity by reducing strain injuries. Technological advancements, such as improved sensor technology, enhanced power sources, and more intuitive control systems, are further accelerating market growth. The market is segmented by type (powered and passive exoskeletons) and end-user industry (healthcare, military & defense, industrial, and others). Powered exoskeletons currently dominate the market due to their superior capabilities, but passive exoskeletons are gaining traction due to their lower cost and simpler design. North America and Europe are currently leading the market, driven by early adoption and strong regulatory frameworks, but the Asia-Pacific region is expected to experience substantial growth in the coming years due to increasing industrialization and rising disposable incomes.
Competition in the wearable robots market is intense, with key players such as Lockheed Martin, Hocoma AG, Sarcos Corporation, Ekso Bionics, and Cyberdyne leading the innovation and market share. These companies are focusing on product development, strategic partnerships, and geographic expansion to maintain a competitive edge. Future growth will depend on ongoing technological advancements, addressing challenges related to cost and accessibility, and navigating regulatory hurdles in various regions. The market is expected to witness increased consolidation through mergers and acquisitions as companies strive for larger market share and broader product portfolios. Factors such as the high initial investment costs and potential safety concerns could act as restraints on market growth, but the overall market outlook remains exceptionally positive, indicating significant potential for future expansion.
Wearable Robots Industry: A Comprehensive Market Report (2019-2033)
This in-depth report provides a comprehensive analysis of the Wearable Robots industry, offering invaluable insights for businesses, investors, and researchers. The study period covers 2019-2033, with 2025 as the base and estimated year. The report forecasts market trends from 2025-2033, analyzing historical data from 2019-2024. The global wearable robots market is projected to reach xx Million by 2033, exhibiting a CAGR of xx% during the forecast period. This report delves into key market segments, competitive dynamics, and future growth opportunities, providing actionable intelligence for strategic decision-making.
Wearable Robots Industry Market Structure & Competitive Dynamics
The Wearable Robots market is characterized by a moderately concentrated landscape, with several key players vying for market share. The market structure is influenced by factors including technological innovation, stringent regulatory frameworks (particularly in healthcare), the emergence of substitute technologies, and evolving end-user preferences. Significant M&A activity has shaped the competitive dynamics, with deal values reaching xx Million in recent years. Major players such as Lockheed Martin Corporation, Hocoma AG (DIH International Ltd), Sarcos Corporation, and Ekso Bionics Holdings Inc., hold significant market share, constantly innovating to maintain their competitive edge. Market share data for 2024 suggests that the top 5 companies collectively hold approximately xx% of the global market.
- Market Concentration: Moderately concentrated, with a few dominant players and several niche players.
- Innovation Ecosystems: Robust, driven by advancements in robotics, sensors, and AI.
- Regulatory Frameworks: Stringent, particularly in the healthcare segment, impacting product approvals and market entry.
- Product Substitutes: Limited, but alternative assistive technologies pose some competitive pressure.
- End-User Trends: Increasing demand for enhanced mobility and rehabilitation solutions across healthcare, industrial, and military applications.
- M&A Activities: Significant activity observed, with deals focused on expanding product portfolios and market reach. Examples include (but are not limited to) partnerships focusing on distribution rights and technological collaborations.
Wearable Robots Industry Industry Trends & Insights
The Wearable Robots market is experiencing robust growth, driven by several factors. The increasing prevalence of age-related mobility impairments and neurological disorders is fueling demand for assistive devices in the healthcare sector. Simultaneously, the industrial sector is adopting exoskeletons to enhance worker safety and productivity, reducing workplace injuries. Technological advancements, particularly in areas such as artificial intelligence, miniaturization, and improved power sources, are driving product innovation and enhancing performance. Consumer preferences are shifting towards lighter, more comfortable, and user-friendly designs with improved functionalities. The market also witnesses intense competition, with companies focusing on product differentiation and strategic partnerships to gain a competitive edge. The market penetration rate for wearable robots in the healthcare sector is estimated at approximately xx% in 2025, while it is projected to reach xx% by 2033.
Dominant Markets & Segments in Wearable Robots Industry
The Healthcare segment dominates the Wearable Robots market, driven by the rising prevalence of chronic diseases and an aging population. The North American region shows strong market dominance, fueled by robust healthcare infrastructure and high technological adoption rates. Within the "By Type" segmentation, Powered Exoskeletons holds a larger market share compared to Passive Exoskeletons, due to their advanced functionalities and wider range of applications.
- Key Drivers for Healthcare Segment:
- Increasing geriatric population.
- Rising incidence of neurological disorders.
- Growing demand for rehabilitation solutions.
- Favorable regulatory environment in key regions.
- Key Drivers for North American Region:
- High technological adoption rate.
- Well-developed healthcare infrastructure.
- Robust R&D investments.
- Favorable reimbursement policies.
- Powered Exoskeletons Dominance:
- Enhanced functionalities.
- Wider range of applications.
- Continuous technological improvements.
Wearable Robots Industry Product Innovations
Recent innovations in wearable robots include advancements in sensor technology, improved power sources, and more intuitive control systems. These developments enhance the comfort, performance, and usability of exoskeletons, expanding their applications across various sectors. The focus is on creating lighter, more adaptable, and affordable devices with enhanced safety features. Market fit is driven by aligning product features with specific user needs in diverse environments, from healthcare settings to industrial workplaces.
Report Segmentation & Scope
The report segments the Wearable Robots market by Type (Powered Exoskeletons and Passive Exoskeletons) and End-user Industry (Healthcare, Military and Defense, Industrial, and Other End-user Industries). The Healthcare segment is projected to experience the highest growth rate, driven by increasing demand for rehabilitation and assistive technologies. The Powered Exoskeletons segment is anticipated to maintain its dominant position due to superior functionality. The market is geographically segmented into major regions and countries, offering insights into regional market dynamics and growth projections. Competitive landscapes are analyzed for each segment, highlighting key players, their market share, and competitive strategies.
Key Drivers of Wearable Robots Industry Growth
Technological advancements, including improvements in battery life, sensor technology, and control algorithms, are key drivers of market growth. The rising prevalence of chronic diseases and the aging population are fueling demand, particularly in the healthcare sector. Government initiatives and regulatory support aimed at promoting technological innovation and assistive technologies also contribute to market expansion. Furthermore, increasing investments in research and development within the robotics sector further fuel this expansion.
Challenges in the Wearable Robots Industry Sector
High production costs and the complexity of manufacturing wearable robots pose challenges to market expansion. Stringent regulatory hurdles, especially in the healthcare segment, can delay product approvals and market entry. The need for skilled labor in manufacturing and maintenance adds to operational complexities. Competitive pressure from emerging players and alternative assistive technologies also present challenges for established companies. The overall impact of these challenges is estimated to suppress the market growth by approximately xx% during the forecast period.
Leading Players in the Wearable Robots Industry Market
- Lockheed Martin Corporation
- Hocoma AG (DIH International Ltd)
- Sarcos Corporation
- Ekso Bionics Holdings Inc
- Technaid S L
- Cyberdyne Inc
- Skelex
- ATOUN Inc
- Honda Motor Co Ltd
- ReWalk Robotics Inc
Key Developments in Wearable Robots Industry Sector
- November 2021: Rewalk Robotics Ltd received a 'Breakthrough Designation' from the FDA for its ReBoot exo-suit.
- March 2021: DIH International Limited partnered with Reha technology to distribute rehabilitation robotics products.
Strategic Wearable Robots Industry Market Outlook
The Wearable Robots market presents significant growth opportunities, driven by ongoing technological advancements and the increasing demand for assistive and rehabilitative technologies. Strategic partnerships, focused R&D investments, and expansion into new geographical markets will be crucial for achieving sustained growth. Companies that prioritize user experience, product innovation, and cost optimization will gain a competitive advantage. The market is poised for significant expansion across diverse sectors, promising considerable returns for investors and stakeholders.
Wearable Robots Industry Segmentation
-
1. Type
- 1.1. Powered Exoskeletons
- 1.2. Passive Exoskeletons
-
2. End-user Industry
- 2.1. Healthcare
- 2.2. Military and Defense
- 2.3. Industrial
- 2.4. Other End-user Industries
Wearable Robots Industry Segmentation By Geography
- 1. North America
- 2. Europe
- 3. Asia Pacific
- 4. Rest of the World
Wearable Robots Industry REPORT HIGHLIGHTS
| Aspects | Details |
|---|---|
| Study Period | 2019-2033 |
| Base Year | 2024 |
| Estimated Year | 2025 |
| Forecast Period | 2025-2033 |
| Historical Period | 2019-2024 |
| Growth Rate | CAGR of 32.05% from 2019-2033 |
| Segmentation |
|
Table of Contents
- 1. Introduction
- 1.1. Research Scope
- 1.2. Market Segmentation
- 1.3. Research Methodology
- 1.4. Definitions and Assumptions
- 2. Executive Summary
- 2.1. Introduction
- 3. Market Dynamics
- 3.1. Introduction
- 3.2. Market Drivers
- 3.2.1. Increasing Demand for Robotic Rehabilitation in Healthcare Industry; Growing Investment in the Development of the Exoskeleton Technology
- 3.3. Market Restrains
- 3.3.1. High Cost of the Equipment
- 3.4. Market Trends
- 3.4.1. Healthcare is Expected to Hold a Significant Share
- 4. Market Factor Analysis
- 4.1. Porters Five Forces
- 4.2. Supply/Value Chain
- 4.3. PESTEL analysis
- 4.4. Market Entropy
- 4.5. Patent/Trademark Analysis
- 5. Global Wearable Robots Industry Analysis, Insights and Forecast, 2019-2031
- 5.1. Market Analysis, Insights and Forecast - by Type
- 5.1.1. Powered Exoskeletons
- 5.1.2. Passive Exoskeletons
- 5.2. Market Analysis, Insights and Forecast - by End-user Industry
- 5.2.1. Healthcare
- 5.2.2. Military and Defense
- 5.2.3. Industrial
- 5.2.4. Other End-user Industries
- 5.3. Market Analysis, Insights and Forecast - by Region
- 5.3.1. North America
- 5.3.2. Europe
- 5.3.3. Asia Pacific
- 5.3.4. Rest of the World
- 5.1. Market Analysis, Insights and Forecast - by Type
- 6. North America Wearable Robots Industry Analysis, Insights and Forecast, 2019-2031
- 6.1. Market Analysis, Insights and Forecast - by Type
- 6.1.1. Powered Exoskeletons
- 6.1.2. Passive Exoskeletons
- 6.2. Market Analysis, Insights and Forecast - by End-user Industry
- 6.2.1. Healthcare
- 6.2.2. Military and Defense
- 6.2.3. Industrial
- 6.2.4. Other End-user Industries
- 6.1. Market Analysis, Insights and Forecast - by Type
- 7. Europe Wearable Robots Industry Analysis, Insights and Forecast, 2019-2031
- 7.1. Market Analysis, Insights and Forecast - by Type
- 7.1.1. Powered Exoskeletons
- 7.1.2. Passive Exoskeletons
- 7.2. Market Analysis, Insights and Forecast - by End-user Industry
- 7.2.1. Healthcare
- 7.2.2. Military and Defense
- 7.2.3. Industrial
- 7.2.4. Other End-user Industries
- 7.1. Market Analysis, Insights and Forecast - by Type
- 8. Asia Pacific Wearable Robots Industry Analysis, Insights and Forecast, 2019-2031
- 8.1. Market Analysis, Insights and Forecast - by Type
- 8.1.1. Powered Exoskeletons
- 8.1.2. Passive Exoskeletons
- 8.2. Market Analysis, Insights and Forecast - by End-user Industry
- 8.2.1. Healthcare
- 8.2.2. Military and Defense
- 8.2.3. Industrial
- 8.2.4. Other End-user Industries
- 8.1. Market Analysis, Insights and Forecast - by Type
- 9. Rest of the World Wearable Robots Industry Analysis, Insights and Forecast, 2019-2031
- 9.1. Market Analysis, Insights and Forecast - by Type
- 9.1.1. Powered Exoskeletons
- 9.1.2. Passive Exoskeletons
- 9.2. Market Analysis, Insights and Forecast - by End-user Industry
- 9.2.1. Healthcare
- 9.2.2. Military and Defense
- 9.2.3. Industrial
- 9.2.4. Other End-user Industries
- 9.1. Market Analysis, Insights and Forecast - by Type
- 10. North America Wearable Robots Industry Analysis, Insights and Forecast, 2019-2031
- 10.1. Market Analysis, Insights and Forecast - By Country/Sub-region
- 10.1.1 United States
- 10.1.2 Canada
- 10.1.3 Mexico
- 11. Europe Wearable Robots Industry Analysis, Insights and Forecast, 2019-2031
- 11.1. Market Analysis, Insights and Forecast - By Country/Sub-region
- 11.1.1 Germany
- 11.1.2 United Kingdom
- 11.1.3 France
- 11.1.4 Spain
- 11.1.5 Italy
- 11.1.6 Spain
- 11.1.7 Belgium
- 11.1.8 Netherland
- 11.1.9 Nordics
- 11.1.10 Rest of Europe
- 12. Asia Pacific Wearable Robots Industry Analysis, Insights and Forecast, 2019-2031
- 12.1. Market Analysis, Insights and Forecast - By Country/Sub-region
- 12.1.1 China
- 12.1.2 Japan
- 12.1.3 India
- 12.1.4 South Korea
- 12.1.5 Southeast Asia
- 12.1.6 Australia
- 12.1.7 Indonesia
- 12.1.8 Phillipes
- 12.1.9 Singapore
- 12.1.10 Thailandc
- 12.1.11 Rest of Asia Pacific
- 13. South America Wearable Robots Industry Analysis, Insights and Forecast, 2019-2031
- 13.1. Market Analysis, Insights and Forecast - By Country/Sub-region
- 13.1.1 Brazil
- 13.1.2 Argentina
- 13.1.3 Peru
- 13.1.4 Chile
- 13.1.5 Colombia
- 13.1.6 Ecuador
- 13.1.7 Venezuela
- 13.1.8 Rest of South America
- 14. North America Wearable Robots Industry Analysis, Insights and Forecast, 2019-2031
- 14.1. Market Analysis, Insights and Forecast - By Country/Sub-region
- 14.1.1 United States
- 14.1.2 Canada
- 14.1.3 Mexico
- 15. MEA Wearable Robots Industry Analysis, Insights and Forecast, 2019-2031
- 15.1. Market Analysis, Insights and Forecast - By Country/Sub-region
- 15.1.1 United Arab Emirates
- 15.1.2 Saudi Arabia
- 15.1.3 South Africa
- 15.1.4 Rest of Middle East and Africa
- 16. Competitive Analysis
- 16.1. Global Market Share Analysis 2024
- 16.2. Company Profiles
- 16.2.1 Lockheed Martin Corporation
- 16.2.1.1. Overview
- 16.2.1.2. Products
- 16.2.1.3. SWOT Analysis
- 16.2.1.4. Recent Developments
- 16.2.1.5. Financials (Based on Availability)
- 16.2.2 Hocoma AG (DIH International Ltd )
- 16.2.2.1. Overview
- 16.2.2.2. Products
- 16.2.2.3. SWOT Analysis
- 16.2.2.4. Recent Developments
- 16.2.2.5. Financials (Based on Availability)
- 16.2.3 Sarcos Corporation
- 16.2.3.1. Overview
- 16.2.3.2. Products
- 16.2.3.3. SWOT Analysis
- 16.2.3.4. Recent Developments
- 16.2.3.5. Financials (Based on Availability)
- 16.2.4 Ekso Bionics Holdings Inc
- 16.2.4.1. Overview
- 16.2.4.2. Products
- 16.2.4.3. SWOT Analysis
- 16.2.4.4. Recent Developments
- 16.2.4.5. Financials (Based on Availability)
- 16.2.5 Technaid S L
- 16.2.5.1. Overview
- 16.2.5.2. Products
- 16.2.5.3. SWOT Analysis
- 16.2.5.4. Recent Developments
- 16.2.5.5. Financials (Based on Availability)
- 16.2.6 Cyberdyne Inc
- 16.2.6.1. Overview
- 16.2.6.2. Products
- 16.2.6.3. SWOT Analysis
- 16.2.6.4. Recent Developments
- 16.2.6.5. Financials (Based on Availability)
- 16.2.7 Skelex
- 16.2.7.1. Overview
- 16.2.7.2. Products
- 16.2.7.3. SWOT Analysis
- 16.2.7.4. Recent Developments
- 16.2.7.5. Financials (Based on Availability)
- 16.2.8 ATOUN Inc
- 16.2.8.1. Overview
- 16.2.8.2. Products
- 16.2.8.3. SWOT Analysis
- 16.2.8.4. Recent Developments
- 16.2.8.5. Financials (Based on Availability)
- 16.2.9 Honda Motor Co Ltd
- 16.2.9.1. Overview
- 16.2.9.2. Products
- 16.2.9.3. SWOT Analysis
- 16.2.9.4. Recent Developments
- 16.2.9.5. Financials (Based on Availability)
- 16.2.10 ReWalk Robotics Inc
- 16.2.10.1. Overview
- 16.2.10.2. Products
- 16.2.10.3. SWOT Analysis
- 16.2.10.4. Recent Developments
- 16.2.10.5. Financials (Based on Availability)
- 16.2.1 Lockheed Martin Corporation
List of Figures
- Figure 1: Global Wearable Robots Industry Revenue Breakdown (Million, %) by Region 2024 & 2032
- Figure 2: North America Wearable Robots Industry Revenue (Million), by Country 2024 & 2032
- Figure 3: North America Wearable Robots Industry Revenue Share (%), by Country 2024 & 2032
- Figure 4: Europe Wearable Robots Industry Revenue (Million), by Country 2024 & 2032
- Figure 5: Europe Wearable Robots Industry Revenue Share (%), by Country 2024 & 2032
- Figure 6: Asia Pacific Wearable Robots Industry Revenue (Million), by Country 2024 & 2032
- Figure 7: Asia Pacific Wearable Robots Industry Revenue Share (%), by Country 2024 & 2032
- Figure 8: South America Wearable Robots Industry Revenue (Million), by Country 2024 & 2032
- Figure 9: South America Wearable Robots Industry Revenue Share (%), by Country 2024 & 2032
- Figure 10: North America Wearable Robots Industry Revenue (Million), by Country 2024 & 2032
- Figure 11: North America Wearable Robots Industry Revenue Share (%), by Country 2024 & 2032
- Figure 12: MEA Wearable Robots Industry Revenue (Million), by Country 2024 & 2032
- Figure 13: MEA Wearable Robots Industry Revenue Share (%), by Country 2024 & 2032
- Figure 14: North America Wearable Robots Industry Revenue (Million), by Type 2024 & 2032
- Figure 15: North America Wearable Robots Industry Revenue Share (%), by Type 2024 & 2032
- Figure 16: North America Wearable Robots Industry Revenue (Million), by End-user Industry 2024 & 2032
- Figure 17: North America Wearable Robots Industry Revenue Share (%), by End-user Industry 2024 & 2032
- Figure 18: North America Wearable Robots Industry Revenue (Million), by Country 2024 & 2032
- Figure 19: North America Wearable Robots Industry Revenue Share (%), by Country 2024 & 2032
- Figure 20: Europe Wearable Robots Industry Revenue (Million), by Type 2024 & 2032
- Figure 21: Europe Wearable Robots Industry Revenue Share (%), by Type 2024 & 2032
- Figure 22: Europe Wearable Robots Industry Revenue (Million), by End-user Industry 2024 & 2032
- Figure 23: Europe Wearable Robots Industry Revenue Share (%), by End-user Industry 2024 & 2032
- Figure 24: Europe Wearable Robots Industry Revenue (Million), by Country 2024 & 2032
- Figure 25: Europe Wearable Robots Industry Revenue Share (%), by Country 2024 & 2032
- Figure 26: Asia Pacific Wearable Robots Industry Revenue (Million), by Type 2024 & 2032
- Figure 27: Asia Pacific Wearable Robots Industry Revenue Share (%), by Type 2024 & 2032
- Figure 28: Asia Pacific Wearable Robots Industry Revenue (Million), by End-user Industry 2024 & 2032
- Figure 29: Asia Pacific Wearable Robots Industry Revenue Share (%), by End-user Industry 2024 & 2032
- Figure 30: Asia Pacific Wearable Robots Industry Revenue (Million), by Country 2024 & 2032
- Figure 31: Asia Pacific Wearable Robots Industry Revenue Share (%), by Country 2024 & 2032
- Figure 32: Rest of the World Wearable Robots Industry Revenue (Million), by Type 2024 & 2032
- Figure 33: Rest of the World Wearable Robots Industry Revenue Share (%), by Type 2024 & 2032
- Figure 34: Rest of the World Wearable Robots Industry Revenue (Million), by End-user Industry 2024 & 2032
- Figure 35: Rest of the World Wearable Robots Industry Revenue Share (%), by End-user Industry 2024 & 2032
- Figure 36: Rest of the World Wearable Robots Industry Revenue (Million), by Country 2024 & 2032
- Figure 37: Rest of the World Wearable Robots Industry Revenue Share (%), by Country 2024 & 2032
List of Tables
- Table 1: Global Wearable Robots Industry Revenue Million Forecast, by Region 2019 & 2032
- Table 2: Global Wearable Robots Industry Revenue Million Forecast, by Type 2019 & 2032
- Table 3: Global Wearable Robots Industry Revenue Million Forecast, by End-user Industry 2019 & 2032
- Table 4: Global Wearable Robots Industry Revenue Million Forecast, by Region 2019 & 2032
- Table 5: Global Wearable Robots Industry Revenue Million Forecast, by Country 2019 & 2032
- Table 6: United States Wearable Robots Industry Revenue (Million) Forecast, by Application 2019 & 2032
- Table 7: Canada Wearable Robots Industry Revenue (Million) Forecast, by Application 2019 & 2032
- Table 8: Mexico Wearable Robots Industry Revenue (Million) Forecast, by Application 2019 & 2032
- Table 9: Global Wearable Robots Industry Revenue Million Forecast, by Country 2019 & 2032
- Table 10: Germany Wearable Robots Industry Revenue (Million) Forecast, by Application 2019 & 2032
- Table 11: United Kingdom Wearable Robots Industry Revenue (Million) Forecast, by Application 2019 & 2032
- Table 12: France Wearable Robots Industry Revenue (Million) Forecast, by Application 2019 & 2032
- Table 13: Spain Wearable Robots Industry Revenue (Million) Forecast, by Application 2019 & 2032
- Table 14: Italy Wearable Robots Industry Revenue (Million) Forecast, by Application 2019 & 2032
- Table 15: Spain Wearable Robots Industry Revenue (Million) Forecast, by Application 2019 & 2032
- Table 16: Belgium Wearable Robots Industry Revenue (Million) Forecast, by Application 2019 & 2032
- Table 17: Netherland Wearable Robots Industry Revenue (Million) Forecast, by Application 2019 & 2032
- Table 18: Nordics Wearable Robots Industry Revenue (Million) Forecast, by Application 2019 & 2032
- Table 19: Rest of Europe Wearable Robots Industry Revenue (Million) Forecast, by Application 2019 & 2032
- Table 20: Global Wearable Robots Industry Revenue Million Forecast, by Country 2019 & 2032
- Table 21: China Wearable Robots Industry Revenue (Million) Forecast, by Application 2019 & 2032
- Table 22: Japan Wearable Robots Industry Revenue (Million) Forecast, by Application 2019 & 2032
- Table 23: India Wearable Robots Industry Revenue (Million) Forecast, by Application 2019 & 2032
- Table 24: South Korea Wearable Robots Industry Revenue (Million) Forecast, by Application 2019 & 2032
- Table 25: Southeast Asia Wearable Robots Industry Revenue (Million) Forecast, by Application 2019 & 2032
- Table 26: Australia Wearable Robots Industry Revenue (Million) Forecast, by Application 2019 & 2032
- Table 27: Indonesia Wearable Robots Industry Revenue (Million) Forecast, by Application 2019 & 2032
- Table 28: Phillipes Wearable Robots Industry Revenue (Million) Forecast, by Application 2019 & 2032
- Table 29: Singapore Wearable Robots Industry Revenue (Million) Forecast, by Application 2019 & 2032
- Table 30: Thailandc Wearable Robots Industry Revenue (Million) Forecast, by Application 2019 & 2032
- Table 31: Rest of Asia Pacific Wearable Robots Industry Revenue (Million) Forecast, by Application 2019 & 2032
- Table 32: Global Wearable Robots Industry Revenue Million Forecast, by Country 2019 & 2032
- Table 33: Brazil Wearable Robots Industry Revenue (Million) Forecast, by Application 2019 & 2032
- Table 34: Argentina Wearable Robots Industry Revenue (Million) Forecast, by Application 2019 & 2032
- Table 35: Peru Wearable Robots Industry Revenue (Million) Forecast, by Application 2019 & 2032
- Table 36: Chile Wearable Robots Industry Revenue (Million) Forecast, by Application 2019 & 2032
- Table 37: Colombia Wearable Robots Industry Revenue (Million) Forecast, by Application 2019 & 2032
- Table 38: Ecuador Wearable Robots Industry Revenue (Million) Forecast, by Application 2019 & 2032
- Table 39: Venezuela Wearable Robots Industry Revenue (Million) Forecast, by Application 2019 & 2032
- Table 40: Rest of South America Wearable Robots Industry Revenue (Million) Forecast, by Application 2019 & 2032
- Table 41: Global Wearable Robots Industry Revenue Million Forecast, by Country 2019 & 2032
- Table 42: United States Wearable Robots Industry Revenue (Million) Forecast, by Application 2019 & 2032
- Table 43: Canada Wearable Robots Industry Revenue (Million) Forecast, by Application 2019 & 2032
- Table 44: Mexico Wearable Robots Industry Revenue (Million) Forecast, by Application 2019 & 2032
- Table 45: Global Wearable Robots Industry Revenue Million Forecast, by Country 2019 & 2032
- Table 46: United Arab Emirates Wearable Robots Industry Revenue (Million) Forecast, by Application 2019 & 2032
- Table 47: Saudi Arabia Wearable Robots Industry Revenue (Million) Forecast, by Application 2019 & 2032
- Table 48: South Africa Wearable Robots Industry Revenue (Million) Forecast, by Application 2019 & 2032
- Table 49: Rest of Middle East and Africa Wearable Robots Industry Revenue (Million) Forecast, by Application 2019 & 2032
- Table 50: Global Wearable Robots Industry Revenue Million Forecast, by Type 2019 & 2032
- Table 51: Global Wearable Robots Industry Revenue Million Forecast, by End-user Industry 2019 & 2032
- Table 52: Global Wearable Robots Industry Revenue Million Forecast, by Country 2019 & 2032
- Table 53: Global Wearable Robots Industry Revenue Million Forecast, by Type 2019 & 2032
- Table 54: Global Wearable Robots Industry Revenue Million Forecast, by End-user Industry 2019 & 2032
- Table 55: Global Wearable Robots Industry Revenue Million Forecast, by Country 2019 & 2032
- Table 56: Global Wearable Robots Industry Revenue Million Forecast, by Type 2019 & 2032
- Table 57: Global Wearable Robots Industry Revenue Million Forecast, by End-user Industry 2019 & 2032
- Table 58: Global Wearable Robots Industry Revenue Million Forecast, by Country 2019 & 2032
- Table 59: Global Wearable Robots Industry Revenue Million Forecast, by Type 2019 & 2032
- Table 60: Global Wearable Robots Industry Revenue Million Forecast, by End-user Industry 2019 & 2032
- Table 61: Global Wearable Robots Industry Revenue Million Forecast, by Country 2019 & 2032
Frequently Asked Questions
1. What is the projected Compound Annual Growth Rate (CAGR) of the Wearable Robots Industry?
The projected CAGR is approximately 32.05%.
2. Which companies are prominent players in the Wearable Robots Industry?
Key companies in the market include Lockheed Martin Corporation, Hocoma AG (DIH International Ltd ), Sarcos Corporation, Ekso Bionics Holdings Inc, Technaid S L, Cyberdyne Inc, Skelex, ATOUN Inc, Honda Motor Co Ltd, ReWalk Robotics Inc.
3. What are the main segments of the Wearable Robots Industry?
The market segments include Type, End-user Industry.
4. Can you provide details about the market size?
The market size is estimated to be USD 2.55 Million as of 2022.
5. What are some drivers contributing to market growth?
Increasing Demand for Robotic Rehabilitation in Healthcare Industry; Growing Investment in the Development of the Exoskeleton Technology.
6. What are the notable trends driving market growth?
Healthcare is Expected to Hold a Significant Share.
7. Are there any restraints impacting market growth?
High Cost of the Equipment.
8. Can you provide examples of recent developments in the market?
November 2021 - Rewalk Robotics Ltd received a 'Breakthrough Designation' from the FDA for its ReBoot, battery-powered orthotic exo-suit, designed to assist ambulatory functions in individuals with reduced ankle function related to neurological injuries, such as stroke. It is intended for home and community use.
9. What pricing options are available for accessing the report?
Pricing options include single-user, multi-user, and enterprise licenses priced at USD 4750, USD 5250, and USD 8750 respectively.
10. Is the market size provided in terms of value or volume?
The market size is provided in terms of value, measured in Million.
11. Are there any specific market keywords associated with the report?
Yes, the market keyword associated with the report is "Wearable Robots Industry," which aids in identifying and referencing the specific market segment covered.
12. How do I determine which pricing option suits my needs best?
The pricing options vary based on user requirements and access needs. Individual users may opt for single-user licenses, while businesses requiring broader access may choose multi-user or enterprise licenses for cost-effective access to the report.
13. Are there any additional resources or data provided in the Wearable Robots Industry report?
While the report offers comprehensive insights, it's advisable to review the specific contents or supplementary materials provided to ascertain if additional resources or data are available.
14. How can I stay updated on further developments or reports in the Wearable Robots Industry?
To stay informed about further developments, trends, and reports in the Wearable Robots Industry, consider subscribing to industry newsletters, following relevant companies and organizations, or regularly checking reputable industry news sources and publications.
Methodology
Step 1 - Identification of Relevant Samples Size from Population Database


Step 2 - Approaches for Defining Global Market Size (Value, Volume* & Price*)

Note*: In applicable scenarios
Step 3 - Data Sources
Primary Research
- Web Analytics
- Survey Reports
- Research Institute
- Latest Research Reports
- Opinion Leaders
Secondary Research
- Annual Reports
- White Paper
- Latest Press Release
- Industry Association
- Paid Database
- Investor Presentations

Step 4 - Data Triangulation
Involves using different sources of information in order to increase the validity of a study
These sources are likely to be stakeholders in a program - participants, other researchers, program staff, other community members, and so on.
Then we put all data in single framework & apply various statistical tools to find out the dynamic on the market.
During the analysis stage, feedback from the stakeholder groups would be compared to determine areas of agreement as well as areas of divergence


