
Key Insights
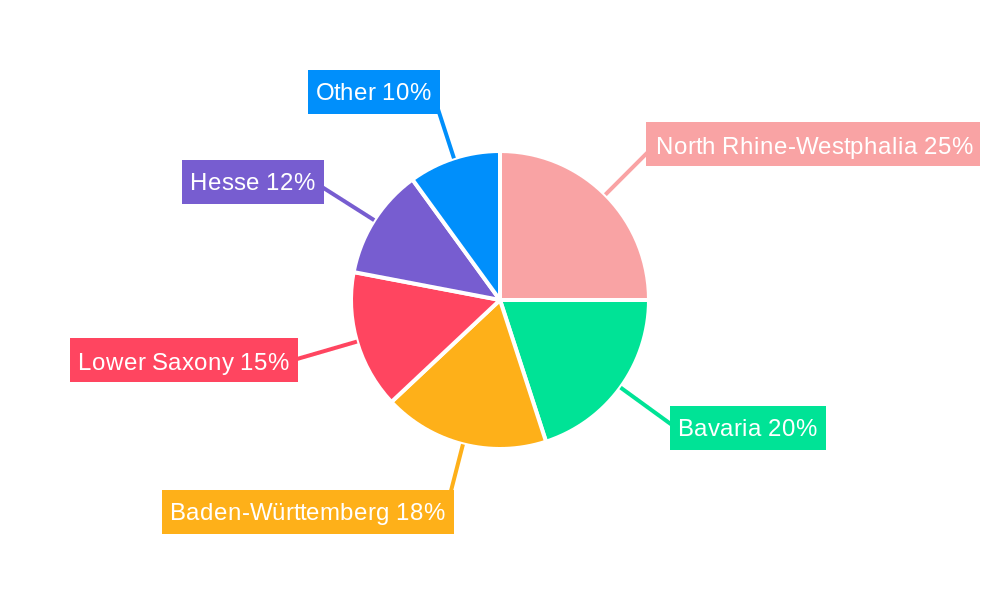
The German waste-to-energy (WtE) market, valued at €4.08 billion in 2025, is projected to experience robust growth, driven by stringent environmental regulations aimed at reducing landfill waste and increasing renewable energy targets. The compound annual growth rate (CAGR) of 4.66% from 2025 to 2033 indicates a steady expansion, fueled by technological advancements in incineration, gasification, and anaerobic digestion technologies. Germany's commitment to sustainable waste management, coupled with increasing energy demands, creates a favorable environment for WtE solutions. The market is segmented by technology (physical, thermal, and biological processes) and product type (incinerators, gasifiers, and anaerobic digesters). Leading players like Envi Con & Plant Engineering GmbH, EEW Energy from Waste GmbH, Martin GmbH, STEAG Energy Services GmbH, and Tana Oy are actively shaping the market landscape through technological innovation and strategic partnerships. Regional focus is concentrated in states like North Rhine-Westphalia, Bavaria, Baden-Württemberg, Lower Saxony, and Hesse, reflecting population density and industrial activity. While challenges remain, such as public perception concerning emissions and siting limitations, the overall outlook for the German WtE market remains positive, with significant growth potential driven by policy support and technological improvements.
The substantial growth predicted for the German WtE market is further supported by the increasing adoption of advanced technologies like plasma gasification and pyrolysis, which offer improved efficiency and reduced emissions. Furthermore, the integration of WtE plants into broader energy infrastructure, leveraging synergies with district heating systems, is becoming increasingly common, enhancing overall economic viability and social acceptance. The market will likely witness increased competition amongst existing players and the emergence of new entrants as the demand for innovative and sustainable waste management solutions grows. Government incentives, stricter waste management regulations and rising energy costs will continue to drive market expansion. However, the sector must address concerns surrounding potential environmental impacts through robust monitoring and technological advancements to ensure continued market growth and public trust.

Waste to Energy Germany Market: A Comprehensive Report (2019-2033)
This detailed report provides a comprehensive analysis of the Waste-to-Energy (WtE) market in Germany, covering the period from 2019 to 2033. It offers invaluable insights into market structure, competitive dynamics, industry trends, technological advancements, and key players, equipping stakeholders with actionable intelligence for informed decision-making. The report utilizes data from the historical period (2019-2024), with 2025 as the base and estimated year, and forecasts extending to 2033. The total market size in 2025 is estimated at xx Million. This report is crucial for businesses, investors, and policymakers seeking a deep understanding of this rapidly evolving market.
Waste to Energy Germany Market Market Structure & Competitive Dynamics
The German WtE market exhibits a moderately concentrated structure, with several established players holding significant market share. The market is characterized by a dynamic interplay of innovation, stringent regulatory frameworks, and the constant emergence of product substitutes. End-user trends, particularly towards sustainable waste management solutions, are significantly shaping market growth. Furthermore, the market has witnessed a series of mergers and acquisitions (M&A) in recent years, with deal values averaging xx Million per transaction (estimated). Key factors influencing market dynamics include:
- Market Concentration: The top five players collectively hold an estimated xx% market share in 2025.
- Innovation Ecosystem: Strong R&D activities are driving innovations in thermal and biological technologies, particularly in improving energy efficiency and reducing emissions.
- Regulatory Framework: Stringent environmental regulations and policies promote the adoption of WtE technologies while simultaneously imposing strict emission standards.
- Product Substitutes: Competition exists from other waste management methods like landfill and recycling, influencing the adoption of WtE technologies.
- End-User Trends: Increasing environmental consciousness and government mandates drive demand for sustainable waste management solutions, benefiting the WtE sector.
- M&A Activity: Consolidation through M&A activities aims to enhance operational efficiency and expand market reach. Examples include deals valued at xx Million in 2023 and xx Million in 2022 (estimated values).
Waste to Energy Germany Market Industry Trends & Insights
The German WtE market is experiencing robust growth, driven by several key factors. The Compound Annual Growth Rate (CAGR) for the forecast period (2025-2033) is projected at xx%. Market penetration of WtE technologies is increasing, driven by rising waste generation, stringent environmental regulations, and the increasing focus on energy security. Technological advancements, such as the integration of AI and IoT in waste management systems, are further enhancing efficiency and cost-effectiveness. Consumer preferences are shifting towards sustainable waste management practices, creating substantial growth opportunities. The competitive landscape is characterized by ongoing innovation and strategic partnerships, further influencing market dynamics. Government support in the form of subsidies and tax incentives stimulates the adoption of WtE technologies. However, challenges like high initial investment costs and public perception remain.

Dominant Markets & Segments in Waste to Energy Germany Market
While data on regional dominance requires further specification, the thermal technology segment is currently the most dominant, followed by biological and then physical technologies. Within product types, incinerators constitute the largest market share, followed by gasifiers and anaerobic digesters. This dominance stems from several key factors:
Thermal Technology:
- Key Drivers: Mature technology, high energy recovery efficiency, proven track record.
- Dominance Analysis: The established technology base and higher energy yields make it the preferred choice for many waste management facilities.
Incinerators:
- Key Drivers: Established technology, reliable energy generation, widespread adoption across Germany.
- Dominance Analysis: Incinerators benefit from economies of scale and a mature supply chain, resulting in widespread adoption across the country.
Waste to Energy Germany Market Product Innovations
Recent innovations focus on enhancing energy efficiency, emission reduction, and the integration of smart technologies. Advanced gasification systems are gaining traction, offering higher energy recovery rates and reduced greenhouse gas emissions. The integration of AI and IoT in waste management systems enables real-time monitoring and optimization of processes, enhancing operational efficiency and cost-effectiveness. These innovations are improving the market fit of WtE technologies by addressing environmental and economic concerns.
Report Segmentation & Scope
The report segments the German WtE market based on technology (Physical, Thermal, Biological) and product type (Incinerators, Gasifiers, Anaerobic Digesters). Each segment is analyzed in detail, providing market size, growth projections, and competitive dynamics.
Technology Segmentation: This section details the market share and growth potential of each technology, considering factors like efficiency, environmental impact, and capital costs.
Product Type Segmentation: This analyzes the market size and growth trajectory of incinerators, gasifiers, and anaerobic digesters, factoring in their respective advantages and limitations.
Key Drivers of Waste to Energy Germany Market Growth
Several factors fuel the growth of the German WtE market. Stringent environmental regulations, promoting sustainable waste management, are a primary driver. The increasing focus on renewable energy sources and energy security further strengthens market growth. Technological advancements, resulting in enhanced efficiency and reduced emissions, also contribute significantly. Government incentives and subsidies provide further impetus to market expansion. The rising volume of municipal solid waste necessitates efficient waste management solutions, driving demand for WtE technologies.
Challenges in the Waste to Energy Germany Market Sector
Despite its potential, the German WtE market faces challenges. High initial capital investment costs hinder the widespread adoption of WtE technologies, particularly for smaller municipalities. Concerns about emissions and potential environmental impacts remain a barrier. Public acceptance and perception of WtE plants also influence their deployment. Furthermore, fluctuating waste composition and inconsistent energy prices impact the sector’s profitability.
Leading Players in the Waste to Energy Germany Market Market
- Envi Con & Plant Engineering GmbH
- EEW Energy from Waste GmbH
- Martin GmbH
- STEAG Energy Services GmbH
- Tana Oy
Key Developments in Waste to Energy Germany Market Sector
- May 2023: Gemeinsames Unternehmen für Abfallwirtschaft (GfA) commenced construction of a WtE plant in Geiselbullach, Bavaria, integrating geothermal resources.
- January 2022: Doosan Heavy Industries & Construction secured a USD 134 Million order to build a WtE plant in Wiesbaden.
Strategic Waste to Energy Germany Market Market Outlook
The German WtE market holds substantial growth potential driven by increasing waste generation, stringent environmental regulations, and the pursuit of energy independence. Strategic opportunities lie in developing innovative, cost-effective technologies, enhancing public awareness and acceptance, and fostering collaborations between stakeholders. Focusing on technological advancements, particularly in emission reduction and energy efficiency, will unlock significant growth avenues.
Waste to Energy Germany Market Segmentation
-
1. Technology
- 1.1. Physical
- 1.2. Thermal
- 1.3. Biological
Waste to Energy Germany Market Segmentation By Geography
-
1. North America
- 1.1. United States
- 1.2. Canada
- 1.3. Mexico
-
2. South America
- 2.1. Brazil
- 2.2. Argentina
- 2.3. Rest of South America
-
3. Europe
- 3.1. United Kingdom
- 3.2. Germany
- 3.3. France
- 3.4. Italy
- 3.5. Spain
- 3.6. Russia
- 3.7. Benelux
- 3.8. Nordics
- 3.9. Rest of Europe
-
4. Middle East & Africa
- 4.1. Turkey
- 4.2. Israel
- 4.3. GCC
- 4.4. North Africa
- 4.5. South Africa
- 4.6. Rest of Middle East & Africa
-
5. Asia Pacific
- 5.1. China
- 5.2. India
- 5.3. Japan
- 5.4. South Korea
- 5.5. ASEAN
- 5.6. Oceania
- 5.7. Rest of Asia Pacific
Waste to Energy Germany Market REPORT HIGHLIGHTS
| Aspects | Details |
|---|---|
| Study Period | 2019-2033 |
| Base Year | 2024 |
| Estimated Year | 2025 |
| Forecast Period | 2025-2033 |
| Historical Period | 2019-2024 |
| Growth Rate | CAGR of 4.66% from 2019-2033 |
| Segmentation |
|
Table of Contents
- 1. Introduction
- 1.1. Research Scope
- 1.2. Market Segmentation
- 1.3. Research Methodology
- 1.4. Definitions and Assumptions
- 2. Executive Summary
- 2.1. Introduction
- 3. Market Dynamics
- 3.1. Introduction
- 3.2. Market Drivers
- 3.2.1. 4.; The High Amount of Waste Generation in the Country4.; The growing Focus on Non-Fossil Fuel Sources
- 3.3. Market Restrains
- 3.3.1. 4.; The Recycling Rate of Waste in Germany
- 3.4. Market Trends
- 3.4.1. Thermal Based Waste-to-Energy Conversion is Dominating the Market
- 4. Market Factor Analysis
- 4.1. Porters Five Forces
- 4.2. Supply/Value Chain
- 4.3. PESTEL analysis
- 4.4. Market Entropy
- 4.5. Patent/Trademark Analysis
- 5. Global Waste to Energy Germany Market Analysis, Insights and Forecast, 2019-2031
- 5.1. Market Analysis, Insights and Forecast - by Technology
- 5.1.1. Physical
- 5.1.2. Thermal
- 5.1.3. Biological
- 5.2. Market Analysis, Insights and Forecast - by Region
- 5.2.1. North America
- 5.2.2. South America
- 5.2.3. Europe
- 5.2.4. Middle East & Africa
- 5.2.5. Asia Pacific
- 5.1. Market Analysis, Insights and Forecast - by Technology
- 6. North America Waste to Energy Germany Market Analysis, Insights and Forecast, 2019-2031
- 6.1. Market Analysis, Insights and Forecast - by Technology
- 6.1.1. Physical
- 6.1.2. Thermal
- 6.1.3. Biological
- 6.1. Market Analysis, Insights and Forecast - by Technology
- 7. South America Waste to Energy Germany Market Analysis, Insights and Forecast, 2019-2031
- 7.1. Market Analysis, Insights and Forecast - by Technology
- 7.1.1. Physical
- 7.1.2. Thermal
- 7.1.3. Biological
- 7.1. Market Analysis, Insights and Forecast - by Technology
- 8. Europe Waste to Energy Germany Market Analysis, Insights and Forecast, 2019-2031
- 8.1. Market Analysis, Insights and Forecast - by Technology
- 8.1.1. Physical
- 8.1.2. Thermal
- 8.1.3. Biological
- 8.1. Market Analysis, Insights and Forecast - by Technology
- 9. Middle East & Africa Waste to Energy Germany Market Analysis, Insights and Forecast, 2019-2031
- 9.1. Market Analysis, Insights and Forecast - by Technology
- 9.1.1. Physical
- 9.1.2. Thermal
- 9.1.3. Biological
- 9.1. Market Analysis, Insights and Forecast - by Technology
- 10. Asia Pacific Waste to Energy Germany Market Analysis, Insights and Forecast, 2019-2031
- 10.1. Market Analysis, Insights and Forecast - by Technology
- 10.1.1. Physical
- 10.1.2. Thermal
- 10.1.3. Biological
- 10.1. Market Analysis, Insights and Forecast - by Technology
- 11. North Rhine-Westphalia Waste to Energy Germany Market Analysis, Insights and Forecast, 2019-2031
- 12. Bavaria Waste to Energy Germany Market Analysis, Insights and Forecast, 2019-2031
- 13. Baden-Württemberg Waste to Energy Germany Market Analysis, Insights and Forecast, 2019-2031
- 14. Lower Saxony Waste to Energy Germany Market Analysis, Insights and Forecast, 2019-2031
- 15. Hesse Waste to Energy Germany Market Analysis, Insights and Forecast, 2019-2031
- 16. Competitive Analysis
- 16.1. Global Market Share Analysis 2024
- 16.2. Company Profiles
- 16.2.1 Envi Con & Plant Engineering GmbH
- 16.2.1.1. Overview
- 16.2.1.2. Products
- 16.2.1.3. SWOT Analysis
- 16.2.1.4. Recent Developments
- 16.2.1.5. Financials (Based on Availability)
- 16.2.2 EEW Energy from Waste GmbH*List Not Exhaustive
- 16.2.2.1. Overview
- 16.2.2.2. Products
- 16.2.2.3. SWOT Analysis
- 16.2.2.4. Recent Developments
- 16.2.2.5. Financials (Based on Availability)
- 16.2.3 Martin GmbH
- 16.2.3.1. Overview
- 16.2.3.2. Products
- 16.2.3.3. SWOT Analysis
- 16.2.3.4. Recent Developments
- 16.2.3.5. Financials (Based on Availability)
- 16.2.4 STEAG Energy Services GmbH
- 16.2.4.1. Overview
- 16.2.4.2. Products
- 16.2.4.3. SWOT Analysis
- 16.2.4.4. Recent Developments
- 16.2.4.5. Financials (Based on Availability)
- 16.2.5 Tana Oy
- 16.2.5.1. Overview
- 16.2.5.2. Products
- 16.2.5.3. SWOT Analysis
- 16.2.5.4. Recent Developments
- 16.2.5.5. Financials (Based on Availability)
- 16.2.1 Envi Con & Plant Engineering GmbH
List of Figures
- Figure 1: Global Waste to Energy Germany Market Revenue Breakdown (Million, %) by Region 2024 & 2032
- Figure 2: Germany Waste to Energy Germany Market Revenue (Million), by Country 2024 & 2032
- Figure 3: Germany Waste to Energy Germany Market Revenue Share (%), by Country 2024 & 2032
- Figure 4: North America Waste to Energy Germany Market Revenue (Million), by Technology 2024 & 2032
- Figure 5: North America Waste to Energy Germany Market Revenue Share (%), by Technology 2024 & 2032
- Figure 6: North America Waste to Energy Germany Market Revenue (Million), by Country 2024 & 2032
- Figure 7: North America Waste to Energy Germany Market Revenue Share (%), by Country 2024 & 2032
- Figure 8: South America Waste to Energy Germany Market Revenue (Million), by Technology 2024 & 2032
- Figure 9: South America Waste to Energy Germany Market Revenue Share (%), by Technology 2024 & 2032
- Figure 10: South America Waste to Energy Germany Market Revenue (Million), by Country 2024 & 2032
- Figure 11: South America Waste to Energy Germany Market Revenue Share (%), by Country 2024 & 2032
- Figure 12: Europe Waste to Energy Germany Market Revenue (Million), by Technology 2024 & 2032
- Figure 13: Europe Waste to Energy Germany Market Revenue Share (%), by Technology 2024 & 2032
- Figure 14: Europe Waste to Energy Germany Market Revenue (Million), by Country 2024 & 2032
- Figure 15: Europe Waste to Energy Germany Market Revenue Share (%), by Country 2024 & 2032
- Figure 16: Middle East & Africa Waste to Energy Germany Market Revenue (Million), by Technology 2024 & 2032
- Figure 17: Middle East & Africa Waste to Energy Germany Market Revenue Share (%), by Technology 2024 & 2032
- Figure 18: Middle East & Africa Waste to Energy Germany Market Revenue (Million), by Country 2024 & 2032
- Figure 19: Middle East & Africa Waste to Energy Germany Market Revenue Share (%), by Country 2024 & 2032
- Figure 20: Asia Pacific Waste to Energy Germany Market Revenue (Million), by Technology 2024 & 2032
- Figure 21: Asia Pacific Waste to Energy Germany Market Revenue Share (%), by Technology 2024 & 2032
- Figure 22: Asia Pacific Waste to Energy Germany Market Revenue (Million), by Country 2024 & 2032
- Figure 23: Asia Pacific Waste to Energy Germany Market Revenue Share (%), by Country 2024 & 2032
List of Tables
- Table 1: Global Waste to Energy Germany Market Revenue Million Forecast, by Region 2019 & 2032
- Table 2: Global Waste to Energy Germany Market Revenue Million Forecast, by Technology 2019 & 2032
- Table 3: Global Waste to Energy Germany Market Revenue Million Forecast, by Region 2019 & 2032
- Table 4: Global Waste to Energy Germany Market Revenue Million Forecast, by Country 2019 & 2032
- Table 5: North Rhine-Westphalia Waste to Energy Germany Market Revenue (Million) Forecast, by Application 2019 & 2032
- Table 6: Bavaria Waste to Energy Germany Market Revenue (Million) Forecast, by Application 2019 & 2032
- Table 7: Baden-Württemberg Waste to Energy Germany Market Revenue (Million) Forecast, by Application 2019 & 2032
- Table 8: Lower Saxony Waste to Energy Germany Market Revenue (Million) Forecast, by Application 2019 & 2032
- Table 9: Hesse Waste to Energy Germany Market Revenue (Million) Forecast, by Application 2019 & 2032
- Table 10: Global Waste to Energy Germany Market Revenue Million Forecast, by Technology 2019 & 2032
- Table 11: Global Waste to Energy Germany Market Revenue Million Forecast, by Country 2019 & 2032
- Table 12: United States Waste to Energy Germany Market Revenue (Million) Forecast, by Application 2019 & 2032
- Table 13: Canada Waste to Energy Germany Market Revenue (Million) Forecast, by Application 2019 & 2032
- Table 14: Mexico Waste to Energy Germany Market Revenue (Million) Forecast, by Application 2019 & 2032
- Table 15: Global Waste to Energy Germany Market Revenue Million Forecast, by Technology 2019 & 2032
- Table 16: Global Waste to Energy Germany Market Revenue Million Forecast, by Country 2019 & 2032
- Table 17: Brazil Waste to Energy Germany Market Revenue (Million) Forecast, by Application 2019 & 2032
- Table 18: Argentina Waste to Energy Germany Market Revenue (Million) Forecast, by Application 2019 & 2032
- Table 19: Rest of South America Waste to Energy Germany Market Revenue (Million) Forecast, by Application 2019 & 2032
- Table 20: Global Waste to Energy Germany Market Revenue Million Forecast, by Technology 2019 & 2032
- Table 21: Global Waste to Energy Germany Market Revenue Million Forecast, by Country 2019 & 2032
- Table 22: United Kingdom Waste to Energy Germany Market Revenue (Million) Forecast, by Application 2019 & 2032
- Table 23: Germany Waste to Energy Germany Market Revenue (Million) Forecast, by Application 2019 & 2032
- Table 24: France Waste to Energy Germany Market Revenue (Million) Forecast, by Application 2019 & 2032
- Table 25: Italy Waste to Energy Germany Market Revenue (Million) Forecast, by Application 2019 & 2032
- Table 26: Spain Waste to Energy Germany Market Revenue (Million) Forecast, by Application 2019 & 2032
- Table 27: Russia Waste to Energy Germany Market Revenue (Million) Forecast, by Application 2019 & 2032
- Table 28: Benelux Waste to Energy Germany Market Revenue (Million) Forecast, by Application 2019 & 2032
- Table 29: Nordics Waste to Energy Germany Market Revenue (Million) Forecast, by Application 2019 & 2032
- Table 30: Rest of Europe Waste to Energy Germany Market Revenue (Million) Forecast, by Application 2019 & 2032
- Table 31: Global Waste to Energy Germany Market Revenue Million Forecast, by Technology 2019 & 2032
- Table 32: Global Waste to Energy Germany Market Revenue Million Forecast, by Country 2019 & 2032
- Table 33: Turkey Waste to Energy Germany Market Revenue (Million) Forecast, by Application 2019 & 2032
- Table 34: Israel Waste to Energy Germany Market Revenue (Million) Forecast, by Application 2019 & 2032
- Table 35: GCC Waste to Energy Germany Market Revenue (Million) Forecast, by Application 2019 & 2032
- Table 36: North Africa Waste to Energy Germany Market Revenue (Million) Forecast, by Application 2019 & 2032
- Table 37: South Africa Waste to Energy Germany Market Revenue (Million) Forecast, by Application 2019 & 2032
- Table 38: Rest of Middle East & Africa Waste to Energy Germany Market Revenue (Million) Forecast, by Application 2019 & 2032
- Table 39: Global Waste to Energy Germany Market Revenue Million Forecast, by Technology 2019 & 2032
- Table 40: Global Waste to Energy Germany Market Revenue Million Forecast, by Country 2019 & 2032
- Table 41: China Waste to Energy Germany Market Revenue (Million) Forecast, by Application 2019 & 2032
- Table 42: India Waste to Energy Germany Market Revenue (Million) Forecast, by Application 2019 & 2032
- Table 43: Japan Waste to Energy Germany Market Revenue (Million) Forecast, by Application 2019 & 2032
- Table 44: South Korea Waste to Energy Germany Market Revenue (Million) Forecast, by Application 2019 & 2032
- Table 45: ASEAN Waste to Energy Germany Market Revenue (Million) Forecast, by Application 2019 & 2032
- Table 46: Oceania Waste to Energy Germany Market Revenue (Million) Forecast, by Application 2019 & 2032
- Table 47: Rest of Asia Pacific Waste to Energy Germany Market Revenue (Million) Forecast, by Application 2019 & 2032
Frequently Asked Questions
1. What is the projected Compound Annual Growth Rate (CAGR) of the Waste to Energy Germany Market?
The projected CAGR is approximately 4.66%.
2. Which companies are prominent players in the Waste to Energy Germany Market?
Key companies in the market include Envi Con & Plant Engineering GmbH, EEW Energy from Waste GmbH*List Not Exhaustive, Martin GmbH, STEAG Energy Services GmbH, Tana Oy.
3. What are the main segments of the Waste to Energy Germany Market?
The market segments include Technology.
4. Can you provide details about the market size?
The market size is estimated to be USD 4.08 Million as of 2022.
5. What are some drivers contributing to market growth?
4.; The High Amount of Waste Generation in the Country4.; The growing Focus on Non-Fossil Fuel Sources.
6. What are the notable trends driving market growth?
Thermal Based Waste-to-Energy Conversion is Dominating the Market.
7. Are there any restraints impacting market growth?
4.; The Recycling Rate of Waste in Germany.
8. Can you provide examples of recent developments in the market?
In May 2023, the municipal waste management company Gemeinsames Unternehmen für Abfallwirtschaft (GfA) announced the start of the construction of the waste-to-energy plant in Geiselbullach, located in the state of Bavaria, Germany. The plant aims to tap into geothermal resources to provide an alternative source for the existing district heating network
9. What pricing options are available for accessing the report?
Pricing options include single-user, multi-user, and enterprise licenses priced at USD 3800, USD 4500, and USD 5800 respectively.
10. Is the market size provided in terms of value or volume?
The market size is provided in terms of value, measured in Million.
11. Are there any specific market keywords associated with the report?
Yes, the market keyword associated with the report is "Waste to Energy Germany Market," which aids in identifying and referencing the specific market segment covered.
12. How do I determine which pricing option suits my needs best?
The pricing options vary based on user requirements and access needs. Individual users may opt for single-user licenses, while businesses requiring broader access may choose multi-user or enterprise licenses for cost-effective access to the report.
13. Are there any additional resources or data provided in the Waste to Energy Germany Market report?
While the report offers comprehensive insights, it's advisable to review the specific contents or supplementary materials provided to ascertain if additional resources or data are available.
14. How can I stay updated on further developments or reports in the Waste to Energy Germany Market?
To stay informed about further developments, trends, and reports in the Waste to Energy Germany Market, consider subscribing to industry newsletters, following relevant companies and organizations, or regularly checking reputable industry news sources and publications.
Methodology
Step 1 - Identification of Relevant Samples Size from Population Database


Step 2 - Approaches for Defining Global Market Size (Value, Volume* & Price*)

Note*: In applicable scenarios
Step 3 - Data Sources
Primary Research
- Web Analytics
- Survey Reports
- Research Institute
- Latest Research Reports
- Opinion Leaders
Secondary Research
- Annual Reports
- White Paper
- Latest Press Release
- Industry Association
- Paid Database
- Investor Presentations

Step 4 - Data Triangulation
Involves using different sources of information in order to increase the validity of a study
These sources are likely to be stakeholders in a program - participants, other researchers, program staff, other community members, and so on.
Then we put all data in single framework & apply various statistical tools to find out the dynamic on the market.
During the analysis stage, feedback from the stakeholder groups would be compared to determine areas of agreement as well as areas of divergence


