
Key Insights
The global coal-fired power generation market, while facing significant headwinds due to environmental concerns and the rise of renewable energy sources, continues to hold a substantial share of the global electricity generation landscape. The period between 2019 and 2024 witnessed a period of moderate growth, likely influenced by factors such as existing infrastructure, relatively low initial investment costs in comparison to renewable options, and continued demand in certain developing economies experiencing rapid industrialization. However, the long-term forecast (2025-2033) suggests a slower CAGR compared to the preceding period, reflecting a clear shift towards decarbonization efforts and stricter environmental regulations globally. This shift is likely to be most pronounced in developed nations, where investments in renewable energy sources and energy efficiency measures are accelerating. Despite the anticipated decline, coal-fired power generation is expected to remain a significant player, particularly in regions with abundant coal reserves and less stringent environmental policies. The market's future trajectory hinges on the interplay between energy security needs, governmental policies promoting renewable energy transitions, technological advancements in carbon capture and storage, and the fluctuating price of natural gas and other competing energy sources.
The market's future growth will be significantly influenced by government policies regarding carbon emissions and subsidies for renewable energy. Regions with strong environmental regulations and significant investments in renewable energy infrastructure are projected to experience a more pronounced decline in coal-fired power generation. Conversely, regions with less stringent regulations or a continued reliance on coal due to energy security concerns may witness more sustained albeit slower growth. The development and widespread adoption of carbon capture and storage (CCS) technologies could also play a pivotal role in mitigating the decline by making coal-fired power plants more environmentally acceptable. However, the cost-effectiveness and scalability of CCS technology remain critical factors determining its impact on the market's future. Further analysis should also consider the impact of geopolitical factors on global energy prices and the subsequent impact on the competitiveness of coal-fired power generation compared to alternative sources.
Coal Fired Power Generation Market: A Comprehensive Analysis & Forecast (2019-2033)
This in-depth report provides a comprehensive analysis of the global Coal Fired Power Generation Market, offering invaluable insights for industry stakeholders, investors, and strategic decision-makers. Covering the period from 2019 to 2033, with a focus on 2025, this report meticulously examines market dynamics, competitive landscapes, technological advancements, and future growth potential. The study utilizes a robust methodology, incorporating extensive primary and secondary research to deliver accurate and reliable market estimations.
Coal Fired Power Generation Market Market Structure & Competitive Dynamics
The Coal Fired Power Generation market exhibits a moderately concentrated structure, with a handful of large players holding significant market share. The market's competitive dynamics are shaped by factors including technological innovation, stringent environmental regulations, and the increasing adoption of renewable energy sources. Market share analysis reveals that a few dominant players, such as China Huaneng Group and National Thermal Power Corporation Limited, account for approximately xx% of the market, while numerous smaller players compete in niche segments. Mergers and acquisitions (M&A) activity has been relatively active in recent years, with deal values totaling an estimated $xx Million in 2024 alone, driven primarily by the consolidation of assets and expansion into new geographical markets. The regulatory framework, varying across regions, significantly influences investment decisions and market entry strategies. Moreover, the increasing availability of renewable energy sources and the associated policy incentives act as key substitutes, pressuring the market's growth trajectory. End-user trends reflect a shift towards cleaner energy solutions, pushing coal-fired power generation companies to adopt cleaner technologies and enhance operational efficiencies.
Coal Fired Power Generation Market Industry Trends & Insights
The global Coal Fired Power Generation market is witnessing complex trends influenced by geopolitical factors, environmental concerns, and technological advancements. The market exhibited a CAGR of xx% during the historical period (2019-2024) and is projected to grow at a CAGR of xx% during the forecast period (2025-2033). Key growth drivers include the continued demand for electricity in emerging economies, particularly in Asia, despite the growing adoption of renewable energy. Technological disruptions, such as the development of high-efficiency, low-emission (HELE) coal technologies, are influencing the market's landscape, albeit slowly. Consumer preferences are increasingly shifting towards cleaner energy options, creating a pressure for coal-fired power plants to improve their environmental performance or face stricter regulations and reduced market share. The competitive dynamics are characterized by intense competition among major players, leading to pricing pressures and a focus on cost optimization and operational efficiency. Market penetration of HELE technologies remains relatively low (xx%), highlighting the challenges associated with adopting cleaner technologies.

Dominant Markets & Segments in Coal Fired Power Generation Market
Asia, particularly China and India, are currently the dominant markets for coal-fired power generation, driven by rapid economic growth and increasing energy demands. Within technology segments, Pulverized Coal Firing Systems (PC) hold the largest market share, due to its established technology and relatively lower initial investment costs.
- Key Drivers for Asia's Dominance:
- Rapid industrialization and urbanization
- Increasing electricity demand
- Relatively lower cost of coal compared to other energy sources
- Existing infrastructure supporting coal-fired power plants
The dominance of PC systems is challenged by stricter environmental regulations and the increasing need for emission reduction. Cyclone Furnaces and Other Technologies (Circulating Fluidized Bed and Coal Gasification) show potential for future growth, primarily driven by their improved efficiency and lower emissions compared to traditional PC systems. However, their high initial investment costs and technological complexities act as significant barriers to wider adoption.
Coal Fired Power Generation Market Product Innovations
Recent product innovations focus on enhancing the efficiency and reducing the environmental impact of coal-fired power generation. High-efficiency low-emission (HELE) technologies, advanced flue gas desulfurization systems, and carbon capture, utilization, and storage (CCUS) are gaining traction. These innovations aim to address the growing concerns about air pollution and greenhouse gas emissions, improving the market fit of coal-fired power plants within a more stringent regulatory environment. The competitive advantage hinges on cost-effectiveness, emission reduction capabilities, and technological sophistication.
Report Segmentation & Scope
This report segments the Coal Fired Power Generation market based on technology:
Pulverized Coal Firing Systems (PC): This segment holds the largest market share, with a projected size of $xx Million in 2025, expected to grow at a CAGR of xx% during the forecast period. Competitive dynamics are primarily driven by cost optimization and efficiency improvements.
Cyclone Furnace: This segment represents a smaller but growing market share, driven by improved efficiency and lower emissions. It is projected to reach $xx Million by 2025 and experience a CAGR of xx% during the forecast period.
Other Technologies (Circulating Fluidized Bed and Coal Gasification): This segment offers the potential for significant growth, albeit with higher initial investment costs. It is projected to reach $xx Million in 2025, with a CAGR of xx% during the forecast period, driven by stricter environmental regulations.
Key Drivers of Coal Fired Power Generation Market Growth
The continued demand for electricity in developing nations remains the primary driver for Coal Fired Power Generation market growth. The relatively lower cost of coal compared to other energy sources in certain regions also contributes. Government policies supporting coal-fired power, particularly in regions with abundant coal reserves, play a role, although these are increasingly being challenged by environmental concerns. Technological advancements, such as HELE technologies, aim to mitigate environmental impact and extend the lifespan of coal-fired power plants.
Challenges in the Coal Fired Power Generation Market Sector
Stringent environmental regulations and increasing carbon emission limits pose significant challenges. The fluctuating prices of coal and its inherent volatility in the supply chain add to operational uncertainty. The growing adoption of renewable energy sources, accompanied by government incentives and falling renewable energy prices, creates intense competitive pressure. These factors have a quantifiable impact, slowing down market growth and potentially influencing investment decisions.
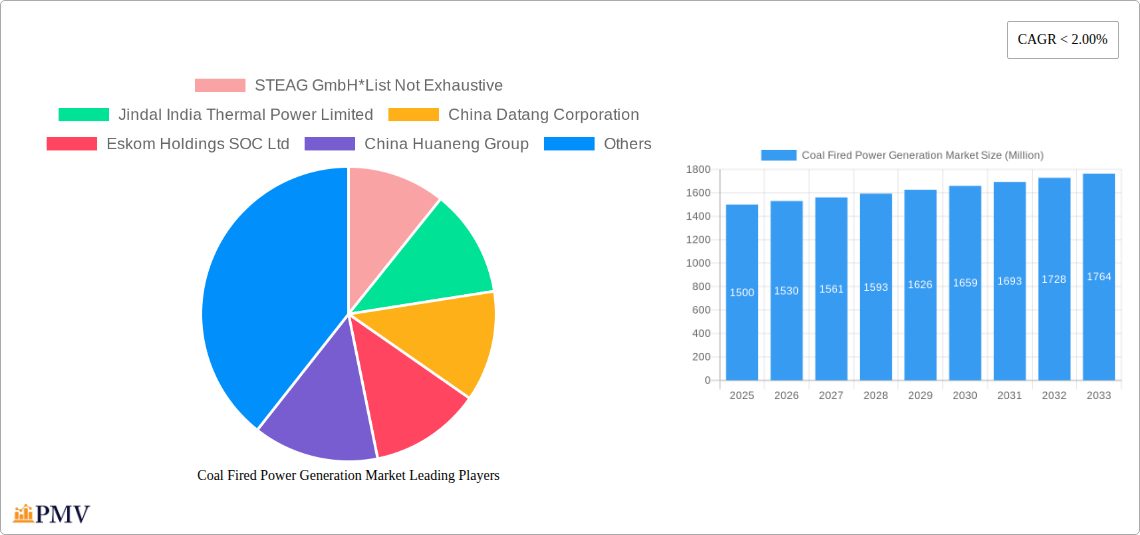
Leading Players in the Coal Fired Power Generation Market Market
- STEAG GmbH
- Jindal India Thermal Power Limited
- China Datang Corporation
- Eskom Holdings SOC Ltd
- China Huaneng Group
- RWE AG
- Dominion Energy Solutions
- Duke Energy Corporation
- National Thermal Power Corporation Limited
- Shenhua Group Corporation Limited
Key Developments in Coal Fired Power Generation Market Sector
- 2023: Several major power companies announced investments in HELE technologies, signaling a shift towards cleaner coal generation.
- 2022: Stricter emission regulations were implemented in several key markets, prompting some companies to retire older plants.
- 2021: A significant M&A deal involving two major players reshaped the market landscape.
Strategic Coal Fired Power Generation Market Market Outlook
The future of the Coal Fired Power Generation market hinges on technological advancements, regulatory landscapes, and the pace of renewable energy adoption. While the market faces significant headwinds, opportunities exist for companies to invest in cleaner technologies, optimize operations, and explore carbon capture solutions. Focus on efficiency improvements and strategic partnerships within the energy sector may provide a pathway for long-term growth, albeit at a slower pace than historically experienced.
Coal Fired Power Generation Market Segmentation
-
1. Technology
- 1.1. Pulverized Coal Firing Systems (PC)
- 1.2. Cyclone Furnace
- 1.3. Other Te
Coal Fired Power Generation Market Segmentation By Geography
- 1. North America
- 2. Europe
- 3. Asia Pacific
- 4. South America
- 5. Middle East and Africa

Coal Fired Power Generation Market REPORT HIGHLIGHTS
| Aspects | Details |
|---|---|
| Study Period | 2019-2033 |
| Base Year | 2024 |
| Estimated Year | 2025 |
| Forecast Period | 2025-2033 |
| Historical Period | 2019-2024 |
| Growth Rate | CAGR of < 2.00% from 2019-2033 |
| Segmentation |
|
Table of Contents
- 1. Introduction
- 1.1. Research Scope
- 1.2. Market Segmentation
- 1.3. Research Methodology
- 1.4. Definitions and Assumptions
- 2. Executive Summary
- 2.1. Introduction
- 3. Market Dynamics
- 3.1. Introduction
- 3.2. Market Drivers
- 3.2.1. Increasing Electricity Demand; Rising Investments in the Coal Industry
- 3.3. Market Restrains
- 3.3.1. Increasing Installation of Renewable Energy Sources
- 3.4. Market Trends
- 3.4.1. Pulverized Coal Firing Technology to Dominate the Market
- 4. Market Factor Analysis
- 4.1. Porters Five Forces
- 4.2. Supply/Value Chain
- 4.3. PESTEL analysis
- 4.4. Market Entropy
- 4.5. Patent/Trademark Analysis
- 5. Global Coal Fired Power Generation Market Analysis, Insights and Forecast, 2019-2031
- 5.1. Market Analysis, Insights and Forecast - by Technology
- 5.1.1. Pulverized Coal Firing Systems (PC)
- 5.1.2. Cyclone Furnace
- 5.1.3. Other Te
- 5.2. Market Analysis, Insights and Forecast - by Region
- 5.2.1. North America
- 5.2.2. Europe
- 5.2.3. Asia Pacific
- 5.2.4. South America
- 5.2.5. Middle East and Africa
- 5.1. Market Analysis, Insights and Forecast - by Technology
- 6. North America Coal Fired Power Generation Market Analysis, Insights and Forecast, 2019-2031
- 6.1. Market Analysis, Insights and Forecast - by Technology
- 6.1.1. Pulverized Coal Firing Systems (PC)
- 6.1.2. Cyclone Furnace
- 6.1.3. Other Te
- 6.1. Market Analysis, Insights and Forecast - by Technology
- 7. Europe Coal Fired Power Generation Market Analysis, Insights and Forecast, 2019-2031
- 7.1. Market Analysis, Insights and Forecast - by Technology
- 7.1.1. Pulverized Coal Firing Systems (PC)
- 7.1.2. Cyclone Furnace
- 7.1.3. Other Te
- 7.1. Market Analysis, Insights and Forecast - by Technology
- 8. Asia Pacific Coal Fired Power Generation Market Analysis, Insights and Forecast, 2019-2031
- 8.1. Market Analysis, Insights and Forecast - by Technology
- 8.1.1. Pulverized Coal Firing Systems (PC)
- 8.1.2. Cyclone Furnace
- 8.1.3. Other Te
- 8.1. Market Analysis, Insights and Forecast - by Technology
- 9. South America Coal Fired Power Generation Market Analysis, Insights and Forecast, 2019-2031
- 9.1. Market Analysis, Insights and Forecast - by Technology
- 9.1.1. Pulverized Coal Firing Systems (PC)
- 9.1.2. Cyclone Furnace
- 9.1.3. Other Te
- 9.1. Market Analysis, Insights and Forecast - by Technology
- 10. Middle East and Africa Coal Fired Power Generation Market Analysis, Insights and Forecast, 2019-2031
- 10.1. Market Analysis, Insights and Forecast - by Technology
- 10.1.1. Pulverized Coal Firing Systems (PC)
- 10.1.2. Cyclone Furnace
- 10.1.3. Other Te
- 10.1. Market Analysis, Insights and Forecast - by Technology
- 11. North America Coal Fired Power Generation Market Analysis, Insights and Forecast, 2019-2031
- 11.1. Market Analysis, Insights and Forecast - By Country/Sub-region
- 11.1.1 United States
- 11.1.2 Canada
- 11.1.3 Mexico
- 12. Europe Coal Fired Power Generation Market Analysis, Insights and Forecast, 2019-2031
- 12.1. Market Analysis, Insights and Forecast - By Country/Sub-region
- 12.1.1 Germany
- 12.1.2 United Kingdom
- 12.1.3 France
- 12.1.4 Spain
- 12.1.5 Italy
- 12.1.6 Spain
- 12.1.7 Belgium
- 12.1.8 Netherland
- 12.1.9 Nordics
- 12.1.10 Rest of Europe
- 13. Asia Pacific Coal Fired Power Generation Market Analysis, Insights and Forecast, 2019-2031
- 13.1. Market Analysis, Insights and Forecast - By Country/Sub-region
- 13.1.1 China
- 13.1.2 Japan
- 13.1.3 India
- 13.1.4 South Korea
- 13.1.5 Southeast Asia
- 13.1.6 Australia
- 13.1.7 Indonesia
- 13.1.8 Phillipes
- 13.1.9 Singapore
- 13.1.10 Thailandc
- 13.1.11 Rest of Asia Pacific
- 14. South America Coal Fired Power Generation Market Analysis, Insights and Forecast, 2019-2031
- 14.1. Market Analysis, Insights and Forecast - By Country/Sub-region
- 14.1.1 Brazil
- 14.1.2 Argentina
- 14.1.3 Peru
- 14.1.4 Chile
- 14.1.5 Colombia
- 14.1.6 Ecuador
- 14.1.7 Venezuela
- 14.1.8 Rest of South America
- 15. North America Coal Fired Power Generation Market Analysis, Insights and Forecast, 2019-2031
- 15.1. Market Analysis, Insights and Forecast - By Country/Sub-region
- 15.1.1 United States
- 15.1.2 Canada
- 15.1.3 Mexico
- 16. MEA Coal Fired Power Generation Market Analysis, Insights and Forecast, 2019-2031
- 16.1. Market Analysis, Insights and Forecast - By Country/Sub-region
- 16.1.1 United Arab Emirates
- 16.1.2 Saudi Arabia
- 16.1.3 South Africa
- 16.1.4 Rest of Middle East and Africa
- 17. Competitive Analysis
- 17.1. Global Market Share Analysis 2024
- 17.2. Company Profiles
- 17.2.1 STEAG GmbH*List Not Exhaustive
- 17.2.1.1. Overview
- 17.2.1.2. Products
- 17.2.1.3. SWOT Analysis
- 17.2.1.4. Recent Developments
- 17.2.1.5. Financials (Based on Availability)
- 17.2.2 Jindal India Thermal Power Limited
- 17.2.2.1. Overview
- 17.2.2.2. Products
- 17.2.2.3. SWOT Analysis
- 17.2.2.4. Recent Developments
- 17.2.2.5. Financials (Based on Availability)
- 17.2.3 China Datang Corporation
- 17.2.3.1. Overview
- 17.2.3.2. Products
- 17.2.3.3. SWOT Analysis
- 17.2.3.4. Recent Developments
- 17.2.3.5. Financials (Based on Availability)
- 17.2.4 Eskom Holdings SOC Ltd
- 17.2.4.1. Overview
- 17.2.4.2. Products
- 17.2.4.3. SWOT Analysis
- 17.2.4.4. Recent Developments
- 17.2.4.5. Financials (Based on Availability)
- 17.2.5 China Huaneng Group
- 17.2.5.1. Overview
- 17.2.5.2. Products
- 17.2.5.3. SWOT Analysis
- 17.2.5.4. Recent Developments
- 17.2.5.5. Financials (Based on Availability)
- 17.2.6 RWE AG
- 17.2.6.1. Overview
- 17.2.6.2. Products
- 17.2.6.3. SWOT Analysis
- 17.2.6.4. Recent Developments
- 17.2.6.5. Financials (Based on Availability)
- 17.2.7 Dominion Energy Solutions
- 17.2.7.1. Overview
- 17.2.7.2. Products
- 17.2.7.3. SWOT Analysis
- 17.2.7.4. Recent Developments
- 17.2.7.5. Financials (Based on Availability)
- 17.2.8 Duke Energy Corporation
- 17.2.8.1. Overview
- 17.2.8.2. Products
- 17.2.8.3. SWOT Analysis
- 17.2.8.4. Recent Developments
- 17.2.8.5. Financials (Based on Availability)
- 17.2.9 National Thermal Power Corporation Limited
- 17.2.9.1. Overview
- 17.2.9.2. Products
- 17.2.9.3. SWOT Analysis
- 17.2.9.4. Recent Developments
- 17.2.9.5. Financials (Based on Availability)
- 17.2.10 Shenhua Group Corporation Limited
- 17.2.10.1. Overview
- 17.2.10.2. Products
- 17.2.10.3. SWOT Analysis
- 17.2.10.4. Recent Developments
- 17.2.10.5. Financials (Based on Availability)
- 17.2.1 STEAG GmbH*List Not Exhaustive
List of Figures
- Figure 1: Global Coal Fired Power Generation Market Revenue Breakdown (Million, %) by Region 2024 & 2032
- Figure 2: North America Coal Fired Power Generation Market Revenue (Million), by Country 2024 & 2032
- Figure 3: North America Coal Fired Power Generation Market Revenue Share (%), by Country 2024 & 2032
- Figure 4: Europe Coal Fired Power Generation Market Revenue (Million), by Country 2024 & 2032
- Figure 5: Europe Coal Fired Power Generation Market Revenue Share (%), by Country 2024 & 2032
- Figure 6: Asia Pacific Coal Fired Power Generation Market Revenue (Million), by Country 2024 & 2032
- Figure 7: Asia Pacific Coal Fired Power Generation Market Revenue Share (%), by Country 2024 & 2032
- Figure 8: South America Coal Fired Power Generation Market Revenue (Million), by Country 2024 & 2032
- Figure 9: South America Coal Fired Power Generation Market Revenue Share (%), by Country 2024 & 2032
- Figure 10: North America Coal Fired Power Generation Market Revenue (Million), by Country 2024 & 2032
- Figure 11: North America Coal Fired Power Generation Market Revenue Share (%), by Country 2024 & 2032
- Figure 12: MEA Coal Fired Power Generation Market Revenue (Million), by Country 2024 & 2032
- Figure 13: MEA Coal Fired Power Generation Market Revenue Share (%), by Country 2024 & 2032
- Figure 14: North America Coal Fired Power Generation Market Revenue (Million), by Technology 2024 & 2032
- Figure 15: North America Coal Fired Power Generation Market Revenue Share (%), by Technology 2024 & 2032
- Figure 16: North America Coal Fired Power Generation Market Revenue (Million), by Country 2024 & 2032
- Figure 17: North America Coal Fired Power Generation Market Revenue Share (%), by Country 2024 & 2032
- Figure 18: Europe Coal Fired Power Generation Market Revenue (Million), by Technology 2024 & 2032
- Figure 19: Europe Coal Fired Power Generation Market Revenue Share (%), by Technology 2024 & 2032
- Figure 20: Europe Coal Fired Power Generation Market Revenue (Million), by Country 2024 & 2032
- Figure 21: Europe Coal Fired Power Generation Market Revenue Share (%), by Country 2024 & 2032
- Figure 22: Asia Pacific Coal Fired Power Generation Market Revenue (Million), by Technology 2024 & 2032
- Figure 23: Asia Pacific Coal Fired Power Generation Market Revenue Share (%), by Technology 2024 & 2032
- Figure 24: Asia Pacific Coal Fired Power Generation Market Revenue (Million), by Country 2024 & 2032
- Figure 25: Asia Pacific Coal Fired Power Generation Market Revenue Share (%), by Country 2024 & 2032
- Figure 26: South America Coal Fired Power Generation Market Revenue (Million), by Technology 2024 & 2032
- Figure 27: South America Coal Fired Power Generation Market Revenue Share (%), by Technology 2024 & 2032
- Figure 28: South America Coal Fired Power Generation Market Revenue (Million), by Country 2024 & 2032
- Figure 29: South America Coal Fired Power Generation Market Revenue Share (%), by Country 2024 & 2032
- Figure 30: Middle East and Africa Coal Fired Power Generation Market Revenue (Million), by Technology 2024 & 2032
- Figure 31: Middle East and Africa Coal Fired Power Generation Market Revenue Share (%), by Technology 2024 & 2032
- Figure 32: Middle East and Africa Coal Fired Power Generation Market Revenue (Million), by Country 2024 & 2032
- Figure 33: Middle East and Africa Coal Fired Power Generation Market Revenue Share (%), by Country 2024 & 2032
List of Tables
- Table 1: Global Coal Fired Power Generation Market Revenue Million Forecast, by Region 2019 & 2032
- Table 2: Global Coal Fired Power Generation Market Revenue Million Forecast, by Technology 2019 & 2032
- Table 3: Global Coal Fired Power Generation Market Revenue Million Forecast, by Region 2019 & 2032
- Table 4: Global Coal Fired Power Generation Market Revenue Million Forecast, by Country 2019 & 2032
- Table 5: United States Coal Fired Power Generation Market Revenue (Million) Forecast, by Application 2019 & 2032
- Table 6: Canada Coal Fired Power Generation Market Revenue (Million) Forecast, by Application 2019 & 2032
- Table 7: Mexico Coal Fired Power Generation Market Revenue (Million) Forecast, by Application 2019 & 2032
- Table 8: Global Coal Fired Power Generation Market Revenue Million Forecast, by Country 2019 & 2032
- Table 9: Germany Coal Fired Power Generation Market Revenue (Million) Forecast, by Application 2019 & 2032
- Table 10: United Kingdom Coal Fired Power Generation Market Revenue (Million) Forecast, by Application 2019 & 2032
- Table 11: France Coal Fired Power Generation Market Revenue (Million) Forecast, by Application 2019 & 2032
- Table 12: Spain Coal Fired Power Generation Market Revenue (Million) Forecast, by Application 2019 & 2032
- Table 13: Italy Coal Fired Power Generation Market Revenue (Million) Forecast, by Application 2019 & 2032
- Table 14: Spain Coal Fired Power Generation Market Revenue (Million) Forecast, by Application 2019 & 2032
- Table 15: Belgium Coal Fired Power Generation Market Revenue (Million) Forecast, by Application 2019 & 2032
- Table 16: Netherland Coal Fired Power Generation Market Revenue (Million) Forecast, by Application 2019 & 2032
- Table 17: Nordics Coal Fired Power Generation Market Revenue (Million) Forecast, by Application 2019 & 2032
- Table 18: Rest of Europe Coal Fired Power Generation Market Revenue (Million) Forecast, by Application 2019 & 2032
- Table 19: Global Coal Fired Power Generation Market Revenue Million Forecast, by Country 2019 & 2032
- Table 20: China Coal Fired Power Generation Market Revenue (Million) Forecast, by Application 2019 & 2032
- Table 21: Japan Coal Fired Power Generation Market Revenue (Million) Forecast, by Application 2019 & 2032
- Table 22: India Coal Fired Power Generation Market Revenue (Million) Forecast, by Application 2019 & 2032
- Table 23: South Korea Coal Fired Power Generation Market Revenue (Million) Forecast, by Application 2019 & 2032
- Table 24: Southeast Asia Coal Fired Power Generation Market Revenue (Million) Forecast, by Application 2019 & 2032
- Table 25: Australia Coal Fired Power Generation Market Revenue (Million) Forecast, by Application 2019 & 2032
- Table 26: Indonesia Coal Fired Power Generation Market Revenue (Million) Forecast, by Application 2019 & 2032
- Table 27: Phillipes Coal Fired Power Generation Market Revenue (Million) Forecast, by Application 2019 & 2032
- Table 28: Singapore Coal Fired Power Generation Market Revenue (Million) Forecast, by Application 2019 & 2032
- Table 29: Thailandc Coal Fired Power Generation Market Revenue (Million) Forecast, by Application 2019 & 2032
- Table 30: Rest of Asia Pacific Coal Fired Power Generation Market Revenue (Million) Forecast, by Application 2019 & 2032
- Table 31: Global Coal Fired Power Generation Market Revenue Million Forecast, by Country 2019 & 2032
- Table 32: Brazil Coal Fired Power Generation Market Revenue (Million) Forecast, by Application 2019 & 2032
- Table 33: Argentina Coal Fired Power Generation Market Revenue (Million) Forecast, by Application 2019 & 2032
- Table 34: Peru Coal Fired Power Generation Market Revenue (Million) Forecast, by Application 2019 & 2032
- Table 35: Chile Coal Fired Power Generation Market Revenue (Million) Forecast, by Application 2019 & 2032
- Table 36: Colombia Coal Fired Power Generation Market Revenue (Million) Forecast, by Application 2019 & 2032
- Table 37: Ecuador Coal Fired Power Generation Market Revenue (Million) Forecast, by Application 2019 & 2032
- Table 38: Venezuela Coal Fired Power Generation Market Revenue (Million) Forecast, by Application 2019 & 2032
- Table 39: Rest of South America Coal Fired Power Generation Market Revenue (Million) Forecast, by Application 2019 & 2032
- Table 40: Global Coal Fired Power Generation Market Revenue Million Forecast, by Country 2019 & 2032
- Table 41: United States Coal Fired Power Generation Market Revenue (Million) Forecast, by Application 2019 & 2032
- Table 42: Canada Coal Fired Power Generation Market Revenue (Million) Forecast, by Application 2019 & 2032
- Table 43: Mexico Coal Fired Power Generation Market Revenue (Million) Forecast, by Application 2019 & 2032
- Table 44: Global Coal Fired Power Generation Market Revenue Million Forecast, by Country 2019 & 2032
- Table 45: United Arab Emirates Coal Fired Power Generation Market Revenue (Million) Forecast, by Application 2019 & 2032
- Table 46: Saudi Arabia Coal Fired Power Generation Market Revenue (Million) Forecast, by Application 2019 & 2032
- Table 47: South Africa Coal Fired Power Generation Market Revenue (Million) Forecast, by Application 2019 & 2032
- Table 48: Rest of Middle East and Africa Coal Fired Power Generation Market Revenue (Million) Forecast, by Application 2019 & 2032
- Table 49: Global Coal Fired Power Generation Market Revenue Million Forecast, by Technology 2019 & 2032
- Table 50: Global Coal Fired Power Generation Market Revenue Million Forecast, by Country 2019 & 2032
- Table 51: Global Coal Fired Power Generation Market Revenue Million Forecast, by Technology 2019 & 2032
- Table 52: Global Coal Fired Power Generation Market Revenue Million Forecast, by Country 2019 & 2032
- Table 53: Global Coal Fired Power Generation Market Revenue Million Forecast, by Technology 2019 & 2032
- Table 54: Global Coal Fired Power Generation Market Revenue Million Forecast, by Country 2019 & 2032
- Table 55: Global Coal Fired Power Generation Market Revenue Million Forecast, by Technology 2019 & 2032
- Table 56: Global Coal Fired Power Generation Market Revenue Million Forecast, by Country 2019 & 2032
- Table 57: Global Coal Fired Power Generation Market Revenue Million Forecast, by Technology 2019 & 2032
- Table 58: Global Coal Fired Power Generation Market Revenue Million Forecast, by Country 2019 & 2032
Frequently Asked Questions
1. What is the projected Compound Annual Growth Rate (CAGR) of the Coal Fired Power Generation Market?
The projected CAGR is approximately < 2.00%.
2. Which companies are prominent players in the Coal Fired Power Generation Market?
Key companies in the market include STEAG GmbH*List Not Exhaustive, Jindal India Thermal Power Limited, China Datang Corporation, Eskom Holdings SOC Ltd, China Huaneng Group, RWE AG, Dominion Energy Solutions, Duke Energy Corporation, National Thermal Power Corporation Limited, Shenhua Group Corporation Limited.
3. What are the main segments of the Coal Fired Power Generation Market?
The market segments include Technology.
4. Can you provide details about the market size?
The market size is estimated to be USD XX Million as of 2022.
5. What are some drivers contributing to market growth?
Increasing Electricity Demand; Rising Investments in the Coal Industry.
6. What are the notable trends driving market growth?
Pulverized Coal Firing Technology to Dominate the Market.
7. Are there any restraints impacting market growth?
Increasing Installation of Renewable Energy Sources.
8. Can you provide examples of recent developments in the market?
N/A
9. What pricing options are available for accessing the report?
Pricing options include single-user, multi-user, and enterprise licenses priced at USD 4750, USD 5250, and USD 8750 respectively.
10. Is the market size provided in terms of value or volume?
The market size is provided in terms of value, measured in Million.
11. Are there any specific market keywords associated with the report?
Yes, the market keyword associated with the report is "Coal Fired Power Generation Market," which aids in identifying and referencing the specific market segment covered.
12. How do I determine which pricing option suits my needs best?
The pricing options vary based on user requirements and access needs. Individual users may opt for single-user licenses, while businesses requiring broader access may choose multi-user or enterprise licenses for cost-effective access to the report.
13. Are there any additional resources or data provided in the Coal Fired Power Generation Market report?
While the report offers comprehensive insights, it's advisable to review the specific contents or supplementary materials provided to ascertain if additional resources or data are available.
14. How can I stay updated on further developments or reports in the Coal Fired Power Generation Market?
To stay informed about further developments, trends, and reports in the Coal Fired Power Generation Market, consider subscribing to industry newsletters, following relevant companies and organizations, or regularly checking reputable industry news sources and publications.
Methodology
Step 1 - Identification of Relevant Samples Size from Population Database


Step 2 - Approaches for Defining Global Market Size (Value, Volume* & Price*)

Note*: In applicable scenarios
Step 3 - Data Sources
Primary Research
- Web Analytics
- Survey Reports
- Research Institute
- Latest Research Reports
- Opinion Leaders
Secondary Research
- Annual Reports
- White Paper
- Latest Press Release
- Industry Association
- Paid Database
- Investor Presentations

Step 4 - Data Triangulation
Involves using different sources of information in order to increase the validity of a study
These sources are likely to be stakeholders in a program - participants, other researchers, program staff, other community members, and so on.
Then we put all data in single framework & apply various statistical tools to find out the dynamic on the market.
During the analysis stage, feedback from the stakeholder groups would be compared to determine areas of agreement as well as areas of divergence


