
Key Insights
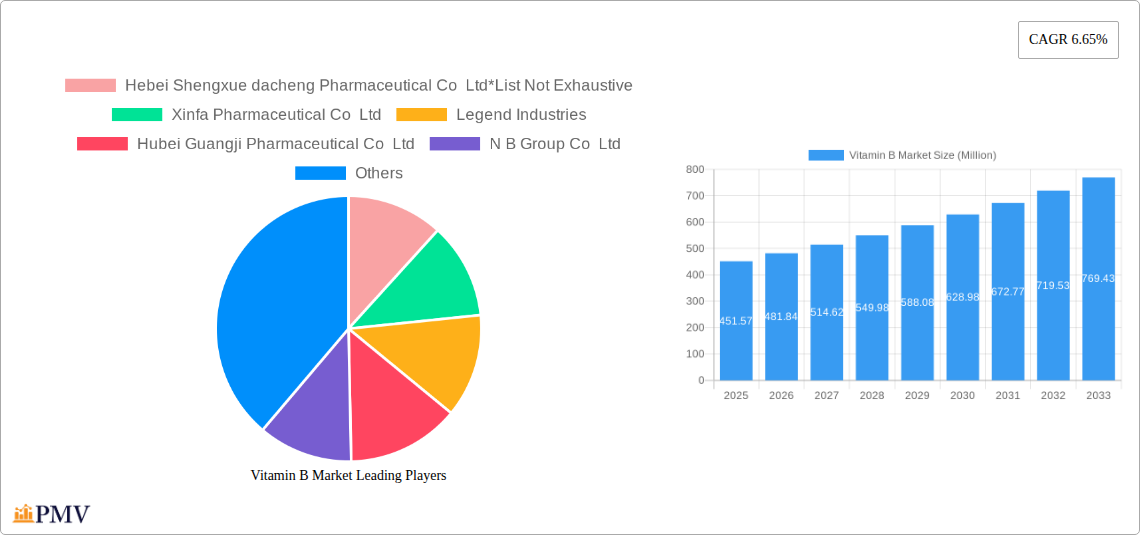
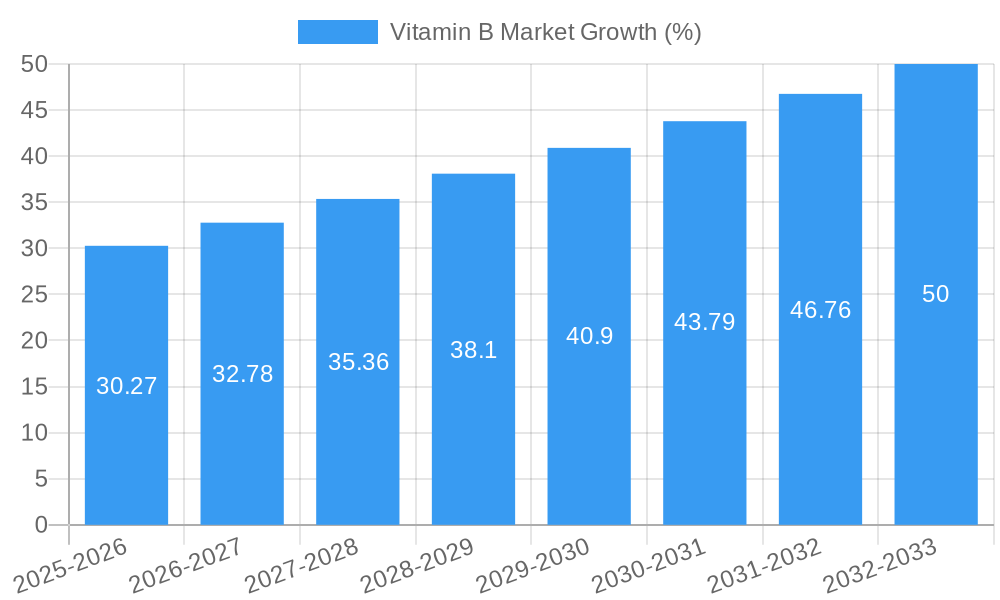
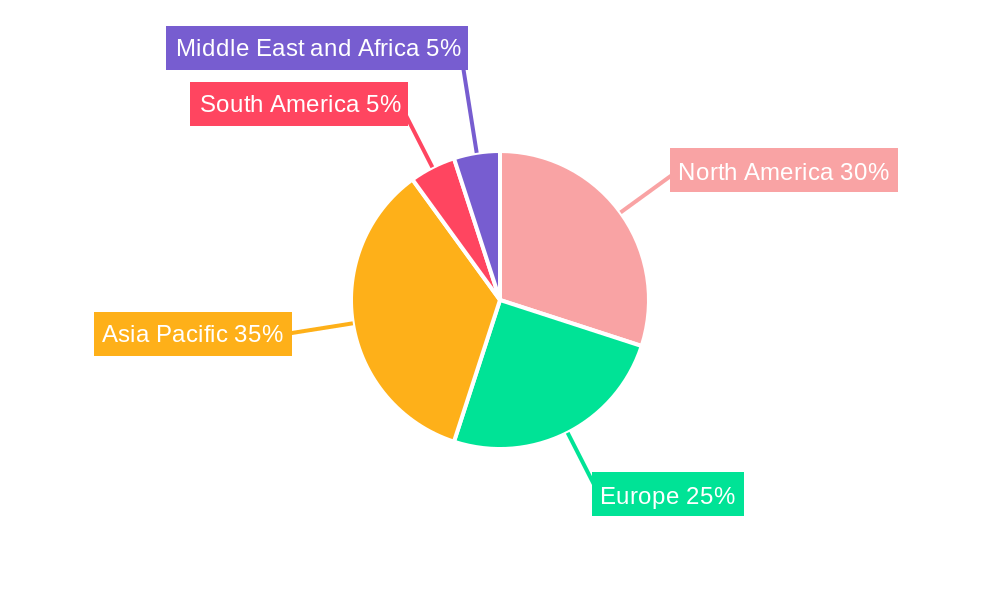
The global Vitamin B market, valued at $451.57 million in 2025, is projected to experience robust growth, driven by increasing consumer awareness of the health benefits associated with Vitamin B deficiencies. The market's Compound Annual Growth Rate (CAGR) of 6.65% from 2025 to 2033 indicates significant expansion opportunities. Key growth drivers include the rising prevalence of vitamin deficiencies globally, the increasing demand for nutritional supplements across various demographics, and the growing application of Vitamin B in functional foods and beverages. The powder form dominates the market due to its versatility and cost-effectiveness in various applications. Significant market segments include food and beverages, dietary supplements, and pharmaceuticals, reflecting the widespread utilization of Vitamin B across diverse industries. While the North American and European markets are currently mature, the Asia-Pacific region is anticipated to witness substantial growth driven by rising disposable incomes and increasing health consciousness in emerging economies like China and India. Market restraints include potential price fluctuations in raw materials and stringent regulatory approvals needed for new product launches. However, the overall market outlook remains positive, fueled by continued innovation and increasing consumer demand for health-promoting products.
The competitive landscape is characterized by a mix of large multinational corporations and regional players. Major players are strategically focusing on product diversification, expanding their geographical reach, and investing in research and development to introduce innovative Vitamin B formulations. The market shows promising potential for the development of novel delivery systems and functional formulations catering to specific health needs. Further growth may be influenced by governmental initiatives promoting healthier lifestyles and increasing investments in public health awareness campaigns. Overall, the Vitamin B market is poised for considerable expansion over the forecast period, presenting lucrative opportunities for established players and new entrants alike.
Vitamin B Market: A Comprehensive Report (2019-2033)
This comprehensive report provides an in-depth analysis of the Vitamin B market, offering valuable insights into market dynamics, growth drivers, competitive landscape, and future trends. Covering the period from 2019 to 2033, with a base year of 2025 and a forecast period of 2025-2033, this report is an essential resource for industry stakeholders seeking to understand and capitalize on opportunities within this dynamic market. The report analyzes a market valued at xx Million in 2025, projected to reach xx Million by 2033, exhibiting a CAGR of xx%.
Vitamin B Market Structure & Competitive Dynamics
This section analyzes the competitive intensity, innovation landscape, regulatory environment, and market evolution within the Vitamin B market. The market exhibits a moderately consolidated structure, with key players holding significant market share, although fragmentation exists amongst smaller niche players. The top 5 players likely account for approximately xx% of the global market share in 2025, while the remaining share is distributed amongst numerous smaller companies. Innovation in delivery systems (e.g., targeted release formulations) and new applications fuels market growth. Stringent regulatory frameworks, varying by region, impact product approvals and market entry. Significant M&A activity has reshaped the industry, notably the 2022 merger of Royal DSM and Firmenich, creating a major player with combined sales exceeding USD 13.58 Billion. The deal significantly alters competitive dynamics and expands the market reach of the combined entity. Other deals, though smaller, also contribute to shifting market share. The average M&A deal value in the Vitamin B sector over the past 5 years has been approximately xx Million.
Vitamin B Market Industry Trends & Insights
The Vitamin B market is experiencing robust growth driven by increasing consumer health consciousness, the rising prevalence of vitamin deficiencies, and expanding applications across various sectors. The rising demand for fortified foods and beverages, coupled with the growing popularity of dietary supplements, is a significant growth driver. Technological advancements, including improved extraction and purification methods, lead to enhanced product quality and cost efficiency. The market is also witnessing a shift in consumer preferences toward natural and organic Vitamin B sources, impacting product formulation and marketing strategies. The CAGR for the global Vitamin B market is projected to be xx% during the forecast period (2025-2033), demonstrating strong and sustained growth. Market penetration, particularly in developing economies, remains high due to affordability and increasing awareness of the health benefits of Vitamin B.
Dominant Markets & Segments in Vitamin B Market
The Vitamin B market demonstrates regional variations in dominance. The Asia-Pacific region currently holds a leading market share, fueled by a rapidly growing population and increasing disposable incomes. Within this region, countries such as China and India exhibit significant growth potential.
Key Drivers for the Asia-Pacific Region:
- Rapid economic growth and rising disposable incomes.
- Growing awareness of health and wellness.
- Increasing demand for fortified food and beverages.
- Favorable government policies promoting nutrition and health.
Dominant Segments:
- Form: Powder currently holds a larger market share than liquid due to its cost-effectiveness and suitability for various applications.
- Application: Dietary supplements represent the largest segment driven by increasing health consciousness and self-medication. The Pharmaceuticals segment is also growing significantly, driven by its use in various medications.
The detailed dominance analysis reveals that the Powder form and Dietary Supplements application hold substantial market share, driven by factors outlined above.
Vitamin B Market Product Innovations
Recent innovations focus on enhancing bioavailability, improving stability, and developing novel delivery systems. The market is witnessing the introduction of liposomal and sustained-release Vitamin B formulations, enhancing absorption and efficacy. These innovations cater to specific consumer needs and improve the overall value proposition, driving market competition and accelerating product development.
Report Segmentation & Scope
This report segments the Vitamin B market based on form (Powder, Liquid) and application (Food and Beverages, Dietary Supplements, Pharmaceuticals, Animal Feed, Personal Care, Other Applications). Each segment is assessed for market size, growth rate, and competitive intensity. Powder Vitamin B is projected to maintain a larger market share compared to liquid. The Dietary Supplements application segment is anticipated to maintain the highest growth rate and market share during the forecast period. The Pharmaceuticals segment is projected to experience significant growth driven by increasing medication usage. The Animal Feed segment is likely to grow steadily due to increased demand for animal protein globally.
Key Drivers of Vitamin B Market Growth
Several factors are driving Vitamin B market growth:
- Increasing awareness of the health benefits of Vitamin B, leading to greater consumption through dietary supplements and fortified foods.
- Technological advancements in production and purification, resulting in higher quality and affordability.
- Growth of the healthcare sector and increased focus on preventative health.
- Favorable government regulations promoting health and nutrition, along with food fortification programs.
Challenges in the Vitamin B Market Sector
The Vitamin B market faces challenges including:
- Fluctuations in raw material prices impacting production costs.
- Stringent regulatory approvals in various countries, adding to time and cost constraints.
- Competition from other nutritional supplements and functional foods.
- Maintaining consistent quality and purity of Vitamin B products due to sourcing and manufacturing factors. This contributes to about xx% of total market costs.
Leading Players in the Vitamin B Market
- Hebei Shengxue dacheng Pharmaceutical Co Ltd
- Xinfa Pharmaceutical Co Ltd
- Legend Industries
- Hubei Guangji Pharmaceutical Co Ltd
- N B Group Co Ltd
- BASF SE
- Shanghai Acebright Pharmaceuticals Group Co Ltd
- Parchem Fine & Specialty Chemicals
- Shanghai Hegno Pharmaceutical Holding Co Ltd
- Koninklijke DSM NV
Key Developments in Vitamin B Market Sector
- May 2023: DSM-Firmenich AG completed its merger with Firmenich International SA, creating a major player in the nutrition, health, and beauty sectors. This significantly impacts market consolidation and competition.
- May 2022: Royal DSM's merger with Firmenich was announced, reshaping the competitive landscape and resulting in four business units, including health and nutrition, with combined sales of approximately USD 13.58 Billion.
- December 2021: Kobe University research highlighted the anti-aging potential of Vitamin B2, boosting consumer interest and market demand for specific Vitamin B products.
Strategic Vitamin B Market Outlook
The Vitamin B market holds significant growth potential, driven by increasing demand for functional foods, fortified products, and targeted health supplements. Strategic opportunities lie in developing innovative delivery systems, focusing on personalized nutrition, and expanding into emerging markets. Companies can leverage technological advancements to improve product efficacy, sustainability, and cost-effectiveness. Further research into the specific health benefits of individual Vitamin B types will also drive market growth.
Vitamin B Market Segmentation
-
1. Form
- 1.1. Powder
- 1.2. Liquid
-
2. Application
- 2.1. Food and Beverages
- 2.2. Dietary Suppplements
- 2.3. Pharmaceuticals
- 2.4. Animal Feed
- 2.5. Personal Care
- 2.6. Other Applications
Vitamin B Market Segmentation By Geography
-
1. North America
- 1.1. United States
- 1.2. Canada
- 1.3. Mexico
- 1.4. Rest of North America
-
2. Europe
- 2.1. Spain
- 2.2. United Kingdom
- 2.3. Germany
- 2.4. France
- 2.5. Italy
- 2.6. Russia
- 2.7. Rest of Europe
-
3. Asia Pacific
- 3.1. China
- 3.2. Japan
- 3.3. India
- 3.4. Australia
- 3.5. Rest of Asia Pacific
-
4. South America
- 4.1. Brazil
- 4.2. Argentina
- 4.3. Rest of South America
-
5. Middle East and Africa
- 5.1. South Africa
- 5.2. Saudi Arabia
- 5.3. Rest of Middle East and Africa
Vitamin B Market REPORT HIGHLIGHTS
| Aspects | Details |
|---|---|
| Study Period | 2019-2033 |
| Base Year | 2024 |
| Estimated Year | 2025 |
| Forecast Period | 2025-2033 |
| Historical Period | 2019-2024 |
| Growth Rate | CAGR of 6.65% from 2019-2033 |
| Segmentation |
|
Table of Contents
- 1. Introduction
- 1.1. Research Scope
- 1.2. Market Segmentation
- 1.3. Research Methodology
- 1.4. Definitions and Assumptions
- 2. Executive Summary
- 2.1. Introduction
- 3. Market Dynamics
- 3.1. Introduction
- 3.2. Market Drivers
- 3.2.1. Increasing Demand for Functional and Fortified Food; Multi-functionality and Wide Application of Riboflavin
- 3.3. Market Restrains
- 3.3.1. Low Stability of Riboflavin on Exposure to Light and Heat
- 3.4. Market Trends
- 3.4.1. Increasing Demand for Functional and Fortified Food
- 4. Market Factor Analysis
- 4.1. Porters Five Forces
- 4.2. Supply/Value Chain
- 4.3. PESTEL analysis
- 4.4. Market Entropy
- 4.5. Patent/Trademark Analysis
- 5. Global Vitamin B Market Analysis, Insights and Forecast, 2019-2031
- 5.1. Market Analysis, Insights and Forecast - by Form
- 5.1.1. Powder
- 5.1.2. Liquid
- 5.2. Market Analysis, Insights and Forecast - by Application
- 5.2.1. Food and Beverages
- 5.2.2. Dietary Suppplements
- 5.2.3. Pharmaceuticals
- 5.2.4. Animal Feed
- 5.2.5. Personal Care
- 5.2.6. Other Applications
- 5.3. Market Analysis, Insights and Forecast - by Region
- 5.3.1. North America
- 5.3.2. Europe
- 5.3.3. Asia Pacific
- 5.3.4. South America
- 5.3.5. Middle East and Africa
- 5.1. Market Analysis, Insights and Forecast - by Form
- 6. North America Vitamin B Market Analysis, Insights and Forecast, 2019-2031
- 6.1. Market Analysis, Insights and Forecast - by Form
- 6.1.1. Powder
- 6.1.2. Liquid
- 6.2. Market Analysis, Insights and Forecast - by Application
- 6.2.1. Food and Beverages
- 6.2.2. Dietary Suppplements
- 6.2.3. Pharmaceuticals
- 6.2.4. Animal Feed
- 6.2.5. Personal Care
- 6.2.6. Other Applications
- 6.1. Market Analysis, Insights and Forecast - by Form
- 7. Europe Vitamin B Market Analysis, Insights and Forecast, 2019-2031
- 7.1. Market Analysis, Insights and Forecast - by Form
- 7.1.1. Powder
- 7.1.2. Liquid
- 7.2. Market Analysis, Insights and Forecast - by Application
- 7.2.1. Food and Beverages
- 7.2.2. Dietary Suppplements
- 7.2.3. Pharmaceuticals
- 7.2.4. Animal Feed
- 7.2.5. Personal Care
- 7.2.6. Other Applications
- 7.1. Market Analysis, Insights and Forecast - by Form
- 8. Asia Pacific Vitamin B Market Analysis, Insights and Forecast, 2019-2031
- 8.1. Market Analysis, Insights and Forecast - by Form
- 8.1.1. Powder
- 8.1.2. Liquid
- 8.2. Market Analysis, Insights and Forecast - by Application
- 8.2.1. Food and Beverages
- 8.2.2. Dietary Suppplements
- 8.2.3. Pharmaceuticals
- 8.2.4. Animal Feed
- 8.2.5. Personal Care
- 8.2.6. Other Applications
- 8.1. Market Analysis, Insights and Forecast - by Form
- 9. South America Vitamin B Market Analysis, Insights and Forecast, 2019-2031
- 9.1. Market Analysis, Insights and Forecast - by Form
- 9.1.1. Powder
- 9.1.2. Liquid
- 9.2. Market Analysis, Insights and Forecast - by Application
- 9.2.1. Food and Beverages
- 9.2.2. Dietary Suppplements
- 9.2.3. Pharmaceuticals
- 9.2.4. Animal Feed
- 9.2.5. Personal Care
- 9.2.6. Other Applications
- 9.1. Market Analysis, Insights and Forecast - by Form
- 10. Middle East and Africa Vitamin B Market Analysis, Insights and Forecast, 2019-2031
- 10.1. Market Analysis, Insights and Forecast - by Form
- 10.1.1. Powder
- 10.1.2. Liquid
- 10.2. Market Analysis, Insights and Forecast - by Application
- 10.2.1. Food and Beverages
- 10.2.2. Dietary Suppplements
- 10.2.3. Pharmaceuticals
- 10.2.4. Animal Feed
- 10.2.5. Personal Care
- 10.2.6. Other Applications
- 10.1. Market Analysis, Insights and Forecast - by Form
- 11. North America Vitamin B Market Analysis, Insights and Forecast, 2019-2031
- 11.1. Market Analysis, Insights and Forecast - By Country/Sub-region
- 11.1.1 United States
- 11.1.2 Canada
- 11.1.3 Mexico
- 11.1.4 Rest of North America
- 12. Europe Vitamin B Market Analysis, Insights and Forecast, 2019-2031
- 12.1. Market Analysis, Insights and Forecast - By Country/Sub-region
- 12.1.1 Spain
- 12.1.2 United Kingdom
- 12.1.3 Germany
- 12.1.4 France
- 12.1.5 Italy
- 12.1.6 Russia
- 12.1.7 Rest of Europe
- 13. Asia Pacific Vitamin B Market Analysis, Insights and Forecast, 2019-2031
- 13.1. Market Analysis, Insights and Forecast - By Country/Sub-region
- 13.1.1 China
- 13.1.2 Japan
- 13.1.3 India
- 13.1.4 Australia
- 13.1.5 Rest of Asia Pacific
- 14. South America Vitamin B Market Analysis, Insights and Forecast, 2019-2031
- 14.1. Market Analysis, Insights and Forecast - By Country/Sub-region
- 14.1.1 Brazil
- 14.1.2 Argentina
- 14.1.3 Rest of South America
- 15. Middle East and Africa Vitamin B Market Analysis, Insights and Forecast, 2019-2031
- 15.1. Market Analysis, Insights and Forecast - By Country/Sub-region
- 15.1.1 South Africa
- 15.1.2 Saudi Arabia
- 15.1.3 Rest of Middle East and Africa
- 16. Competitive Analysis
- 16.1. Global Market Share Analysis 2024
- 16.2. Company Profiles
- 16.2.1 Hebei Shengxue dacheng Pharmaceutical Co Ltd*List Not Exhaustive
- 16.2.1.1. Overview
- 16.2.1.2. Products
- 16.2.1.3. SWOT Analysis
- 16.2.1.4. Recent Developments
- 16.2.1.5. Financials (Based on Availability)
- 16.2.2 Xinfa Pharmaceutical Co Ltd
- 16.2.2.1. Overview
- 16.2.2.2. Products
- 16.2.2.3. SWOT Analysis
- 16.2.2.4. Recent Developments
- 16.2.2.5. Financials (Based on Availability)
- 16.2.3 Legend Industries
- 16.2.3.1. Overview
- 16.2.3.2. Products
- 16.2.3.3. SWOT Analysis
- 16.2.3.4. Recent Developments
- 16.2.3.5. Financials (Based on Availability)
- 16.2.4 Hubei Guangji Pharmaceutical Co Ltd
- 16.2.4.1. Overview
- 16.2.4.2. Products
- 16.2.4.3. SWOT Analysis
- 16.2.4.4. Recent Developments
- 16.2.4.5. Financials (Based on Availability)
- 16.2.5 N B Group Co Ltd
- 16.2.5.1. Overview
- 16.2.5.2. Products
- 16.2.5.3. SWOT Analysis
- 16.2.5.4. Recent Developments
- 16.2.5.5. Financials (Based on Availability)
- 16.2.6 BASF SE
- 16.2.6.1. Overview
- 16.2.6.2. Products
- 16.2.6.3. SWOT Analysis
- 16.2.6.4. Recent Developments
- 16.2.6.5. Financials (Based on Availability)
- 16.2.7 Shanghai Acebright Pharmaceuticals Group Co Ltd
- 16.2.7.1. Overview
- 16.2.7.2. Products
- 16.2.7.3. SWOT Analysis
- 16.2.7.4. Recent Developments
- 16.2.7.5. Financials (Based on Availability)
- 16.2.8 Parchem Fine & Specialty Chemicals
- 16.2.8.1. Overview
- 16.2.8.2. Products
- 16.2.8.3. SWOT Analysis
- 16.2.8.4. Recent Developments
- 16.2.8.5. Financials (Based on Availability)
- 16.2.9 Shanghai Hegno Pharmaceutical Holding Co Ltd
- 16.2.9.1. Overview
- 16.2.9.2. Products
- 16.2.9.3. SWOT Analysis
- 16.2.9.4. Recent Developments
- 16.2.9.5. Financials (Based on Availability)
- 16.2.10 Koninklijke DSM NV
- 16.2.10.1. Overview
- 16.2.10.2. Products
- 16.2.10.3. SWOT Analysis
- 16.2.10.4. Recent Developments
- 16.2.10.5. Financials (Based on Availability)
- 16.2.1 Hebei Shengxue dacheng Pharmaceutical Co Ltd*List Not Exhaustive
List of Figures
- Figure 1: Global Vitamin B Market Revenue Breakdown (Million, %) by Region 2024 & 2032
- Figure 2: Global Vitamin B Market Volume Breakdown (Tons, %) by Region 2024 & 2032
- Figure 3: North America Vitamin B Market Revenue (Million), by Country 2024 & 2032
- Figure 4: North America Vitamin B Market Volume (Tons), by Country 2024 & 2032
- Figure 5: North America Vitamin B Market Revenue Share (%), by Country 2024 & 2032
- Figure 6: North America Vitamin B Market Volume Share (%), by Country 2024 & 2032
- Figure 7: Europe Vitamin B Market Revenue (Million), by Country 2024 & 2032
- Figure 8: Europe Vitamin B Market Volume (Tons), by Country 2024 & 2032
- Figure 9: Europe Vitamin B Market Revenue Share (%), by Country 2024 & 2032
- Figure 10: Europe Vitamin B Market Volume Share (%), by Country 2024 & 2032
- Figure 11: Asia Pacific Vitamin B Market Revenue (Million), by Country 2024 & 2032
- Figure 12: Asia Pacific Vitamin B Market Volume (Tons), by Country 2024 & 2032
- Figure 13: Asia Pacific Vitamin B Market Revenue Share (%), by Country 2024 & 2032
- Figure 14: Asia Pacific Vitamin B Market Volume Share (%), by Country 2024 & 2032
- Figure 15: South America Vitamin B Market Revenue (Million), by Country 2024 & 2032
- Figure 16: South America Vitamin B Market Volume (Tons), by Country 2024 & 2032
- Figure 17: South America Vitamin B Market Revenue Share (%), by Country 2024 & 2032
- Figure 18: South America Vitamin B Market Volume Share (%), by Country 2024 & 2032
- Figure 19: Middle East and Africa Vitamin B Market Revenue (Million), by Country 2024 & 2032
- Figure 20: Middle East and Africa Vitamin B Market Volume (Tons), by Country 2024 & 2032
- Figure 21: Middle East and Africa Vitamin B Market Revenue Share (%), by Country 2024 & 2032
- Figure 22: Middle East and Africa Vitamin B Market Volume Share (%), by Country 2024 & 2032
- Figure 23: North America Vitamin B Market Revenue (Million), by Form 2024 & 2032
- Figure 24: North America Vitamin B Market Volume (Tons), by Form 2024 & 2032
- Figure 25: North America Vitamin B Market Revenue Share (%), by Form 2024 & 2032
- Figure 26: North America Vitamin B Market Volume Share (%), by Form 2024 & 2032
- Figure 27: North America Vitamin B Market Revenue (Million), by Application 2024 & 2032
- Figure 28: North America Vitamin B Market Volume (Tons), by Application 2024 & 2032
- Figure 29: North America Vitamin B Market Revenue Share (%), by Application 2024 & 2032
- Figure 30: North America Vitamin B Market Volume Share (%), by Application 2024 & 2032
- Figure 31: North America Vitamin B Market Revenue (Million), by Country 2024 & 2032
- Figure 32: North America Vitamin B Market Volume (Tons), by Country 2024 & 2032
- Figure 33: North America Vitamin B Market Revenue Share (%), by Country 2024 & 2032
- Figure 34: North America Vitamin B Market Volume Share (%), by Country 2024 & 2032
- Figure 35: Europe Vitamin B Market Revenue (Million), by Form 2024 & 2032
- Figure 36: Europe Vitamin B Market Volume (Tons), by Form 2024 & 2032
- Figure 37: Europe Vitamin B Market Revenue Share (%), by Form 2024 & 2032
- Figure 38: Europe Vitamin B Market Volume Share (%), by Form 2024 & 2032
- Figure 39: Europe Vitamin B Market Revenue (Million), by Application 2024 & 2032
- Figure 40: Europe Vitamin B Market Volume (Tons), by Application 2024 & 2032
- Figure 41: Europe Vitamin B Market Revenue Share (%), by Application 2024 & 2032
- Figure 42: Europe Vitamin B Market Volume Share (%), by Application 2024 & 2032
- Figure 43: Europe Vitamin B Market Revenue (Million), by Country 2024 & 2032
- Figure 44: Europe Vitamin B Market Volume (Tons), by Country 2024 & 2032
- Figure 45: Europe Vitamin B Market Revenue Share (%), by Country 2024 & 2032
- Figure 46: Europe Vitamin B Market Volume Share (%), by Country 2024 & 2032
- Figure 47: Asia Pacific Vitamin B Market Revenue (Million), by Form 2024 & 2032
- Figure 48: Asia Pacific Vitamin B Market Volume (Tons), by Form 2024 & 2032
- Figure 49: Asia Pacific Vitamin B Market Revenue Share (%), by Form 2024 & 2032
- Figure 50: Asia Pacific Vitamin B Market Volume Share (%), by Form 2024 & 2032
- Figure 51: Asia Pacific Vitamin B Market Revenue (Million), by Application 2024 & 2032
- Figure 52: Asia Pacific Vitamin B Market Volume (Tons), by Application 2024 & 2032
- Figure 53: Asia Pacific Vitamin B Market Revenue Share (%), by Application 2024 & 2032
- Figure 54: Asia Pacific Vitamin B Market Volume Share (%), by Application 2024 & 2032
- Figure 55: Asia Pacific Vitamin B Market Revenue (Million), by Country 2024 & 2032
- Figure 56: Asia Pacific Vitamin B Market Volume (Tons), by Country 2024 & 2032
- Figure 57: Asia Pacific Vitamin B Market Revenue Share (%), by Country 2024 & 2032
- Figure 58: Asia Pacific Vitamin B Market Volume Share (%), by Country 2024 & 2032
- Figure 59: South America Vitamin B Market Revenue (Million), by Form 2024 & 2032
- Figure 60: South America Vitamin B Market Volume (Tons), by Form 2024 & 2032
- Figure 61: South America Vitamin B Market Revenue Share (%), by Form 2024 & 2032
- Figure 62: South America Vitamin B Market Volume Share (%), by Form 2024 & 2032
- Figure 63: South America Vitamin B Market Revenue (Million), by Application 2024 & 2032
- Figure 64: South America Vitamin B Market Volume (Tons), by Application 2024 & 2032
- Figure 65: South America Vitamin B Market Revenue Share (%), by Application 2024 & 2032
- Figure 66: South America Vitamin B Market Volume Share (%), by Application 2024 & 2032
- Figure 67: South America Vitamin B Market Revenue (Million), by Country 2024 & 2032
- Figure 68: South America Vitamin B Market Volume (Tons), by Country 2024 & 2032
- Figure 69: South America Vitamin B Market Revenue Share (%), by Country 2024 & 2032
- Figure 70: South America Vitamin B Market Volume Share (%), by Country 2024 & 2032
- Figure 71: Middle East and Africa Vitamin B Market Revenue (Million), by Form 2024 & 2032
- Figure 72: Middle East and Africa Vitamin B Market Volume (Tons), by Form 2024 & 2032
- Figure 73: Middle East and Africa Vitamin B Market Revenue Share (%), by Form 2024 & 2032
- Figure 74: Middle East and Africa Vitamin B Market Volume Share (%), by Form 2024 & 2032
- Figure 75: Middle East and Africa Vitamin B Market Revenue (Million), by Application 2024 & 2032
- Figure 76: Middle East and Africa Vitamin B Market Volume (Tons), by Application 2024 & 2032
- Figure 77: Middle East and Africa Vitamin B Market Revenue Share (%), by Application 2024 & 2032
- Figure 78: Middle East and Africa Vitamin B Market Volume Share (%), by Application 2024 & 2032
- Figure 79: Middle East and Africa Vitamin B Market Revenue (Million), by Country 2024 & 2032
- Figure 80: Middle East and Africa Vitamin B Market Volume (Tons), by Country 2024 & 2032
- Figure 81: Middle East and Africa Vitamin B Market Revenue Share (%), by Country 2024 & 2032
- Figure 82: Middle East and Africa Vitamin B Market Volume Share (%), by Country 2024 & 2032
List of Tables
- Table 1: Global Vitamin B Market Revenue Million Forecast, by Region 2019 & 2032
- Table 2: Global Vitamin B Market Volume Tons Forecast, by Region 2019 & 2032
- Table 3: Global Vitamin B Market Revenue Million Forecast, by Form 2019 & 2032
- Table 4: Global Vitamin B Market Volume Tons Forecast, by Form 2019 & 2032
- Table 5: Global Vitamin B Market Revenue Million Forecast, by Application 2019 & 2032
- Table 6: Global Vitamin B Market Volume Tons Forecast, by Application 2019 & 2032
- Table 7: Global Vitamin B Market Revenue Million Forecast, by Region 2019 & 2032
- Table 8: Global Vitamin B Market Volume Tons Forecast, by Region 2019 & 2032
- Table 9: Global Vitamin B Market Revenue Million Forecast, by Country 2019 & 2032
- Table 10: Global Vitamin B Market Volume Tons Forecast, by Country 2019 & 2032
- Table 11: United States Vitamin B Market Revenue (Million) Forecast, by Application 2019 & 2032
- Table 12: United States Vitamin B Market Volume (Tons) Forecast, by Application 2019 & 2032
- Table 13: Canada Vitamin B Market Revenue (Million) Forecast, by Application 2019 & 2032
- Table 14: Canada Vitamin B Market Volume (Tons) Forecast, by Application 2019 & 2032
- Table 15: Mexico Vitamin B Market Revenue (Million) Forecast, by Application 2019 & 2032
- Table 16: Mexico Vitamin B Market Volume (Tons) Forecast, by Application 2019 & 2032
- Table 17: Rest of North America Vitamin B Market Revenue (Million) Forecast, by Application 2019 & 2032
- Table 18: Rest of North America Vitamin B Market Volume (Tons) Forecast, by Application 2019 & 2032
- Table 19: Global Vitamin B Market Revenue Million Forecast, by Country 2019 & 2032
- Table 20: Global Vitamin B Market Volume Tons Forecast, by Country 2019 & 2032
- Table 21: Spain Vitamin B Market Revenue (Million) Forecast, by Application 2019 & 2032
- Table 22: Spain Vitamin B Market Volume (Tons) Forecast, by Application 2019 & 2032
- Table 23: United Kingdom Vitamin B Market Revenue (Million) Forecast, by Application 2019 & 2032
- Table 24: United Kingdom Vitamin B Market Volume (Tons) Forecast, by Application 2019 & 2032
- Table 25: Germany Vitamin B Market Revenue (Million) Forecast, by Application 2019 & 2032
- Table 26: Germany Vitamin B Market Volume (Tons) Forecast, by Application 2019 & 2032
- Table 27: France Vitamin B Market Revenue (Million) Forecast, by Application 2019 & 2032
- Table 28: France Vitamin B Market Volume (Tons) Forecast, by Application 2019 & 2032
- Table 29: Italy Vitamin B Market Revenue (Million) Forecast, by Application 2019 & 2032
- Table 30: Italy Vitamin B Market Volume (Tons) Forecast, by Application 2019 & 2032
- Table 31: Russia Vitamin B Market Revenue (Million) Forecast, by Application 2019 & 2032
- Table 32: Russia Vitamin B Market Volume (Tons) Forecast, by Application 2019 & 2032
- Table 33: Rest of Europe Vitamin B Market Revenue (Million) Forecast, by Application 2019 & 2032
- Table 34: Rest of Europe Vitamin B Market Volume (Tons) Forecast, by Application 2019 & 2032
- Table 35: Global Vitamin B Market Revenue Million Forecast, by Country 2019 & 2032
- Table 36: Global Vitamin B Market Volume Tons Forecast, by Country 2019 & 2032
- Table 37: China Vitamin B Market Revenue (Million) Forecast, by Application 2019 & 2032
- Table 38: China Vitamin B Market Volume (Tons) Forecast, by Application 2019 & 2032
- Table 39: Japan Vitamin B Market Revenue (Million) Forecast, by Application 2019 & 2032
- Table 40: Japan Vitamin B Market Volume (Tons) Forecast, by Application 2019 & 2032
- Table 41: India Vitamin B Market Revenue (Million) Forecast, by Application 2019 & 2032
- Table 42: India Vitamin B Market Volume (Tons) Forecast, by Application 2019 & 2032
- Table 43: Australia Vitamin B Market Revenue (Million) Forecast, by Application 2019 & 2032
- Table 44: Australia Vitamin B Market Volume (Tons) Forecast, by Application 2019 & 2032
- Table 45: Rest of Asia Pacific Vitamin B Market Revenue (Million) Forecast, by Application 2019 & 2032
- Table 46: Rest of Asia Pacific Vitamin B Market Volume (Tons) Forecast, by Application 2019 & 2032
- Table 47: Global Vitamin B Market Revenue Million Forecast, by Country 2019 & 2032
- Table 48: Global Vitamin B Market Volume Tons Forecast, by Country 2019 & 2032
- Table 49: Brazil Vitamin B Market Revenue (Million) Forecast, by Application 2019 & 2032
- Table 50: Brazil Vitamin B Market Volume (Tons) Forecast, by Application 2019 & 2032
- Table 51: Argentina Vitamin B Market Revenue (Million) Forecast, by Application 2019 & 2032
- Table 52: Argentina Vitamin B Market Volume (Tons) Forecast, by Application 2019 & 2032
- Table 53: Rest of South America Vitamin B Market Revenue (Million) Forecast, by Application 2019 & 2032
- Table 54: Rest of South America Vitamin B Market Volume (Tons) Forecast, by Application 2019 & 2032
- Table 55: Global Vitamin B Market Revenue Million Forecast, by Country 2019 & 2032
- Table 56: Global Vitamin B Market Volume Tons Forecast, by Country 2019 & 2032
- Table 57: South Africa Vitamin B Market Revenue (Million) Forecast, by Application 2019 & 2032
- Table 58: South Africa Vitamin B Market Volume (Tons) Forecast, by Application 2019 & 2032
- Table 59: Saudi Arabia Vitamin B Market Revenue (Million) Forecast, by Application 2019 & 2032
- Table 60: Saudi Arabia Vitamin B Market Volume (Tons) Forecast, by Application 2019 & 2032
- Table 61: Rest of Middle East and Africa Vitamin B Market Revenue (Million) Forecast, by Application 2019 & 2032
- Table 62: Rest of Middle East and Africa Vitamin B Market Volume (Tons) Forecast, by Application 2019 & 2032
- Table 63: Global Vitamin B Market Revenue Million Forecast, by Form 2019 & 2032
- Table 64: Global Vitamin B Market Volume Tons Forecast, by Form 2019 & 2032
- Table 65: Global Vitamin B Market Revenue Million Forecast, by Application 2019 & 2032
- Table 66: Global Vitamin B Market Volume Tons Forecast, by Application 2019 & 2032
- Table 67: Global Vitamin B Market Revenue Million Forecast, by Country 2019 & 2032
- Table 68: Global Vitamin B Market Volume Tons Forecast, by Country 2019 & 2032
- Table 69: United States Vitamin B Market Revenue (Million) Forecast, by Application 2019 & 2032
- Table 70: United States Vitamin B Market Volume (Tons) Forecast, by Application 2019 & 2032
- Table 71: Canada Vitamin B Market Revenue (Million) Forecast, by Application 2019 & 2032
- Table 72: Canada Vitamin B Market Volume (Tons) Forecast, by Application 2019 & 2032
- Table 73: Mexico Vitamin B Market Revenue (Million) Forecast, by Application 2019 & 2032
- Table 74: Mexico Vitamin B Market Volume (Tons) Forecast, by Application 2019 & 2032
- Table 75: Rest of North America Vitamin B Market Revenue (Million) Forecast, by Application 2019 & 2032
- Table 76: Rest of North America Vitamin B Market Volume (Tons) Forecast, by Application 2019 & 2032
- Table 77: Global Vitamin B Market Revenue Million Forecast, by Form 2019 & 2032
- Table 78: Global Vitamin B Market Volume Tons Forecast, by Form 2019 & 2032
- Table 79: Global Vitamin B Market Revenue Million Forecast, by Application 2019 & 2032
- Table 80: Global Vitamin B Market Volume Tons Forecast, by Application 2019 & 2032
- Table 81: Global Vitamin B Market Revenue Million Forecast, by Country 2019 & 2032
- Table 82: Global Vitamin B Market Volume Tons Forecast, by Country 2019 & 2032
- Table 83: Spain Vitamin B Market Revenue (Million) Forecast, by Application 2019 & 2032
- Table 84: Spain Vitamin B Market Volume (Tons) Forecast, by Application 2019 & 2032
- Table 85: United Kingdom Vitamin B Market Revenue (Million) Forecast, by Application 2019 & 2032
- Table 86: United Kingdom Vitamin B Market Volume (Tons) Forecast, by Application 2019 & 2032
- Table 87: Germany Vitamin B Market Revenue (Million) Forecast, by Application 2019 & 2032
- Table 88: Germany Vitamin B Market Volume (Tons) Forecast, by Application 2019 & 2032
- Table 89: France Vitamin B Market Revenue (Million) Forecast, by Application 2019 & 2032
- Table 90: France Vitamin B Market Volume (Tons) Forecast, by Application 2019 & 2032
- Table 91: Italy Vitamin B Market Revenue (Million) Forecast, by Application 2019 & 2032
- Table 92: Italy Vitamin B Market Volume (Tons) Forecast, by Application 2019 & 2032
- Table 93: Russia Vitamin B Market Revenue (Million) Forecast, by Application 2019 & 2032
- Table 94: Russia Vitamin B Market Volume (Tons) Forecast, by Application 2019 & 2032
- Table 95: Rest of Europe Vitamin B Market Revenue (Million) Forecast, by Application 2019 & 2032
- Table 96: Rest of Europe Vitamin B Market Volume (Tons) Forecast, by Application 2019 & 2032
- Table 97: Global Vitamin B Market Revenue Million Forecast, by Form 2019 & 2032
- Table 98: Global Vitamin B Market Volume Tons Forecast, by Form 2019 & 2032
- Table 99: Global Vitamin B Market Revenue Million Forecast, by Application 2019 & 2032
- Table 100: Global Vitamin B Market Volume Tons Forecast, by Application 2019 & 2032
- Table 101: Global Vitamin B Market Revenue Million Forecast, by Country 2019 & 2032
- Table 102: Global Vitamin B Market Volume Tons Forecast, by Country 2019 & 2032
- Table 103: China Vitamin B Market Revenue (Million) Forecast, by Application 2019 & 2032
- Table 104: China Vitamin B Market Volume (Tons) Forecast, by Application 2019 & 2032
- Table 105: Japan Vitamin B Market Revenue (Million) Forecast, by Application 2019 & 2032
- Table 106: Japan Vitamin B Market Volume (Tons) Forecast, by Application 2019 & 2032
- Table 107: India Vitamin B Market Revenue (Million) Forecast, by Application 2019 & 2032
- Table 108: India Vitamin B Market Volume (Tons) Forecast, by Application 2019 & 2032
- Table 109: Australia Vitamin B Market Revenue (Million) Forecast, by Application 2019 & 2032
- Table 110: Australia Vitamin B Market Volume (Tons) Forecast, by Application 2019 & 2032
- Table 111: Rest of Asia Pacific Vitamin B Market Revenue (Million) Forecast, by Application 2019 & 2032
- Table 112: Rest of Asia Pacific Vitamin B Market Volume (Tons) Forecast, by Application 2019 & 2032
- Table 113: Global Vitamin B Market Revenue Million Forecast, by Form 2019 & 2032
- Table 114: Global Vitamin B Market Volume Tons Forecast, by Form 2019 & 2032
- Table 115: Global Vitamin B Market Revenue Million Forecast, by Application 2019 & 2032
- Table 116: Global Vitamin B Market Volume Tons Forecast, by Application 2019 & 2032
- Table 117: Global Vitamin B Market Revenue Million Forecast, by Country 2019 & 2032
- Table 118: Global Vitamin B Market Volume Tons Forecast, by Country 2019 & 2032
- Table 119: Brazil Vitamin B Market Revenue (Million) Forecast, by Application 2019 & 2032
- Table 120: Brazil Vitamin B Market Volume (Tons) Forecast, by Application 2019 & 2032
- Table 121: Argentina Vitamin B Market Revenue (Million) Forecast, by Application 2019 & 2032
- Table 122: Argentina Vitamin B Market Volume (Tons) Forecast, by Application 2019 & 2032
- Table 123: Rest of South America Vitamin B Market Revenue (Million) Forecast, by Application 2019 & 2032
- Table 124: Rest of South America Vitamin B Market Volume (Tons) Forecast, by Application 2019 & 2032
- Table 125: Global Vitamin B Market Revenue Million Forecast, by Form 2019 & 2032
- Table 126: Global Vitamin B Market Volume Tons Forecast, by Form 2019 & 2032
- Table 127: Global Vitamin B Market Revenue Million Forecast, by Application 2019 & 2032
- Table 128: Global Vitamin B Market Volume Tons Forecast, by Application 2019 & 2032
- Table 129: Global Vitamin B Market Revenue Million Forecast, by Country 2019 & 2032
- Table 130: Global Vitamin B Market Volume Tons Forecast, by Country 2019 & 2032
- Table 131: South Africa Vitamin B Market Revenue (Million) Forecast, by Application 2019 & 2032
- Table 132: South Africa Vitamin B Market Volume (Tons) Forecast, by Application 2019 & 2032
- Table 133: Saudi Arabia Vitamin B Market Revenue (Million) Forecast, by Application 2019 & 2032
- Table 134: Saudi Arabia Vitamin B Market Volume (Tons) Forecast, by Application 2019 & 2032
- Table 135: Rest of Middle East and Africa Vitamin B Market Revenue (Million) Forecast, by Application 2019 & 2032
- Table 136: Rest of Middle East and Africa Vitamin B Market Volume (Tons) Forecast, by Application 2019 & 2032
Frequently Asked Questions
1. What is the projected Compound Annual Growth Rate (CAGR) of the Vitamin B Market?
The projected CAGR is approximately 6.65%.
2. Which companies are prominent players in the Vitamin B Market?
Key companies in the market include Hebei Shengxue dacheng Pharmaceutical Co Ltd*List Not Exhaustive, Xinfa Pharmaceutical Co Ltd, Legend Industries, Hubei Guangji Pharmaceutical Co Ltd, N B Group Co Ltd, BASF SE, Shanghai Acebright Pharmaceuticals Group Co Ltd, Parchem Fine & Specialty Chemicals, Shanghai Hegno Pharmaceutical Holding Co Ltd, Koninklijke DSM NV.
3. What are the main segments of the Vitamin B Market?
The market segments include Form, Application.
4. Can you provide details about the market size?
The market size is estimated to be USD 451.57 Million as of 2022.
5. What are some drivers contributing to market growth?
Increasing Demand for Functional and Fortified Food; Multi-functionality and Wide Application of Riboflavin.
6. What are the notable trends driving market growth?
Increasing Demand for Functional and Fortified Food.
7. Are there any restraints impacting market growth?
Low Stability of Riboflavin on Exposure to Light and Heat.
8. Can you provide examples of recent developments in the market?
May 2023: DSM-Firmenich AG, the global innovation partner in nutrition, health, and beauty, completed its merger with Firmenich International SA.
9. What pricing options are available for accessing the report?
Pricing options include single-user, multi-user, and enterprise licenses priced at USD 4750, USD 5250, and USD 8750 respectively.
10. Is the market size provided in terms of value or volume?
The market size is provided in terms of value, measured in Million and volume, measured in Tons.
11. Are there any specific market keywords associated with the report?
Yes, the market keyword associated with the report is "Vitamin B Market," which aids in identifying and referencing the specific market segment covered.
12. How do I determine which pricing option suits my needs best?
The pricing options vary based on user requirements and access needs. Individual users may opt for single-user licenses, while businesses requiring broader access may choose multi-user or enterprise licenses for cost-effective access to the report.
13. Are there any additional resources or data provided in the Vitamin B Market report?
While the report offers comprehensive insights, it's advisable to review the specific contents or supplementary materials provided to ascertain if additional resources or data are available.
14. How can I stay updated on further developments or reports in the Vitamin B Market?
To stay informed about further developments, trends, and reports in the Vitamin B Market, consider subscribing to industry newsletters, following relevant companies and organizations, or regularly checking reputable industry news sources and publications.
Methodology
Step 1 - Identification of Relevant Samples Size from Population Database


Step 2 - Approaches for Defining Global Market Size (Value, Volume* & Price*)

Note*: In applicable scenarios
Step 3 - Data Sources
Primary Research
- Web Analytics
- Survey Reports
- Research Institute
- Latest Research Reports
- Opinion Leaders
Secondary Research
- Annual Reports
- White Paper
- Latest Press Release
- Industry Association
- Paid Database
- Investor Presentations

Step 4 - Data Triangulation
Involves using different sources of information in order to increase the validity of a study
These sources are likely to be stakeholders in a program - participants, other researchers, program staff, other community members, and so on.
Then we put all data in single framework & apply various statistical tools to find out the dynamic on the market.
During the analysis stage, feedback from the stakeholder groups would be compared to determine areas of agreement as well as areas of divergence


