
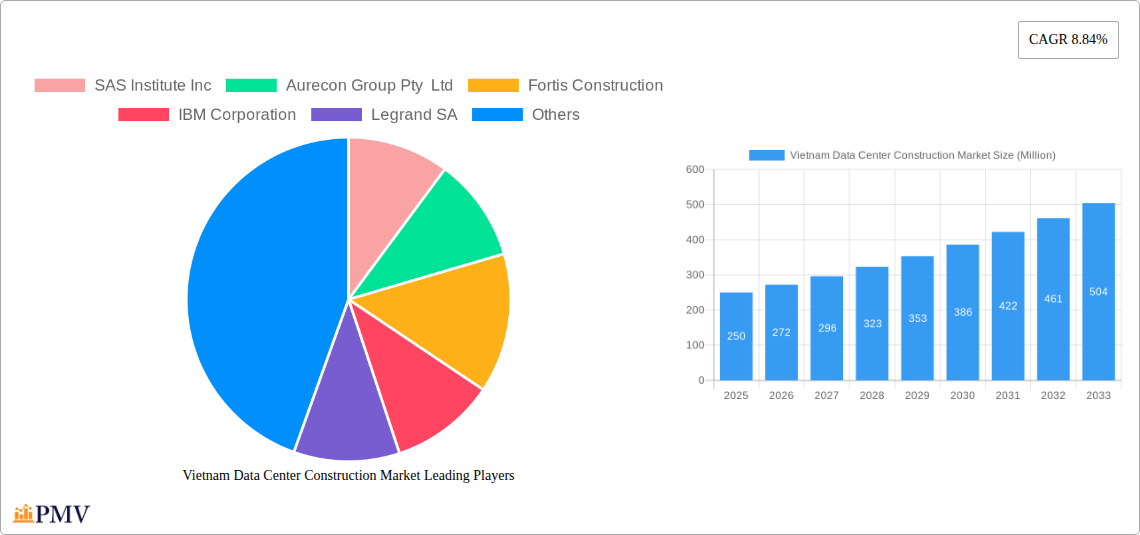
Key Insights
The Vietnam data center construction market is experiencing robust growth, driven by increasing digitalization, e-commerce expansion, and government initiatives promoting digital infrastructure development. The market's compound annual growth rate (CAGR) of 8.84% from 2019 to 2024 indicates a significant upward trajectory. This growth is fueled by a burgeoning demand for cloud services, the rise of big data analytics, and the increasing adoption of 5G technology across various sectors, including IT & Telecommunications, BFSI (Banking, Financial Services, and Insurance), Government, and Healthcare. The market segmentation reveals a diverse landscape, with Tier 1 and Tier 3 data centers experiencing particularly strong growth due to their ability to support higher capacity and resilience requirements. Similarly, the demand for large and mega data centers is accelerating due to the need for scalability and enhanced processing power. Cooling, power, and physical security infrastructure segments are crucial components, representing a substantial portion of the overall market value. Key players such as SAS Institute Inc., IBM Corporation, and Schneider Electric SE are actively shaping the market, investing in advanced technologies and expanding their presence to capitalize on Vietnam's growing data center needs.
Looking ahead to 2033, the market is poised for continued expansion, driven by sustained investments in digital infrastructure and the increasing reliance on data-driven decision making. While challenges such as land availability and regulatory hurdles might exist, the overall positive growth outlook remains strong. The ongoing development of special economic zones and government incentives to attract foreign investment in the technology sector further contribute to a positive outlook for the data center construction market. The strategic location of Vietnam within Southeast Asia also positions it advantageously as a regional data hub. Continued growth is anticipated across all segments, although the proportion of the market captured by each segment may shift as technological advancements and user needs evolve. The increasing adoption of sustainable practices and energy-efficient technologies will become a key driver in shaping future market dynamics.
Vietnam Data Center Construction Market: A Comprehensive Report (2019-2033)
This comprehensive report provides a detailed analysis of the Vietnam data center construction market, offering invaluable insights for investors, industry professionals, and strategic decision-makers. Covering the period 2019-2033, with a base year of 2025 and a forecast period of 2025-2033, this report meticulously examines market size, growth drivers, challenges, and key players. The market is segmented by Tier Type (Tier 1, Tier 2, Tier 3), Data Center Size (Small, Medium, Large, Mega, Massive), Infrastructure (Cooling, Power, Physical Security, Design & Consulting Services), and End-User (IT & Telecommunication, BFSI, Government, Healthcare). The report also provides valuable data on historical market performance (2019-2024) and future projections, including CAGR and market penetration. Expected market value in 2025 is estimated at xx Million.
Vietnam Data Center Construction Market Structure & Competitive Dynamics
The Vietnam data center construction market exhibits a moderately concentrated structure, with several multinational corporations and local players vying for market share. The market is characterized by a dynamic innovation ecosystem, driven by advancements in cooling technologies, power infrastructure, and physical security systems. The regulatory framework, while evolving, presents both opportunities and challenges. Product substitution is limited, primarily focused on efficiency improvements within existing technologies. End-user trends indicate a growing demand from the IT & Telecommunication and BFSI sectors, fueled by digital transformation initiatives and increasing data storage needs. Mergers and acquisitions (M&A) activity has been moderate, with deal values in the xx Million range, primarily involving strategic partnerships and expansions. Market share is currently dominated by a few key players, with the top five holding an estimated xx% combined share. The remaining share is distributed among several smaller players and new entrants. Further analysis explores the impact of government policies on market dynamics, the role of foreign direct investment, and the potential for future consolidation.
Vietnam Data Center Construction Market Industry Trends & Insights
The Vietnam data center construction market is experiencing robust growth, driven by increasing digitalization, government initiatives promoting technological advancements, and burgeoning e-commerce. The Compound Annual Growth Rate (CAGR) is projected to be xx% during the forecast period (2025-2033). Technological disruptions, particularly in areas like AI, cloud computing, and the Internet of Things (IoT), are driving demand for advanced data center infrastructure. Consumer preferences are shifting towards highly reliable, energy-efficient, and secure data center facilities. Competitive dynamics are shaping the market, with companies investing heavily in research and development to offer innovative solutions. Market penetration of advanced cooling and power solutions is steadily increasing, driven by the adoption of sustainable practices. The market is also influenced by the rising adoption of hyperscale data centers and the increasing use of edge computing. Increased government investment in digital infrastructure is bolstering market growth.
Dominant Markets & Segments in Vietnam Data Center Construction Market
Leading Region/Segment: The key driver of market growth is Ho Chi Minh City, supported by a strong IT infrastructure and concentration of major corporations. The IT & Telecommunication sector is the dominant end-user segment. Tier 3 data centers represent the largest segment by Tier type, catering to the needs of various enterprises. Large to Mega data centers account for a significant portion of the market, driven by requirements from large organizations and hyperscalers. Cooling infrastructure constitutes a major component of overall spending, reflecting the critical role of thermal management in data center operations.
Key Drivers: The government’s focus on digital transformation initiatives and investments in infrastructure development are primary growth catalysts. Increasing foreign direct investment (FDI) into Vietnam’s technology sector is fueling the demand for advanced data center facilities. The growing adoption of cloud services and the rise of e-commerce further contribute to market expansion.
Vietnam Data Center Construction Market Product Innovations
Significant product innovations are focused on improving energy efficiency, enhancing security features, and optimizing data center operations. New cooling technologies, such as liquid cooling and AI-driven thermal management systems, are gaining traction. Advanced power infrastructure solutions, including modular UPS systems and intelligent power distribution units (PDUs), are improving reliability and efficiency. Enhanced physical security features, such as biometric access control and advanced surveillance systems, are strengthening data center security. These innovations are driving increased market adoption and providing significant competitive advantages.
Report Segmentation & Scope
This report segments the Vietnam data center construction market comprehensively across several dimensions:
Tier Type: Tier 1, Tier 2, and Tier 3 data centers, each with distinct infrastructure requirements and market characteristics. Growth projections for each tier are included.
Data Center Size: Small, Medium, Large, Mega, and Massive data centers, reflecting the varying capacity and operational needs of different end-users.
Infrastructure: Cooling Infrastructure, Power Infrastructure, Physical Security Infrastructure, and Design & Consulting Services, capturing the various components of data center construction.
End-User: IT & Telecommunication, BFSI, Government, and Healthcare, outlining the diverse applications of data centers across various industry sectors.
Key Drivers of Vietnam Data Center Construction Market Growth
The Vietnam data center market's growth is primarily driven by the government's push for digitalization, attracting significant foreign investment in the IT sector. Rapid growth in e-commerce and cloud adoption further fuels demand. Improved infrastructure, particularly electricity access in key regions, and favorable government regulations are also vital factors. The development of 5G networks is anticipated to significantly contribute to future growth.
Challenges in the Vietnam Data Center Construction Market Sector
Challenges include land availability and costs in prime locations. Supply chain disruptions can impact construction timelines and costs. Competition from established players and new entrants creates pressure on pricing and profitability. Furthermore, the need for skilled labor and technical expertise presents a potential bottleneck. Addressing these issues requires strategic planning and collaboration across the value chain.
Leading Players in the Vietnam Data Center Construction Market Market
- SAS Institute Inc
- Aurecon Group Pty Ltd
- Fortis Construction
- IBM Corporation
- Legrand SA
- Archetype Group
- Delta Group
- NEC Vietnam Co Ltd
- Schneider Electric SE
- Turner Construction Co
- Dell Inc
- Cisco Systems Inc
- AECOM
- NTT Ltd
- Iris Global
Key Developments in Vietnam Data Center Construction Market Sector
September 2021: Viettel conducted 5G trials with Samsung in Da Nang, achieving speeds over 4.7 Gbps, demonstrating the potential for high-speed data transmission.
September 2021: VNPT upgraded its networks and developed 4G, 5G, and IoT platforms, signifying advancements in network infrastructure, driving demand for data center capacity. Their agreement with Nokia further highlights the commitment to technological advancement.
Strategic Vietnam Data Center Construction Market Outlook
The Vietnam data center construction market presents significant growth opportunities. Continued investment in digital infrastructure, expanding 5G networks, and increasing cloud adoption will drive robust market expansion. Strategic partnerships and collaborations between local and international players will play a crucial role in shaping future market dynamics. Opportunities exist for companies specializing in sustainable and energy-efficient data center solutions. The market is poised for substantial growth, driven by both domestic and international demand.
Vietnam Data Center Construction Market Segmentation
-
1. Infrastructure
-
1.1. Market Segmentation - By Electrical Infrastructure
-
1.1.1. Power Distribution Solution
- 1.1.1.1. PDU - Ba
-
1.1.1.2. Transfer Switches
- 1.1.1.2.1. Static
- 1.1.1.2.2. Automatic (ATS)
-
1.1.1.3. Switchgear
- 1.1.1.3.1. Low-voltage
- 1.1.1.3.2. Medium-voltage
- 1.1.1.4. Power Panels and Components
- 1.1.1.5. Other Power Panels and Components
-
1.1.2. Power Backup Solutions
- 1.1.2.1. UPS
- 1.1.2.2. Generators
- 1.1.3. Service
-
1.1.1. Power Distribution Solution
-
1.2. Market Segmentation - By Mechanical Infrastructure
-
1.2.1. Cooling Systems
- 1.2.1.1. Immersion Cooling
- 1.2.1.2. Direct-to-chip Cooling
- 1.2.1.3. Rear Door Heat Exchanger
- 1.2.1.4. In-row and In-rack Cooling
- 1.2.2. Racks
- 1.2.3. Other Mechanical Infrastructure
-
1.2.1. Cooling Systems
- 1.3. General Construction
-
1.1. Market Segmentation - By Electrical Infrastructure
-
2. Electrical Infrastructure
-
2.1. Power Distribution Solution
- 2.1.1. PDU - Ba
-
2.1.2. Transfer Switches
- 2.1.2.1. Static
- 2.1.2.2. Automatic (ATS)
-
2.1.3. Switchgear
- 2.1.3.1. Low-voltage
- 2.1.3.2. Medium-voltage
- 2.1.4. Power Panels and Components
- 2.1.5. Other Power Panels and Components
-
2.2. Power Backup Solutions
- 2.2.1. UPS
- 2.2.2. Generators
- 2.3. Service
-
2.1. Power Distribution Solution
-
3. Power Distribution Solution
- 3.1. PDU - Ba
-
3.2. Transfer Switches
- 3.2.1. Static
- 3.2.2. Automatic (ATS)
-
3.3. Switchgear
- 3.3.1. Low-voltage
- 3.3.2. Medium-voltage
- 3.4. Power Panels and Components
- 3.5. Other Power Panels and Components
-
4. Power Backup Solutions
- 4.1. UPS
- 4.2. Generators
- 5. Service
-
6. Mechanical Infrastructure
-
6.1. Cooling Systems
- 6.1.1. Immersion Cooling
- 6.1.2. Direct-to-chip Cooling
- 6.1.3. Rear Door Heat Exchanger
- 6.1.4. In-row and In-rack Cooling
- 6.2. Racks
- 6.3. Other Mechanical Infrastructure
-
6.1. Cooling Systems
-
7. Cooling Systems
- 7.1. Immersion Cooling
- 7.2. Direct-to-chip Cooling
- 7.3. Rear Door Heat Exchanger
- 7.4. In-row and In-rack Cooling
- 8. Racks
- 9. Other Mechanical Infrastructure
- 10. General Construction
-
11. Tier Type
- 11.1. Tier 1 and 2
- 11.2. Tier 3
- 11.3. Tier 4
- 12. Tier 1 and 2
- 13. Tier 3
- 14. Tier 4
-
15. End User
- 15.1. Banking, Financial Services, and Insurance
- 15.2. IT and Telecommunications
- 15.3. Government and Defense
- 15.4. Healthcare
- 15.5. Other End Users
- 16. Banking, Financial Services, and Insurance
- 17. IT and Telecommunications
- 18. Government and Defense
- 19. Healthcare
- 20. Other End Users
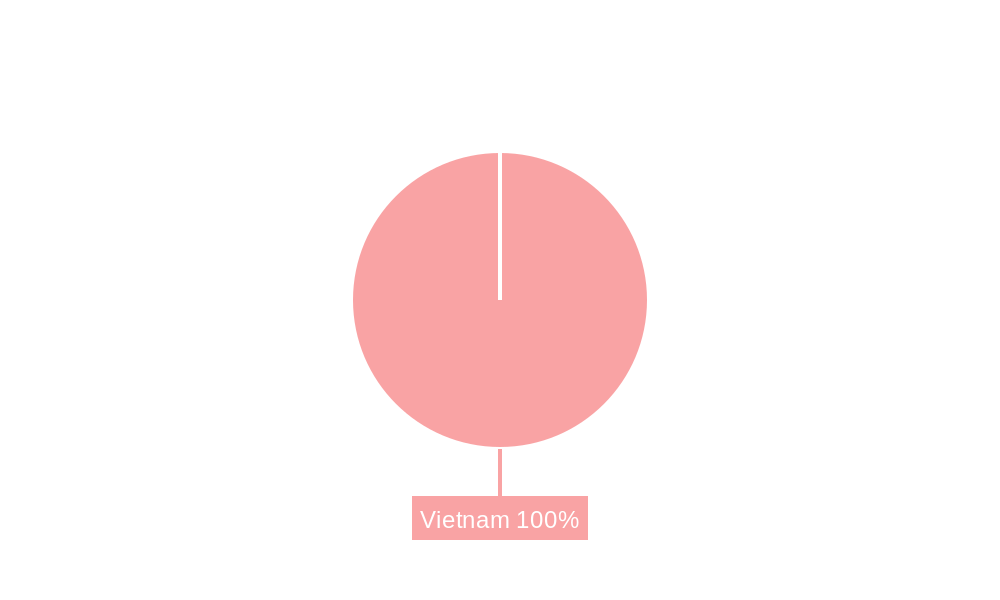
Vietnam Data Center Construction Market Segmentation By Geography
- 1. Vietnam
Vietnam Data Center Construction Market REPORT HIGHLIGHTS
| Aspects | Details |
|---|---|
| Study Period | 2019-2033 |
| Base Year | 2024 |
| Estimated Year | 2025 |
| Forecast Period | 2025-2033 |
| Historical Period | 2019-2024 |
| Growth Rate | CAGR of 8.84% from 2019-2033 |
| Segmentation |
|
Table of Contents
- 1. Introduction
- 1.1. Research Scope
- 1.2. Market Segmentation
- 1.3. Research Methodology
- 1.4. Definitions and Assumptions
- 2. Executive Summary
- 2.1. Introduction
- 3. Market Dynamics
- 3.1. Introduction
- 3.2. Market Drivers
- 3.2.1. Increased Migration to Cloud-based Business Operations; Rise of Green Data Centers; Government Support in the Form of Tax Incentives for Development of Data Centers
- 3.3. Market Restrains
- 3.3.1. Higher Initial Investments and Low Availability of Resources
- 3.4. Market Trends
- 3.4.1. Tier 3 is the Largest Tier Type
- 4. Market Factor Analysis
- 4.1. Porters Five Forces
- 4.2. Supply/Value Chain
- 4.3. PESTEL analysis
- 4.4. Market Entropy
- 4.5. Patent/Trademark Analysis
- 5. Vietnam Data Center Construction Market Analysis, Insights and Forecast, 2019-2031
- 5.1. Market Analysis, Insights and Forecast - by Infrastructure
- 5.1.1. Market Segmentation - By Electrical Infrastructure
- 5.1.1.1. Power Distribution Solution
- 5.1.1.1.1. PDU - Ba
- 5.1.1.1.2. Transfer Switches
- 5.1.1.1.2.1. Static
- 5.1.1.1.2.2. Automatic (ATS)
- 5.1.1.1.3. Switchgear
- 5.1.1.1.3.1. Low-voltage
- 5.1.1.1.3.2. Medium-voltage
- 5.1.1.1.4. Power Panels and Components
- 5.1.1.1.5. Other Power Panels and Components
- 5.1.1.2. Power Backup Solutions
- 5.1.1.2.1. UPS
- 5.1.1.2.2. Generators
- 5.1.1.3. Service
- 5.1.1.1. Power Distribution Solution
- 5.1.2. Market Segmentation - By Mechanical Infrastructure
- 5.1.2.1. Cooling Systems
- 5.1.2.1.1. Immersion Cooling
- 5.1.2.1.2. Direct-to-chip Cooling
- 5.1.2.1.3. Rear Door Heat Exchanger
- 5.1.2.1.4. In-row and In-rack Cooling
- 5.1.2.2. Racks
- 5.1.2.3. Other Mechanical Infrastructure
- 5.1.2.1. Cooling Systems
- 5.1.3. General Construction
- 5.1.1. Market Segmentation - By Electrical Infrastructure
- 5.2. Market Analysis, Insights and Forecast - by Electrical Infrastructure
- 5.2.1. Power Distribution Solution
- 5.2.1.1. PDU - Ba
- 5.2.1.2. Transfer Switches
- 5.2.1.2.1. Static
- 5.2.1.2.2. Automatic (ATS)
- 5.2.1.3. Switchgear
- 5.2.1.3.1. Low-voltage
- 5.2.1.3.2. Medium-voltage
- 5.2.1.4. Power Panels and Components
- 5.2.1.5. Other Power Panels and Components
- 5.2.2. Power Backup Solutions
- 5.2.2.1. UPS
- 5.2.2.2. Generators
- 5.2.3. Service
- 5.2.1. Power Distribution Solution
- 5.3. Market Analysis, Insights and Forecast - by Power Distribution Solution
- 5.3.1. PDU - Ba
- 5.3.2. Transfer Switches
- 5.3.2.1. Static
- 5.3.2.2. Automatic (ATS)
- 5.3.3. Switchgear
- 5.3.3.1. Low-voltage
- 5.3.3.2. Medium-voltage
- 5.3.4. Power Panels and Components
- 5.3.5. Other Power Panels and Components
- 5.4. Market Analysis, Insights and Forecast - by Power Backup Solutions
- 5.4.1. UPS
- 5.4.2. Generators
- 5.5. Market Analysis, Insights and Forecast - by Service
- 5.6. Market Analysis, Insights and Forecast - by Mechanical Infrastructure
- 5.6.1. Cooling Systems
- 5.6.1.1. Immersion Cooling
- 5.6.1.2. Direct-to-chip Cooling
- 5.6.1.3. Rear Door Heat Exchanger
- 5.6.1.4. In-row and In-rack Cooling
- 5.6.2. Racks
- 5.6.3. Other Mechanical Infrastructure
- 5.6.1. Cooling Systems
- 5.7. Market Analysis, Insights and Forecast - by Cooling Systems
- 5.7.1. Immersion Cooling
- 5.7.2. Direct-to-chip Cooling
- 5.7.3. Rear Door Heat Exchanger
- 5.7.4. In-row and In-rack Cooling
- 5.8. Market Analysis, Insights and Forecast - by Racks
- 5.9. Market Analysis, Insights and Forecast - by Other Mechanical Infrastructure
- 5.10. Market Analysis, Insights and Forecast - by General Construction
- 5.11. Market Analysis, Insights and Forecast - by Tier Type
- 5.11.1. Tier 1 and 2
- 5.11.2. Tier 3
- 5.11.3. Tier 4
- 5.12. Market Analysis, Insights and Forecast - by Tier 1 and 2
- 5.13. Market Analysis, Insights and Forecast - by Tier 3
- 5.14. Market Analysis, Insights and Forecast - by Tier 4
- 5.15. Market Analysis, Insights and Forecast - by End User
- 5.15.1. Banking, Financial Services, and Insurance
- 5.15.2. IT and Telecommunications
- 5.15.3. Government and Defense
- 5.15.4. Healthcare
- 5.15.5. Other End Users
- 5.16. Market Analysis, Insights and Forecast - by Banking, Financial Services, and Insurance
- 5.17. Market Analysis, Insights and Forecast - by IT and Telecommunications
- 5.18. Market Analysis, Insights and Forecast - by Government and Defense
- 5.19. Market Analysis, Insights and Forecast - by Healthcare
- 5.20. Market Analysis, Insights and Forecast - by Other End Users
- 5.21. Market Analysis, Insights and Forecast - by Region
- 5.21.1. Vietnam
- 5.1. Market Analysis, Insights and Forecast - by Infrastructure
- 6. Competitive Analysis
- 6.1. Market Share Analysis 2024
- 6.2. Company Profiles
- 6.2.1 SAS Institute Inc
- 6.2.1.1. Overview
- 6.2.1.2. Products
- 6.2.1.3. SWOT Analysis
- 6.2.1.4. Recent Developments
- 6.2.1.5. Financials (Based on Availability)
- 6.2.2 Aurecon Group Pty Ltd
- 6.2.2.1. Overview
- 6.2.2.2. Products
- 6.2.2.3. SWOT Analysis
- 6.2.2.4. Recent Developments
- 6.2.2.5. Financials (Based on Availability)
- 6.2.3 Fortis Construction
- 6.2.3.1. Overview
- 6.2.3.2. Products
- 6.2.3.3. SWOT Analysis
- 6.2.3.4. Recent Developments
- 6.2.3.5. Financials (Based on Availability)
- 6.2.4 IBM Corporation
- 6.2.4.1. Overview
- 6.2.4.2. Products
- 6.2.4.3. SWOT Analysis
- 6.2.4.4. Recent Developments
- 6.2.4.5. Financials (Based on Availability)
- 6.2.5 Legrand SA
- 6.2.5.1. Overview
- 6.2.5.2. Products
- 6.2.5.3. SWOT Analysis
- 6.2.5.4. Recent Developments
- 6.2.5.5. Financials (Based on Availability)
- 6.2.6 Archetype Group
- 6.2.6.1. Overview
- 6.2.6.2. Products
- 6.2.6.3. SWOT Analysis
- 6.2.6.4. Recent Developments
- 6.2.6.5. Financials (Based on Availability)
- 6.2.7 Delta Group
- 6.2.7.1. Overview
- 6.2.7.2. Products
- 6.2.7.3. SWOT Analysis
- 6.2.7.4. Recent Developments
- 6.2.7.5. Financials (Based on Availability)
- 6.2.8 NEC Vietnam Co Ltd
- 6.2.8.1. Overview
- 6.2.8.2. Products
- 6.2.8.3. SWOT Analysis
- 6.2.8.4. Recent Developments
- 6.2.8.5. Financials (Based on Availability)
- 6.2.9 Schneider Electric SE
- 6.2.9.1. Overview
- 6.2.9.2. Products
- 6.2.9.3. SWOT Analysis
- 6.2.9.4. Recent Developments
- 6.2.9.5. Financials (Based on Availability)
- 6.2.10 Turner Construction Co
- 6.2.10.1. Overview
- 6.2.10.2. Products
- 6.2.10.3. SWOT Analysis
- 6.2.10.4. Recent Developments
- 6.2.10.5. Financials (Based on Availability)
- 6.2.11 Dell Inc
- 6.2.11.1. Overview
- 6.2.11.2. Products
- 6.2.11.3. SWOT Analysis
- 6.2.11.4. Recent Developments
- 6.2.11.5. Financials (Based on Availability)
- 6.2.12 Cisco Systems Inc
- 6.2.12.1. Overview
- 6.2.12.2. Products
- 6.2.12.3. SWOT Analysis
- 6.2.12.4. Recent Developments
- 6.2.12.5. Financials (Based on Availability)
- 6.2.13 AECOM
- 6.2.13.1. Overview
- 6.2.13.2. Products
- 6.2.13.3. SWOT Analysis
- 6.2.13.4. Recent Developments
- 6.2.13.5. Financials (Based on Availability)
- 6.2.14 NTT Ltd
- 6.2.14.1. Overview
- 6.2.14.2. Products
- 6.2.14.3. SWOT Analysis
- 6.2.14.4. Recent Developments
- 6.2.14.5. Financials (Based on Availability)
- 6.2.15 Iris Global
- 6.2.15.1. Overview
- 6.2.15.2. Products
- 6.2.15.3. SWOT Analysis
- 6.2.15.4. Recent Developments
- 6.2.15.5. Financials (Based on Availability)
- 6.2.1 SAS Institute Inc
List of Figures
- Figure 1: Vietnam Data Center Construction Market Revenue Breakdown (Million, %) by Product 2024 & 2032
- Figure 2: Vietnam Data Center Construction Market Share (%) by Company 2024
List of Tables
- Table 1: Vietnam Data Center Construction Market Revenue Million Forecast, by Region 2019 & 2032
- Table 2: Vietnam Data Center Construction Market Volume K Unit Forecast, by Region 2019 & 2032
- Table 3: Vietnam Data Center Construction Market Revenue Million Forecast, by Infrastructure 2019 & 2032
- Table 4: Vietnam Data Center Construction Market Volume K Unit Forecast, by Infrastructure 2019 & 2032
- Table 5: Vietnam Data Center Construction Market Revenue Million Forecast, by Electrical Infrastructure 2019 & 2032
- Table 6: Vietnam Data Center Construction Market Volume K Unit Forecast, by Electrical Infrastructure 2019 & 2032
- Table 7: Vietnam Data Center Construction Market Revenue Million Forecast, by Power Distribution Solution 2019 & 2032
- Table 8: Vietnam Data Center Construction Market Volume K Unit Forecast, by Power Distribution Solution 2019 & 2032
- Table 9: Vietnam Data Center Construction Market Revenue Million Forecast, by Power Backup Solutions 2019 & 2032
- Table 10: Vietnam Data Center Construction Market Volume K Unit Forecast, by Power Backup Solutions 2019 & 2032
- Table 11: Vietnam Data Center Construction Market Revenue Million Forecast, by Service 2019 & 2032
- Table 12: Vietnam Data Center Construction Market Volume K Unit Forecast, by Service 2019 & 2032
- Table 13: Vietnam Data Center Construction Market Revenue Million Forecast, by Mechanical Infrastructure 2019 & 2032
- Table 14: Vietnam Data Center Construction Market Volume K Unit Forecast, by Mechanical Infrastructure 2019 & 2032
- Table 15: Vietnam Data Center Construction Market Revenue Million Forecast, by Cooling Systems 2019 & 2032
- Table 16: Vietnam Data Center Construction Market Volume K Unit Forecast, by Cooling Systems 2019 & 2032
- Table 17: Vietnam Data Center Construction Market Revenue Million Forecast, by Racks 2019 & 2032
- Table 18: Vietnam Data Center Construction Market Volume K Unit Forecast, by Racks 2019 & 2032
- Table 19: Vietnam Data Center Construction Market Revenue Million Forecast, by Other Mechanical Infrastructure 2019 & 2032
- Table 20: Vietnam Data Center Construction Market Volume K Unit Forecast, by Other Mechanical Infrastructure 2019 & 2032
- Table 21: Vietnam Data Center Construction Market Revenue Million Forecast, by General Construction 2019 & 2032
- Table 22: Vietnam Data Center Construction Market Volume K Unit Forecast, by General Construction 2019 & 2032
- Table 23: Vietnam Data Center Construction Market Revenue Million Forecast, by Tier Type 2019 & 2032
- Table 24: Vietnam Data Center Construction Market Volume K Unit Forecast, by Tier Type 2019 & 2032
- Table 25: Vietnam Data Center Construction Market Revenue Million Forecast, by Tier 1 and 2 2019 & 2032
- Table 26: Vietnam Data Center Construction Market Volume K Unit Forecast, by Tier 1 and 2 2019 & 2032
- Table 27: Vietnam Data Center Construction Market Revenue Million Forecast, by Tier 3 2019 & 2032
- Table 28: Vietnam Data Center Construction Market Volume K Unit Forecast, by Tier 3 2019 & 2032
- Table 29: Vietnam Data Center Construction Market Revenue Million Forecast, by Tier 4 2019 & 2032
- Table 30: Vietnam Data Center Construction Market Volume K Unit Forecast, by Tier 4 2019 & 2032
- Table 31: Vietnam Data Center Construction Market Revenue Million Forecast, by End User 2019 & 2032
- Table 32: Vietnam Data Center Construction Market Volume K Unit Forecast, by End User 2019 & 2032
- Table 33: Vietnam Data Center Construction Market Revenue Million Forecast, by Banking, Financial Services, and Insurance 2019 & 2032
- Table 34: Vietnam Data Center Construction Market Volume K Unit Forecast, by Banking, Financial Services, and Insurance 2019 & 2032
- Table 35: Vietnam Data Center Construction Market Revenue Million Forecast, by IT and Telecommunications 2019 & 2032
- Table 36: Vietnam Data Center Construction Market Volume K Unit Forecast, by IT and Telecommunications 2019 & 2032
- Table 37: Vietnam Data Center Construction Market Revenue Million Forecast, by Government and Defense 2019 & 2032
- Table 38: Vietnam Data Center Construction Market Volume K Unit Forecast, by Government and Defense 2019 & 2032
- Table 39: Vietnam Data Center Construction Market Revenue Million Forecast, by Healthcare 2019 & 2032
- Table 40: Vietnam Data Center Construction Market Volume K Unit Forecast, by Healthcare 2019 & 2032
- Table 41: Vietnam Data Center Construction Market Revenue Million Forecast, by Other End Users 2019 & 2032
- Table 42: Vietnam Data Center Construction Market Volume K Unit Forecast, by Other End Users 2019 & 2032
- Table 43: Vietnam Data Center Construction Market Revenue Million Forecast, by Region 2019 & 2032
- Table 44: Vietnam Data Center Construction Market Volume K Unit Forecast, by Region 2019 & 2032
- Table 45: Vietnam Data Center Construction Market Revenue Million Forecast, by Country 2019 & 2032
- Table 46: Vietnam Data Center Construction Market Volume K Unit Forecast, by Country 2019 & 2032
- Table 47: Vietnam Data Center Construction Market Revenue Million Forecast, by Infrastructure 2019 & 2032
- Table 48: Vietnam Data Center Construction Market Volume K Unit Forecast, by Infrastructure 2019 & 2032
- Table 49: Vietnam Data Center Construction Market Revenue Million Forecast, by Electrical Infrastructure 2019 & 2032
- Table 50: Vietnam Data Center Construction Market Volume K Unit Forecast, by Electrical Infrastructure 2019 & 2032
- Table 51: Vietnam Data Center Construction Market Revenue Million Forecast, by Power Distribution Solution 2019 & 2032
- Table 52: Vietnam Data Center Construction Market Volume K Unit Forecast, by Power Distribution Solution 2019 & 2032
- Table 53: Vietnam Data Center Construction Market Revenue Million Forecast, by Power Backup Solutions 2019 & 2032
- Table 54: Vietnam Data Center Construction Market Volume K Unit Forecast, by Power Backup Solutions 2019 & 2032
- Table 55: Vietnam Data Center Construction Market Revenue Million Forecast, by Service 2019 & 2032
- Table 56: Vietnam Data Center Construction Market Volume K Unit Forecast, by Service 2019 & 2032
- Table 57: Vietnam Data Center Construction Market Revenue Million Forecast, by Mechanical Infrastructure 2019 & 2032
- Table 58: Vietnam Data Center Construction Market Volume K Unit Forecast, by Mechanical Infrastructure 2019 & 2032
- Table 59: Vietnam Data Center Construction Market Revenue Million Forecast, by Cooling Systems 2019 & 2032
- Table 60: Vietnam Data Center Construction Market Volume K Unit Forecast, by Cooling Systems 2019 & 2032
- Table 61: Vietnam Data Center Construction Market Revenue Million Forecast, by Racks 2019 & 2032
- Table 62: Vietnam Data Center Construction Market Volume K Unit Forecast, by Racks 2019 & 2032
- Table 63: Vietnam Data Center Construction Market Revenue Million Forecast, by Other Mechanical Infrastructure 2019 & 2032
- Table 64: Vietnam Data Center Construction Market Volume K Unit Forecast, by Other Mechanical Infrastructure 2019 & 2032
- Table 65: Vietnam Data Center Construction Market Revenue Million Forecast, by General Construction 2019 & 2032
- Table 66: Vietnam Data Center Construction Market Volume K Unit Forecast, by General Construction 2019 & 2032
- Table 67: Vietnam Data Center Construction Market Revenue Million Forecast, by Tier Type 2019 & 2032
- Table 68: Vietnam Data Center Construction Market Volume K Unit Forecast, by Tier Type 2019 & 2032
- Table 69: Vietnam Data Center Construction Market Revenue Million Forecast, by Tier 1 and 2 2019 & 2032
- Table 70: Vietnam Data Center Construction Market Volume K Unit Forecast, by Tier 1 and 2 2019 & 2032
- Table 71: Vietnam Data Center Construction Market Revenue Million Forecast, by Tier 3 2019 & 2032
- Table 72: Vietnam Data Center Construction Market Volume K Unit Forecast, by Tier 3 2019 & 2032
- Table 73: Vietnam Data Center Construction Market Revenue Million Forecast, by Tier 4 2019 & 2032
- Table 74: Vietnam Data Center Construction Market Volume K Unit Forecast, by Tier 4 2019 & 2032
- Table 75: Vietnam Data Center Construction Market Revenue Million Forecast, by End User 2019 & 2032
- Table 76: Vietnam Data Center Construction Market Volume K Unit Forecast, by End User 2019 & 2032
- Table 77: Vietnam Data Center Construction Market Revenue Million Forecast, by Banking, Financial Services, and Insurance 2019 & 2032
- Table 78: Vietnam Data Center Construction Market Volume K Unit Forecast, by Banking, Financial Services, and Insurance 2019 & 2032
- Table 79: Vietnam Data Center Construction Market Revenue Million Forecast, by IT and Telecommunications 2019 & 2032
- Table 80: Vietnam Data Center Construction Market Volume K Unit Forecast, by IT and Telecommunications 2019 & 2032
- Table 81: Vietnam Data Center Construction Market Revenue Million Forecast, by Government and Defense 2019 & 2032
- Table 82: Vietnam Data Center Construction Market Volume K Unit Forecast, by Government and Defense 2019 & 2032
- Table 83: Vietnam Data Center Construction Market Revenue Million Forecast, by Healthcare 2019 & 2032
- Table 84: Vietnam Data Center Construction Market Volume K Unit Forecast, by Healthcare 2019 & 2032
- Table 85: Vietnam Data Center Construction Market Revenue Million Forecast, by Other End Users 2019 & 2032
- Table 86: Vietnam Data Center Construction Market Volume K Unit Forecast, by Other End Users 2019 & 2032
- Table 87: Vietnam Data Center Construction Market Revenue Million Forecast, by Country 2019 & 2032
- Table 88: Vietnam Data Center Construction Market Volume K Unit Forecast, by Country 2019 & 2032
Frequently Asked Questions
1. What is the projected Compound Annual Growth Rate (CAGR) of the Vietnam Data Center Construction Market?
The projected CAGR is approximately 8.84%.
2. Which companies are prominent players in the Vietnam Data Center Construction Market?
Key companies in the market include SAS Institute Inc, Aurecon Group Pty Ltd, Fortis Construction, IBM Corporation, Legrand SA, Archetype Group, Delta Group, NEC Vietnam Co Ltd, Schneider Electric SE, Turner Construction Co, Dell Inc, Cisco Systems Inc, AECOM, NTT Ltd, Iris Global.
3. What are the main segments of the Vietnam Data Center Construction Market?
The market segments include Infrastructure, Electrical Infrastructure, Power Distribution Solution, Power Backup Solutions, Service , Mechanical Infrastructure, Cooling Systems, Racks, Other Mechanical Infrastructure, General Construction, Tier Type, Tier 1 and 2, Tier 3, Tier 4, End User, Banking, Financial Services, and Insurance, IT and Telecommunications, Government and Defense, Healthcare, Other End Users.
4. Can you provide details about the market size?
The market size is estimated to be USD XX Million as of 2022.
5. What are some drivers contributing to market growth?
Increased Migration to Cloud-based Business Operations; Rise of Green Data Centers; Government Support in the Form of Tax Incentives for Development of Data Centers.
6. What are the notable trends driving market growth?
Tier 3 is the Largest Tier Type.
7. Are there any restraints impacting market growth?
Higher Initial Investments and Low Availability of Resources.
8. Can you provide examples of recent developments in the market?
September 2021: Viettel jointly conducted trials with Samsung in Da Nang, in early September 2021. Viettel partnered with Ericsson and Qualcomm to test and achieve 5G data transmission speeds over 4.7 Gbps.
9. What pricing options are available for accessing the report?
Pricing options include single-user, multi-user, and enterprise licenses priced at USD 3800, USD 4500, and USD 5800 respectively.
10. Is the market size provided in terms of value or volume?
The market size is provided in terms of value, measured in Million and volume, measured in K Unit.
11. Are there any specific market keywords associated with the report?
Yes, the market keyword associated with the report is "Vietnam Data Center Construction Market," which aids in identifying and referencing the specific market segment covered.
12. How do I determine which pricing option suits my needs best?
The pricing options vary based on user requirements and access needs. Individual users may opt for single-user licenses, while businesses requiring broader access may choose multi-user or enterprise licenses for cost-effective access to the report.
13. Are there any additional resources or data provided in the Vietnam Data Center Construction Market report?
While the report offers comprehensive insights, it's advisable to review the specific contents or supplementary materials provided to ascertain if additional resources or data are available.
14. How can I stay updated on further developments or reports in the Vietnam Data Center Construction Market?
To stay informed about further developments, trends, and reports in the Vietnam Data Center Construction Market, consider subscribing to industry newsletters, following relevant companies and organizations, or regularly checking reputable industry news sources and publications.
Methodology
Step 1 - Identification of Relevant Samples Size from Population Database


Step 2 - Approaches for Defining Global Market Size (Value, Volume* & Price*)

Note*: In applicable scenarios
Step 3 - Data Sources
Primary Research
- Web Analytics
- Survey Reports
- Research Institute
- Latest Research Reports
- Opinion Leaders
Secondary Research
- Annual Reports
- White Paper
- Latest Press Release
- Industry Association
- Paid Database
- Investor Presentations

Step 4 - Data Triangulation
Involves using different sources of information in order to increase the validity of a study
These sources are likely to be stakeholders in a program - participants, other researchers, program staff, other community members, and so on.
Then we put all data in single framework & apply various statistical tools to find out the dynamic on the market.
During the analysis stage, feedback from the stakeholder groups would be compared to determine areas of agreement as well as areas of divergence


