
Key Insights
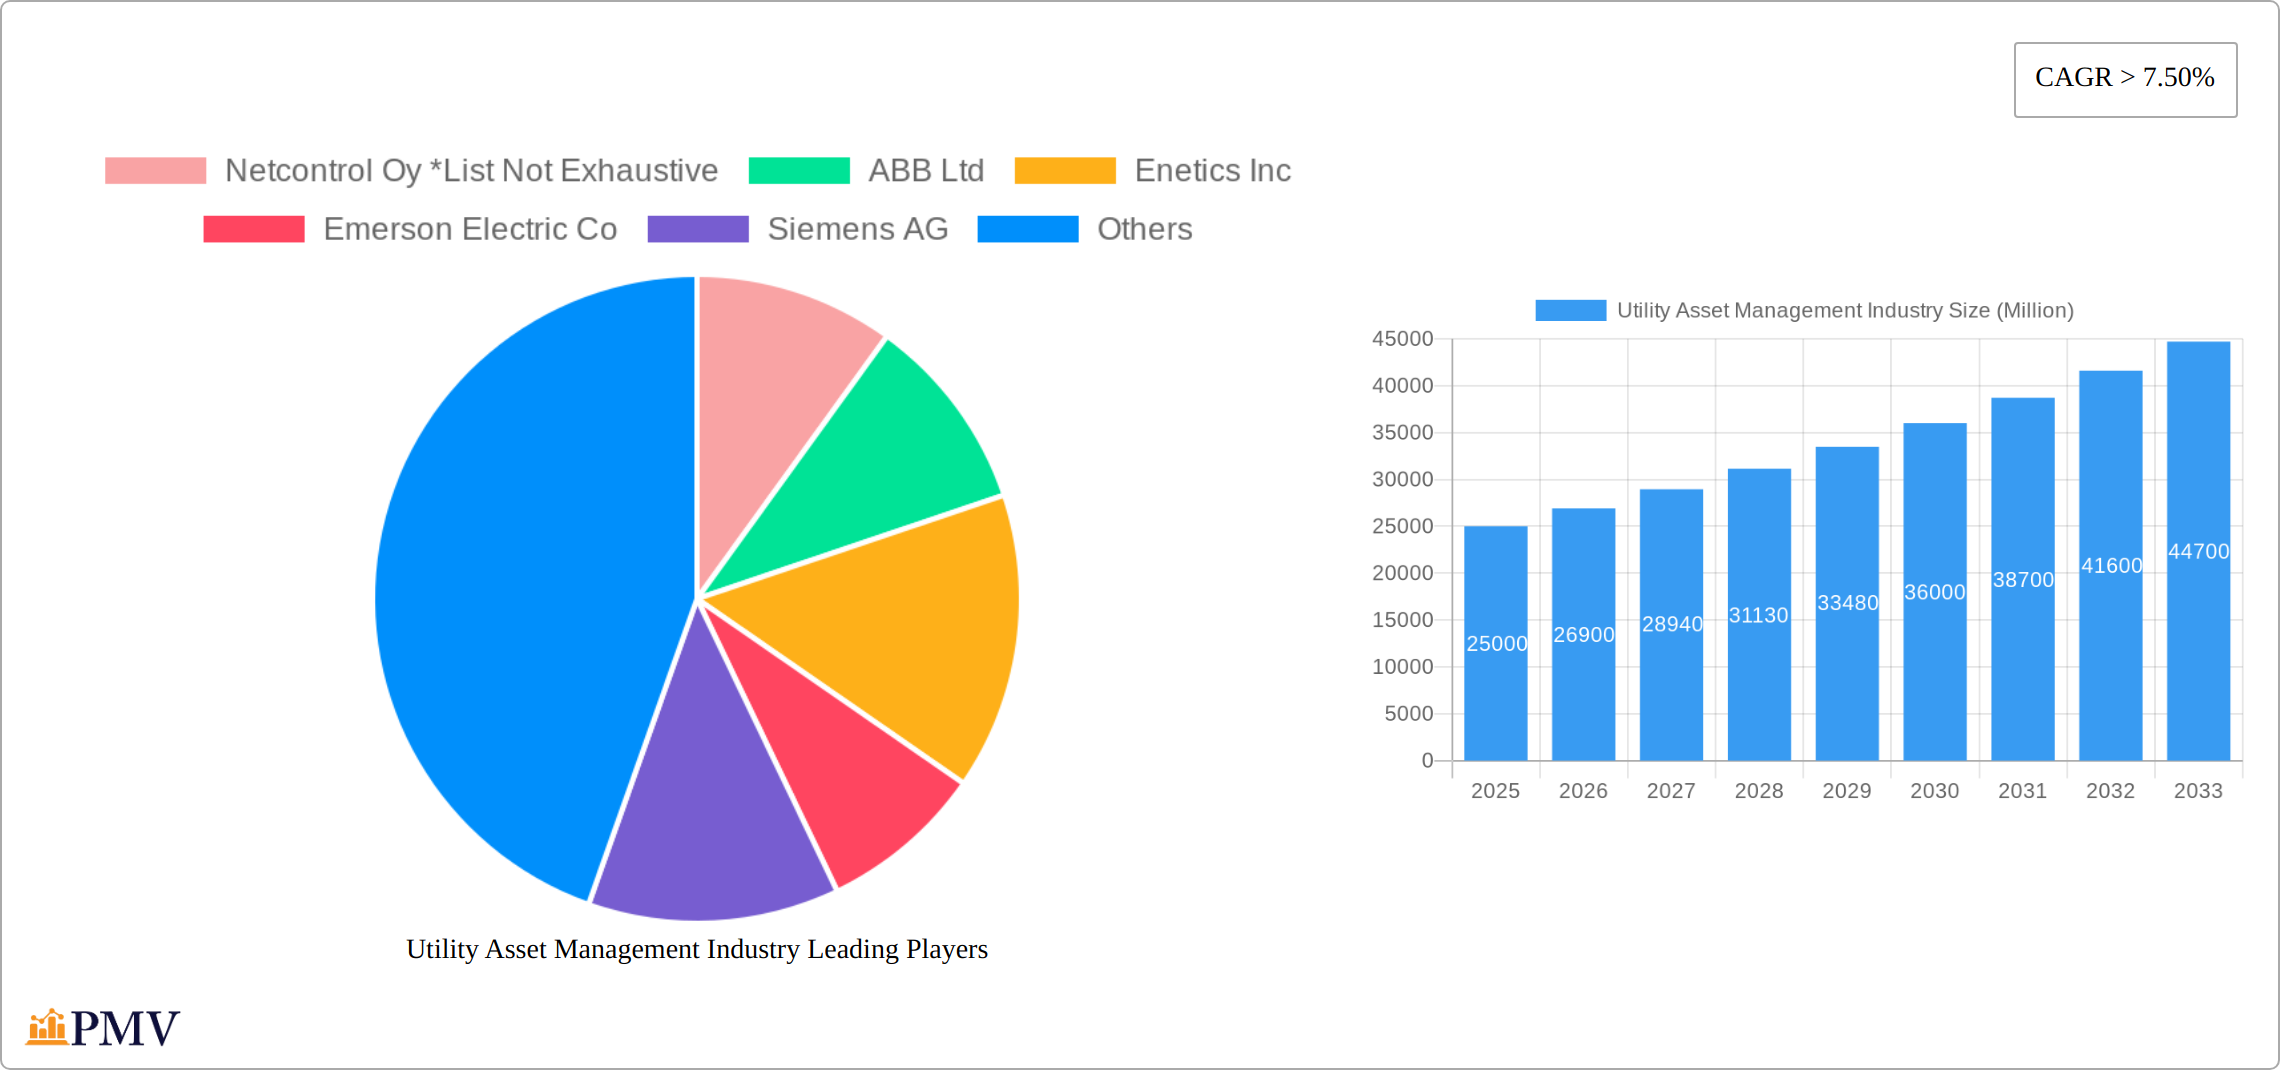
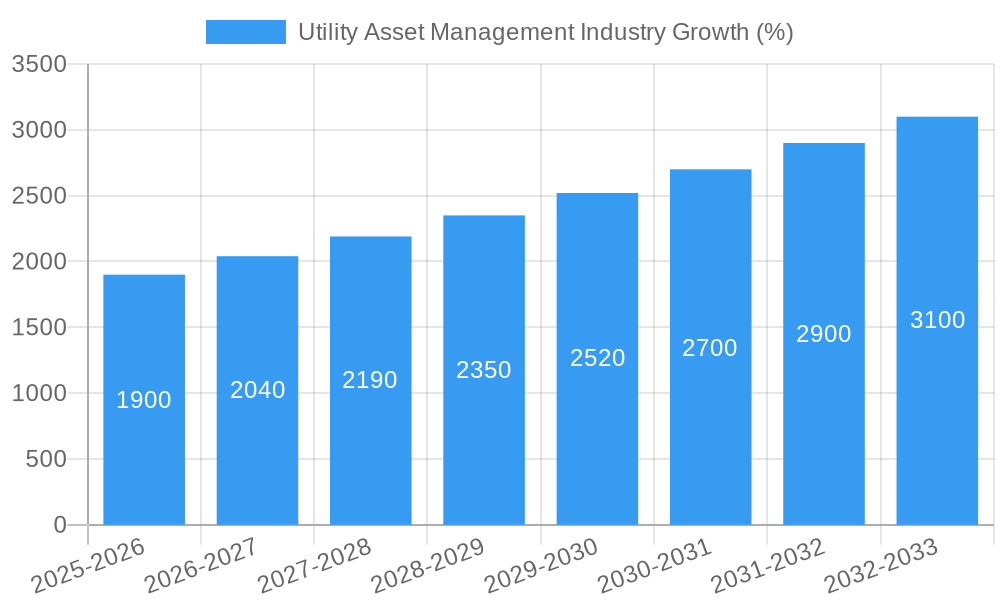
The Utility Asset Management (UAM) market is experiencing robust growth, driven by increasing pressure on utilities to enhance operational efficiency, improve grid reliability, and reduce maintenance costs. A compound annual growth rate (CAGR) exceeding 7.5% indicates a significant expansion projected from 2019 to 2033. This growth is fueled by several key factors. The aging infrastructure in many regions necessitates modernization and proactive maintenance strategies, driving demand for sophisticated UAM solutions. Furthermore, the integration of smart grid technologies and the proliferation of data analytics are enabling utilities to gain unprecedented insights into asset performance, optimizing maintenance schedules, and minimizing outages. The increasing adoption of IoT sensors, coupled with advanced analytics, allows for predictive maintenance, preventing costly failures and extending the lifespan of critical assets. Growth is also spurred by stringent regulatory compliance requirements that mandate improved asset management practices across the industry.
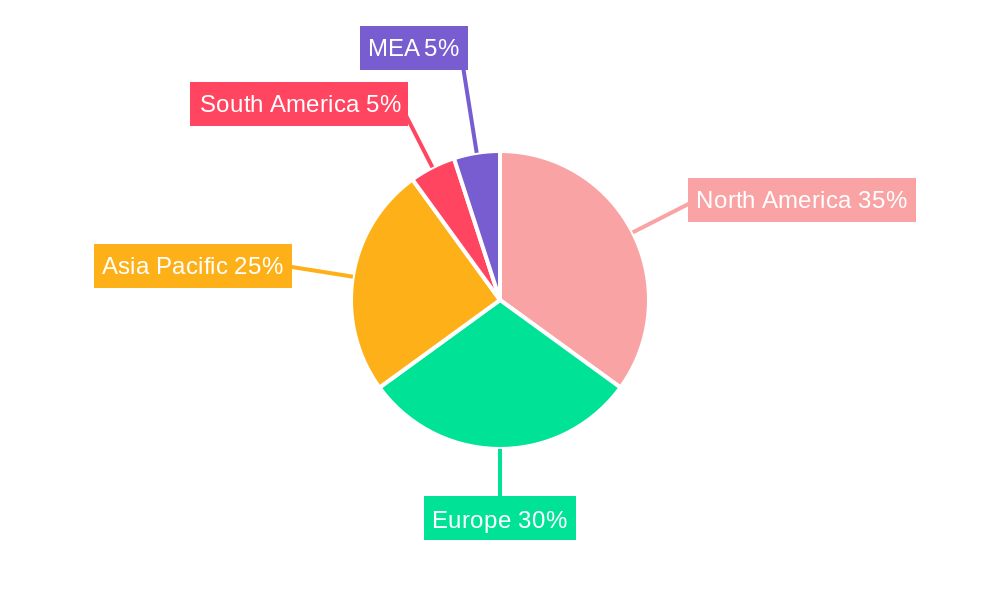
Segmentation within the UAM market reveals diverse opportunities. Public utilities are significant adopters of UAM systems, owing to their large-scale operations and the critical nature of their assets. Private utilities are also contributing significantly to market growth, driven by the need to optimize their own infrastructure efficiency and reliability. Application-wise, transformers, substations, and transmission & distribution networks represent key segments, each requiring specialized UAM solutions. Geographically, North America and Europe currently hold substantial market shares, but the Asia-Pacific region is projected to experience significant growth due to rapid infrastructure development and increasing electricity demand. The presence of established players like ABB, Siemens, and General Electric, alongside emerging innovative companies, contributes to a dynamic and competitive landscape. This competition fosters innovation and drives the development of increasingly sophisticated and cost-effective UAM solutions.
Utility Asset Management Industry: Market Analysis & Forecast Report (2019-2033)
This comprehensive report provides a detailed analysis of the Utility Asset Management (UAM) industry, offering invaluable insights for stakeholders seeking to navigate this dynamic market. With a study period spanning 2019-2033, a base year of 2025, and a forecast period of 2025-2033, this report leverages historical data (2019-2024) to project future trends and opportunities within the UAM sector. The market size is estimated to be xx Million in 2025, with a projected Compound Annual Growth Rate (CAGR) of xx% during the forecast period.
Utility Asset Management Industry Market Structure & Competitive Dynamics
The Utility Asset Management market is characterized by a moderately concentrated structure, with several major players holding significant market share. The top five companies—ABB Ltd, Siemens AG, General Electric Company, Emerson Electric Co, and S&C Electric Company—collectively account for an estimated xx% of the global market in 2025. However, a substantial number of smaller, specialized companies also contribute significantly to innovation and market competition. Market share is influenced by factors such as technological capabilities, geographic reach, and strategic partnerships.
The industry's innovation ecosystem is vibrant, driven by advancements in areas such as Artificial Intelligence (AI), Machine Learning (ML), the Internet of Things (IoT), and big data analytics. Regulatory frameworks vary across regions, impacting investment decisions and market entry strategies. Substitutes for traditional UAM solutions are emerging, particularly in the software and data analytics segments, increasing competitive pressure. End-user trends are shifting towards more integrated, data-driven solutions that optimize asset performance and enhance grid reliability. Mergers and acquisitions (M&A) activity remains significant, with deal values exceeding xx Million in the last five years, reflecting the industry's consolidation and drive for scale. Examples include [Insert specific M&A examples with deal values if available, otherwise use "xx Million" as a placeholder].
Utility Asset Management Industry Industry Trends & Insights
The UAM market is experiencing robust growth, propelled by several key factors. The increasing age and deterioration of existing utility infrastructure necessitate proactive asset management strategies. The integration of smart grid technologies, such as Advanced Metering Infrastructure (AMI) and Distributed Energy Resources (DER) management systems, is driving demand for sophisticated UAM solutions. Furthermore, regulatory pressure to improve grid reliability and efficiency, coupled with rising energy consumption, is creating a favorable environment for UAM market expansion.
Technological disruptions are reshaping the industry landscape. The adoption of AI and ML algorithms is enabling predictive maintenance and optimized asset utilization, leading to significant cost savings and improved operational efficiency. Consumer preferences are shifting toward solutions that offer enhanced transparency, data-driven insights, and seamless integration with existing systems. Competitive dynamics are characterized by intense innovation, strategic partnerships, and increasing focus on providing comprehensive, end-to-end solutions. The market penetration of advanced UAM solutions is expected to increase significantly over the forecast period, reaching approximately xx% by 2033.
Dominant Markets & Segments in Utility Asset Management Industry
The North American region currently holds the largest market share in the UAM industry, driven by substantial investments in grid modernization and the adoption of advanced technologies. Within this region, the United States dominates due to its extensive infrastructure network and robust regulatory framework promoting grid modernization initiatives. However, Europe and Asia Pacific are expected to witness significant growth in the coming years.
Utility Type: The Public Utility segment holds a larger market share than the Private Utility segment due to the higher capital expenditure and regulatory requirements associated with public grid management.
Application: Transmission & Distribution Network applications account for the largest segment of the market, owing to the critical nature of these assets and the significant cost associated with failures. Substations and Transformers are also key segments demonstrating consistent growth.
Key Drivers:
- Stringent regulatory compliance requirements for grid reliability and safety.
- Rising energy demand and the need to optimize energy distribution efficiency.
- Government initiatives and incentives promoting grid modernization and smart grid technologies.
- Growing adoption of data analytics and AI to enhance asset management practices.
Utility Asset Management Industry Product Innovations
Recent product innovations in the UAM sector focus on the integration of AI and ML capabilities into existing solutions, enhancing predictive maintenance, real-time monitoring, and asset optimization. New software platforms are offering better data visualization, advanced analytics, and streamlined workflows. These advancements improve operational efficiency, reduce downtime, and enhance grid reliability. The market is also witnessing the emergence of cloud-based solutions, offering improved scalability, accessibility, and cost-effectiveness. These innovations cater to the growing demand for data-driven decision-making and enhanced operational efficiency within the utility sector.
Report Segmentation & Scope
This report segments the UAM market based on Utility Type (Public Utility, Private Utility) and Application (Transformer, Substation, Transmission & Distribution Network).
Utility Type: The Public Utility segment is projected to maintain a larger market share due to the larger scale of operations and higher investments in grid infrastructure. The Private Utility segment, while smaller, is expected to exhibit substantial growth driven by increasing demand for reliable energy solutions.
Application: The Transmission & Distribution Network segment dominates the market owing to the critical role it plays in ensuring consistent energy delivery. The Transformer and Substation segments are also significant, with robust growth projected due to increasing infrastructure upgrades and modernization efforts. Each segment's growth projections, market size, and competitive dynamics are discussed in detail in the full report.
Key Drivers of Utility Asset Management Industry Growth
Several factors drive the growth of the UAM industry. Firstly, the aging infrastructure of many utility grids necessitates significant investments in modernization and upgrades. This compels utilities to adopt effective asset management strategies. Secondly, regulatory pressures to improve grid reliability and efficiency push utilities to implement advanced UAM solutions. Finally, the technological advancements in AI, ML, IoT, and Big Data Analytics offer utilities opportunities to optimize asset performance and reduce operational costs. The increasing integration of renewable energy sources also fuels demand for effective UAM systems to manage the complexities of distributed generation.
Challenges in the Utility Asset Management Industry Sector
The UAM industry faces several challenges, including the high initial investment costs associated with implementing advanced solutions, the complexity of integrating new technologies into existing infrastructure, and the need for skilled personnel to operate and maintain these systems. Furthermore, data security concerns and potential regulatory hurdles can also hinder market growth. Supply chain disruptions can impact the availability of critical components and equipment, impacting project timelines and increasing costs. Intense competition among vendors further contributes to the challenge of maintaining profitability and market share. These factors can collectively decrease the rate of adoption of advanced UAM technologies and affect the overall market growth.
Leading Players in the Utility Asset Management Industry Market
- Netcontrol Oy
- ABB Ltd
- Enetics Inc
- Emerson Electric Co
- Siemens AG
- Aclara Technologies LLC
- Lindsey Manufacturing Co
- Sentient Energy Inc
- General Electric Company
- S&C Electric Company
Key Developments in Utility Asset Management Industry Sector
September 2022: An electricity utility in Seguin, Texas, implemented a comprehensive monitoring and control system, integrating SCADA, OMS, AMI, GIS Mapping, and energy efficiency software to improve customer reliability and manage its vast network. This showcases the growing trend towards integrated UAM solutions.
May 2022: GE Digital launched its Distributed Energy Resource Management System (DERMS), enhancing grid safety, security, and resilience by providing intelligence and optimization capabilities for managing DERs. This highlights the increasing importance of managing distributed energy resources within the UAM context.
Strategic Utility Asset Management Industry Market Outlook
The future of the UAM industry appears bright, with continued growth driven by increasing demand for reliable energy delivery, advancements in data analytics and AI, and the rising adoption of smart grid technologies. The focus on grid modernization initiatives globally, coupled with the need to enhance operational efficiency and reduce costs, creates substantial opportunities for UAM solution providers. Strategic partnerships, technological innovation, and a focus on providing comprehensive, integrated solutions will be crucial for success in this evolving market. The market's potential for growth is significant, with considerable opportunities for expansion in emerging markets and untapped segments.
Utility Asset Management Industry Segmentation
-
1. Application
- 1.1. Transformer
- 1.2. Sub-Station
- 1.3. Transimission & Distribution Network
-
2. Utility Type
- 2.1. Public Utility
- 2.2. Private Utility
Utility Asset Management Industry Segmentation By Geography
- 1. North America
- 2. Asia Pacific
- 3. Europe
- 4. South America
- 5. Middle East and Africa
Utility Asset Management Industry REPORT HIGHLIGHTS
| Aspects | Details |
|---|---|
| Study Period | 2019-2033 |
| Base Year | 2024 |
| Estimated Year | 2025 |
| Forecast Period | 2025-2033 |
| Historical Period | 2019-2024 |
| Growth Rate | CAGR of > 7.50% from 2019-2033 |
| Segmentation |
|
Table of Contents
- 1. Introduction
- 1.1. Research Scope
- 1.2. Market Segmentation
- 1.3. Research Methodology
- 1.4. Definitions and Assumptions
- 2. Executive Summary
- 2.1. Introduction
- 3. Market Dynamics
- 3.1. Introduction
- 3.2. Market Drivers
- 3.2.1. 4.; Several Government Plans for the Energy Transition in the Region
- 3.3. Market Restrains
- 3.3.1. 4.; Increasing Adoption of Self-generated Renewable Power in the Residential and Commercial Sectors
- 3.4. Market Trends
- 3.4.1. Transformer to Witness Significant Growth
- 4. Market Factor Analysis
- 4.1. Porters Five Forces
- 4.2. Supply/Value Chain
- 4.3. PESTEL analysis
- 4.4. Market Entropy
- 4.5. Patent/Trademark Analysis
- 5. Global Utility Asset Management Industry Analysis, Insights and Forecast, 2019-2031
- 5.1. Market Analysis, Insights and Forecast - by Application
- 5.1.1. Transformer
- 5.1.2. Sub-Station
- 5.1.3. Transimission & Distribution Network
- 5.2. Market Analysis, Insights and Forecast - by Utility Type
- 5.2.1. Public Utility
- 5.2.2. Private Utility
- 5.3. Market Analysis, Insights and Forecast - by Region
- 5.3.1. North America
- 5.3.2. Asia Pacific
- 5.3.3. Europe
- 5.3.4. South America
- 5.3.5. Middle East and Africa
- 5.1. Market Analysis, Insights and Forecast - by Application
- 6. North America Utility Asset Management Industry Analysis, Insights and Forecast, 2019-2031
- 6.1. Market Analysis, Insights and Forecast - by Application
- 6.1.1. Transformer
- 6.1.2. Sub-Station
- 6.1.3. Transimission & Distribution Network
- 6.2. Market Analysis, Insights and Forecast - by Utility Type
- 6.2.1. Public Utility
- 6.2.2. Private Utility
- 6.1. Market Analysis, Insights and Forecast - by Application
- 7. Asia Pacific Utility Asset Management Industry Analysis, Insights and Forecast, 2019-2031
- 7.1. Market Analysis, Insights and Forecast - by Application
- 7.1.1. Transformer
- 7.1.2. Sub-Station
- 7.1.3. Transimission & Distribution Network
- 7.2. Market Analysis, Insights and Forecast - by Utility Type
- 7.2.1. Public Utility
- 7.2.2. Private Utility
- 7.1. Market Analysis, Insights and Forecast - by Application
- 8. Europe Utility Asset Management Industry Analysis, Insights and Forecast, 2019-2031
- 8.1. Market Analysis, Insights and Forecast - by Application
- 8.1.1. Transformer
- 8.1.2. Sub-Station
- 8.1.3. Transimission & Distribution Network
- 8.2. Market Analysis, Insights and Forecast - by Utility Type
- 8.2.1. Public Utility
- 8.2.2. Private Utility
- 8.1. Market Analysis, Insights and Forecast - by Application
- 9. South America Utility Asset Management Industry Analysis, Insights and Forecast, 2019-2031
- 9.1. Market Analysis, Insights and Forecast - by Application
- 9.1.1. Transformer
- 9.1.2. Sub-Station
- 9.1.3. Transimission & Distribution Network
- 9.2. Market Analysis, Insights and Forecast - by Utility Type
- 9.2.1. Public Utility
- 9.2.2. Private Utility
- 9.1. Market Analysis, Insights and Forecast - by Application
- 10. Middle East and Africa Utility Asset Management Industry Analysis, Insights and Forecast, 2019-2031
- 10.1. Market Analysis, Insights and Forecast - by Application
- 10.1.1. Transformer
- 10.1.2. Sub-Station
- 10.1.3. Transimission & Distribution Network
- 10.2. Market Analysis, Insights and Forecast - by Utility Type
- 10.2.1. Public Utility
- 10.2.2. Private Utility
- 10.1. Market Analysis, Insights and Forecast - by Application
- 11. North America Utility Asset Management Industry Analysis, Insights and Forecast, 2019-2031
- 11.1. Market Analysis, Insights and Forecast - By Country/Sub-region
- 11.1.1 United States
- 11.1.2 Canada
- 11.1.3 Mexico
- 12. Europe Utility Asset Management Industry Analysis, Insights and Forecast, 2019-2031
- 12.1. Market Analysis, Insights and Forecast - By Country/Sub-region
- 12.1.1 Germany
- 12.1.2 United Kingdom
- 12.1.3 France
- 12.1.4 Spain
- 12.1.5 Italy
- 12.1.6 Spain
- 12.1.7 Belgium
- 12.1.8 Netherland
- 12.1.9 Nordics
- 12.1.10 Rest of Europe
- 13. Asia Pacific Utility Asset Management Industry Analysis, Insights and Forecast, 2019-2031
- 13.1. Market Analysis, Insights and Forecast - By Country/Sub-region
- 13.1.1 China
- 13.1.2 Japan
- 13.1.3 India
- 13.1.4 South Korea
- 13.1.5 Southeast Asia
- 13.1.6 Australia
- 13.1.7 Indonesia
- 13.1.8 Phillipes
- 13.1.9 Singapore
- 13.1.10 Thailandc
- 13.1.11 Rest of Asia Pacific
- 14. South America Utility Asset Management Industry Analysis, Insights and Forecast, 2019-2031
- 14.1. Market Analysis, Insights and Forecast - By Country/Sub-region
- 14.1.1 Brazil
- 14.1.2 Argentina
- 14.1.3 Peru
- 14.1.4 Chile
- 14.1.5 Colombia
- 14.1.6 Ecuador
- 14.1.7 Venezuela
- 14.1.8 Rest of South America
- 15. North America Utility Asset Management Industry Analysis, Insights and Forecast, 2019-2031
- 15.1. Market Analysis, Insights and Forecast - By Country/Sub-region
- 15.1.1 United States
- 15.1.2 Canada
- 15.1.3 Mexico
- 16. MEA Utility Asset Management Industry Analysis, Insights and Forecast, 2019-2031
- 16.1. Market Analysis, Insights and Forecast - By Country/Sub-region
- 16.1.1 United Arab Emirates
- 16.1.2 Saudi Arabia
- 16.1.3 South Africa
- 16.1.4 Rest of Middle East and Africa
- 17. Competitive Analysis
- 17.1. Global Market Share Analysis 2024
- 17.2. Company Profiles
- 17.2.1 Netcontrol Oy *List Not Exhaustive
- 17.2.1.1. Overview
- 17.2.1.2. Products
- 17.2.1.3. SWOT Analysis
- 17.2.1.4. Recent Developments
- 17.2.1.5. Financials (Based on Availability)
- 17.2.2 ABB Ltd
- 17.2.2.1. Overview
- 17.2.2.2. Products
- 17.2.2.3. SWOT Analysis
- 17.2.2.4. Recent Developments
- 17.2.2.5. Financials (Based on Availability)
- 17.2.3 Enetics Inc
- 17.2.3.1. Overview
- 17.2.3.2. Products
- 17.2.3.3. SWOT Analysis
- 17.2.3.4. Recent Developments
- 17.2.3.5. Financials (Based on Availability)
- 17.2.4 Emerson Electric Co
- 17.2.4.1. Overview
- 17.2.4.2. Products
- 17.2.4.3. SWOT Analysis
- 17.2.4.4. Recent Developments
- 17.2.4.5. Financials (Based on Availability)
- 17.2.5 Siemens AG
- 17.2.5.1. Overview
- 17.2.5.2. Products
- 17.2.5.3. SWOT Analysis
- 17.2.5.4. Recent Developments
- 17.2.5.5. Financials (Based on Availability)
- 17.2.6 Aclara Technologies LLC
- 17.2.6.1. Overview
- 17.2.6.2. Products
- 17.2.6.3. SWOT Analysis
- 17.2.6.4. Recent Developments
- 17.2.6.5. Financials (Based on Availability)
- 17.2.7 Lindsey Manufacturing Co
- 17.2.7.1. Overview
- 17.2.7.2. Products
- 17.2.7.3. SWOT Analysis
- 17.2.7.4. Recent Developments
- 17.2.7.5. Financials (Based on Availability)
- 17.2.8 Sentient Energy Inc
- 17.2.8.1. Overview
- 17.2.8.2. Products
- 17.2.8.3. SWOT Analysis
- 17.2.8.4. Recent Developments
- 17.2.8.5. Financials (Based on Availability)
- 17.2.9 General Electric Company
- 17.2.9.1. Overview
- 17.2.9.2. Products
- 17.2.9.3. SWOT Analysis
- 17.2.9.4. Recent Developments
- 17.2.9.5. Financials (Based on Availability)
- 17.2.10 S&C Electric Company
- 17.2.10.1. Overview
- 17.2.10.2. Products
- 17.2.10.3. SWOT Analysis
- 17.2.10.4. Recent Developments
- 17.2.10.5. Financials (Based on Availability)
- 17.2.1 Netcontrol Oy *List Not Exhaustive
List of Figures
- Figure 1: Global Utility Asset Management Industry Revenue Breakdown (Million, %) by Region 2024 & 2032
- Figure 2: North America Utility Asset Management Industry Revenue (Million), by Country 2024 & 2032
- Figure 3: North America Utility Asset Management Industry Revenue Share (%), by Country 2024 & 2032
- Figure 4: Europe Utility Asset Management Industry Revenue (Million), by Country 2024 & 2032
- Figure 5: Europe Utility Asset Management Industry Revenue Share (%), by Country 2024 & 2032
- Figure 6: Asia Pacific Utility Asset Management Industry Revenue (Million), by Country 2024 & 2032
- Figure 7: Asia Pacific Utility Asset Management Industry Revenue Share (%), by Country 2024 & 2032
- Figure 8: South America Utility Asset Management Industry Revenue (Million), by Country 2024 & 2032
- Figure 9: South America Utility Asset Management Industry Revenue Share (%), by Country 2024 & 2032
- Figure 10: North America Utility Asset Management Industry Revenue (Million), by Country 2024 & 2032
- Figure 11: North America Utility Asset Management Industry Revenue Share (%), by Country 2024 & 2032
- Figure 12: MEA Utility Asset Management Industry Revenue (Million), by Country 2024 & 2032
- Figure 13: MEA Utility Asset Management Industry Revenue Share (%), by Country 2024 & 2032
- Figure 14: North America Utility Asset Management Industry Revenue (Million), by Application 2024 & 2032
- Figure 15: North America Utility Asset Management Industry Revenue Share (%), by Application 2024 & 2032
- Figure 16: North America Utility Asset Management Industry Revenue (Million), by Utility Type 2024 & 2032
- Figure 17: North America Utility Asset Management Industry Revenue Share (%), by Utility Type 2024 & 2032
- Figure 18: North America Utility Asset Management Industry Revenue (Million), by Country 2024 & 2032
- Figure 19: North America Utility Asset Management Industry Revenue Share (%), by Country 2024 & 2032
- Figure 20: Asia Pacific Utility Asset Management Industry Revenue (Million), by Application 2024 & 2032
- Figure 21: Asia Pacific Utility Asset Management Industry Revenue Share (%), by Application 2024 & 2032
- Figure 22: Asia Pacific Utility Asset Management Industry Revenue (Million), by Utility Type 2024 & 2032
- Figure 23: Asia Pacific Utility Asset Management Industry Revenue Share (%), by Utility Type 2024 & 2032
- Figure 24: Asia Pacific Utility Asset Management Industry Revenue (Million), by Country 2024 & 2032
- Figure 25: Asia Pacific Utility Asset Management Industry Revenue Share (%), by Country 2024 & 2032
- Figure 26: Europe Utility Asset Management Industry Revenue (Million), by Application 2024 & 2032
- Figure 27: Europe Utility Asset Management Industry Revenue Share (%), by Application 2024 & 2032
- Figure 28: Europe Utility Asset Management Industry Revenue (Million), by Utility Type 2024 & 2032
- Figure 29: Europe Utility Asset Management Industry Revenue Share (%), by Utility Type 2024 & 2032
- Figure 30: Europe Utility Asset Management Industry Revenue (Million), by Country 2024 & 2032
- Figure 31: Europe Utility Asset Management Industry Revenue Share (%), by Country 2024 & 2032
- Figure 32: South America Utility Asset Management Industry Revenue (Million), by Application 2024 & 2032
- Figure 33: South America Utility Asset Management Industry Revenue Share (%), by Application 2024 & 2032
- Figure 34: South America Utility Asset Management Industry Revenue (Million), by Utility Type 2024 & 2032
- Figure 35: South America Utility Asset Management Industry Revenue Share (%), by Utility Type 2024 & 2032
- Figure 36: South America Utility Asset Management Industry Revenue (Million), by Country 2024 & 2032
- Figure 37: South America Utility Asset Management Industry Revenue Share (%), by Country 2024 & 2032
- Figure 38: Middle East and Africa Utility Asset Management Industry Revenue (Million), by Application 2024 & 2032
- Figure 39: Middle East and Africa Utility Asset Management Industry Revenue Share (%), by Application 2024 & 2032
- Figure 40: Middle East and Africa Utility Asset Management Industry Revenue (Million), by Utility Type 2024 & 2032
- Figure 41: Middle East and Africa Utility Asset Management Industry Revenue Share (%), by Utility Type 2024 & 2032
- Figure 42: Middle East and Africa Utility Asset Management Industry Revenue (Million), by Country 2024 & 2032
- Figure 43: Middle East and Africa Utility Asset Management Industry Revenue Share (%), by Country 2024 & 2032
List of Tables
- Table 1: Global Utility Asset Management Industry Revenue Million Forecast, by Region 2019 & 2032
- Table 2: Global Utility Asset Management Industry Revenue Million Forecast, by Application 2019 & 2032
- Table 3: Global Utility Asset Management Industry Revenue Million Forecast, by Utility Type 2019 & 2032
- Table 4: Global Utility Asset Management Industry Revenue Million Forecast, by Region 2019 & 2032
- Table 5: Global Utility Asset Management Industry Revenue Million Forecast, by Country 2019 & 2032
- Table 6: United States Utility Asset Management Industry Revenue (Million) Forecast, by Application 2019 & 2032
- Table 7: Canada Utility Asset Management Industry Revenue (Million) Forecast, by Application 2019 & 2032
- Table 8: Mexico Utility Asset Management Industry Revenue (Million) Forecast, by Application 2019 & 2032
- Table 9: Global Utility Asset Management Industry Revenue Million Forecast, by Country 2019 & 2032
- Table 10: Germany Utility Asset Management Industry Revenue (Million) Forecast, by Application 2019 & 2032
- Table 11: United Kingdom Utility Asset Management Industry Revenue (Million) Forecast, by Application 2019 & 2032
- Table 12: France Utility Asset Management Industry Revenue (Million) Forecast, by Application 2019 & 2032
- Table 13: Spain Utility Asset Management Industry Revenue (Million) Forecast, by Application 2019 & 2032
- Table 14: Italy Utility Asset Management Industry Revenue (Million) Forecast, by Application 2019 & 2032
- Table 15: Spain Utility Asset Management Industry Revenue (Million) Forecast, by Application 2019 & 2032
- Table 16: Belgium Utility Asset Management Industry Revenue (Million) Forecast, by Application 2019 & 2032
- Table 17: Netherland Utility Asset Management Industry Revenue (Million) Forecast, by Application 2019 & 2032
- Table 18: Nordics Utility Asset Management Industry Revenue (Million) Forecast, by Application 2019 & 2032
- Table 19: Rest of Europe Utility Asset Management Industry Revenue (Million) Forecast, by Application 2019 & 2032
- Table 20: Global Utility Asset Management Industry Revenue Million Forecast, by Country 2019 & 2032
- Table 21: China Utility Asset Management Industry Revenue (Million) Forecast, by Application 2019 & 2032
- Table 22: Japan Utility Asset Management Industry Revenue (Million) Forecast, by Application 2019 & 2032
- Table 23: India Utility Asset Management Industry Revenue (Million) Forecast, by Application 2019 & 2032
- Table 24: South Korea Utility Asset Management Industry Revenue (Million) Forecast, by Application 2019 & 2032
- Table 25: Southeast Asia Utility Asset Management Industry Revenue (Million) Forecast, by Application 2019 & 2032
- Table 26: Australia Utility Asset Management Industry Revenue (Million) Forecast, by Application 2019 & 2032
- Table 27: Indonesia Utility Asset Management Industry Revenue (Million) Forecast, by Application 2019 & 2032
- Table 28: Phillipes Utility Asset Management Industry Revenue (Million) Forecast, by Application 2019 & 2032
- Table 29: Singapore Utility Asset Management Industry Revenue (Million) Forecast, by Application 2019 & 2032
- Table 30: Thailandc Utility Asset Management Industry Revenue (Million) Forecast, by Application 2019 & 2032
- Table 31: Rest of Asia Pacific Utility Asset Management Industry Revenue (Million) Forecast, by Application 2019 & 2032
- Table 32: Global Utility Asset Management Industry Revenue Million Forecast, by Country 2019 & 2032
- Table 33: Brazil Utility Asset Management Industry Revenue (Million) Forecast, by Application 2019 & 2032
- Table 34: Argentina Utility Asset Management Industry Revenue (Million) Forecast, by Application 2019 & 2032
- Table 35: Peru Utility Asset Management Industry Revenue (Million) Forecast, by Application 2019 & 2032
- Table 36: Chile Utility Asset Management Industry Revenue (Million) Forecast, by Application 2019 & 2032
- Table 37: Colombia Utility Asset Management Industry Revenue (Million) Forecast, by Application 2019 & 2032
- Table 38: Ecuador Utility Asset Management Industry Revenue (Million) Forecast, by Application 2019 & 2032
- Table 39: Venezuela Utility Asset Management Industry Revenue (Million) Forecast, by Application 2019 & 2032
- Table 40: Rest of South America Utility Asset Management Industry Revenue (Million) Forecast, by Application 2019 & 2032
- Table 41: Global Utility Asset Management Industry Revenue Million Forecast, by Country 2019 & 2032
- Table 42: United States Utility Asset Management Industry Revenue (Million) Forecast, by Application 2019 & 2032
- Table 43: Canada Utility Asset Management Industry Revenue (Million) Forecast, by Application 2019 & 2032
- Table 44: Mexico Utility Asset Management Industry Revenue (Million) Forecast, by Application 2019 & 2032
- Table 45: Global Utility Asset Management Industry Revenue Million Forecast, by Country 2019 & 2032
- Table 46: United Arab Emirates Utility Asset Management Industry Revenue (Million) Forecast, by Application 2019 & 2032
- Table 47: Saudi Arabia Utility Asset Management Industry Revenue (Million) Forecast, by Application 2019 & 2032
- Table 48: South Africa Utility Asset Management Industry Revenue (Million) Forecast, by Application 2019 & 2032
- Table 49: Rest of Middle East and Africa Utility Asset Management Industry Revenue (Million) Forecast, by Application 2019 & 2032
- Table 50: Global Utility Asset Management Industry Revenue Million Forecast, by Application 2019 & 2032
- Table 51: Global Utility Asset Management Industry Revenue Million Forecast, by Utility Type 2019 & 2032
- Table 52: Global Utility Asset Management Industry Revenue Million Forecast, by Country 2019 & 2032
- Table 53: Global Utility Asset Management Industry Revenue Million Forecast, by Application 2019 & 2032
- Table 54: Global Utility Asset Management Industry Revenue Million Forecast, by Utility Type 2019 & 2032
- Table 55: Global Utility Asset Management Industry Revenue Million Forecast, by Country 2019 & 2032
- Table 56: Global Utility Asset Management Industry Revenue Million Forecast, by Application 2019 & 2032
- Table 57: Global Utility Asset Management Industry Revenue Million Forecast, by Utility Type 2019 & 2032
- Table 58: Global Utility Asset Management Industry Revenue Million Forecast, by Country 2019 & 2032
- Table 59: Global Utility Asset Management Industry Revenue Million Forecast, by Application 2019 & 2032
- Table 60: Global Utility Asset Management Industry Revenue Million Forecast, by Utility Type 2019 & 2032
- Table 61: Global Utility Asset Management Industry Revenue Million Forecast, by Country 2019 & 2032
- Table 62: Global Utility Asset Management Industry Revenue Million Forecast, by Application 2019 & 2032
- Table 63: Global Utility Asset Management Industry Revenue Million Forecast, by Utility Type 2019 & 2032
- Table 64: Global Utility Asset Management Industry Revenue Million Forecast, by Country 2019 & 2032
Frequently Asked Questions
1. What is the projected Compound Annual Growth Rate (CAGR) of the Utility Asset Management Industry?
The projected CAGR is approximately > 7.50%.
2. Which companies are prominent players in the Utility Asset Management Industry?
Key companies in the market include Netcontrol Oy *List Not Exhaustive, ABB Ltd, Enetics Inc, Emerson Electric Co, Siemens AG, Aclara Technologies LLC, Lindsey Manufacturing Co, Sentient Energy Inc, General Electric Company, S&C Electric Company.
3. What are the main segments of the Utility Asset Management Industry?
The market segments include Application, Utility Type.
4. Can you provide details about the market size?
The market size is estimated to be USD XX Million as of 2022.
5. What are some drivers contributing to market growth?
4.; Several Government Plans for the Energy Transition in the Region.
6. What are the notable trends driving market growth?
Transformer to Witness Significant Growth.
7. Are there any restraints impacting market growth?
4.; Increasing Adoption of Self-generated Renewable Power in the Residential and Commercial Sectors.
8. Can you provide examples of recent developments in the market?
September 2022: An electricity utility in Seguin, Texas, installed a complete monitoring and control system. The utility installed a SCADA system and integrated it with Outage Management System software, Advanced Metering Infrastructure (AMI) technology, GIS Mapping, and energy efficiency software to improve customer reliability. This system would help the utility to manage the vast and dispersed networks.
9. What pricing options are available for accessing the report?
Pricing options include single-user, multi-user, and enterprise licenses priced at USD 4750, USD 5250, and USD 8750 respectively.
10. Is the market size provided in terms of value or volume?
The market size is provided in terms of value, measured in Million.
11. Are there any specific market keywords associated with the report?
Yes, the market keyword associated with the report is "Utility Asset Management Industry," which aids in identifying and referencing the specific market segment covered.
12. How do I determine which pricing option suits my needs best?
The pricing options vary based on user requirements and access needs. Individual users may opt for single-user licenses, while businesses requiring broader access may choose multi-user or enterprise licenses for cost-effective access to the report.
13. Are there any additional resources or data provided in the Utility Asset Management Industry report?
While the report offers comprehensive insights, it's advisable to review the specific contents or supplementary materials provided to ascertain if additional resources or data are available.
14. How can I stay updated on further developments or reports in the Utility Asset Management Industry?
To stay informed about further developments, trends, and reports in the Utility Asset Management Industry, consider subscribing to industry newsletters, following relevant companies and organizations, or regularly checking reputable industry news sources and publications.
Methodology
Step 1 - Identification of Relevant Samples Size from Population Database


Step 2 - Approaches for Defining Global Market Size (Value, Volume* & Price*)

Note*: In applicable scenarios
Step 3 - Data Sources
Primary Research
- Web Analytics
- Survey Reports
- Research Institute
- Latest Research Reports
- Opinion Leaders
Secondary Research
- Annual Reports
- White Paper
- Latest Press Release
- Industry Association
- Paid Database
- Investor Presentations

Step 4 - Data Triangulation
Involves using different sources of information in order to increase the validity of a study
These sources are likely to be stakeholders in a program - participants, other researchers, program staff, other community members, and so on.
Then we put all data in single framework & apply various statistical tools to find out the dynamic on the market.
During the analysis stage, feedback from the stakeholder groups would be compared to determine areas of agreement as well as areas of divergence


