
Key Insights
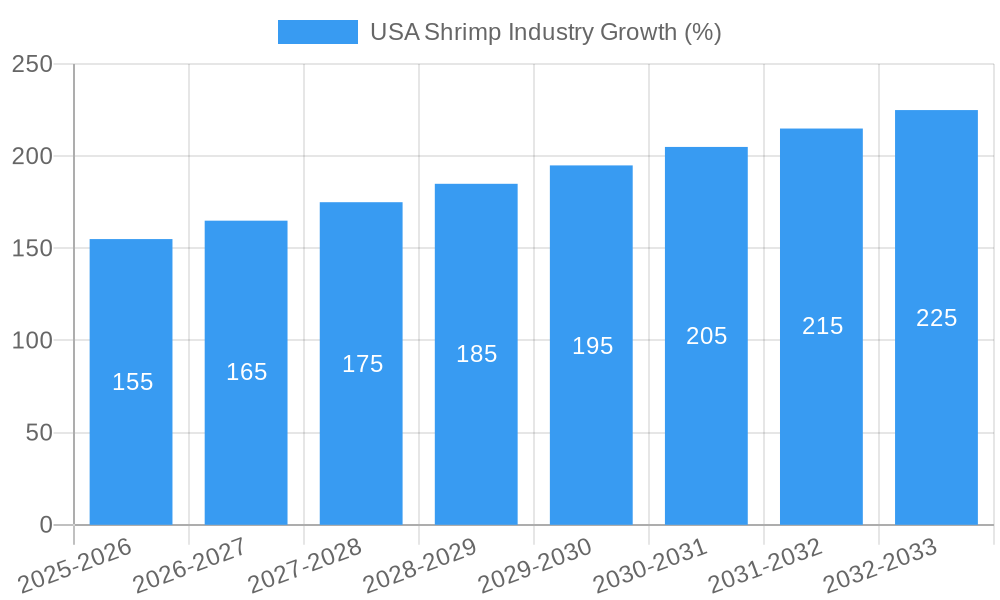
The US shrimp market, valued at approximately $2.5 billion in 2025, is projected to experience robust growth, exhibiting a Compound Annual Growth Rate (CAGR) of 6.04% from 2025 to 2033. This expansion is fueled by several key drivers. Increasing consumer demand for seafood, particularly shrimp, due to its nutritional value and versatility in culinary applications, is a primary factor. The growing popularity of shrimp in various cuisines, from casual dining to upscale restaurants, further boosts market growth. Furthermore, the expanding food service sector, encompassing restaurants, hotels, and catering services, significantly contributes to the demand. Convenience-oriented formats like pre-cooked, frozen, and canned shrimp are gaining traction, catering to busy lifestyles and simplifying meal preparation. However, challenges exist. Fluctuations in shrimp prices due to factors like weather patterns, disease outbreaks, and global supply chain disruptions can restrain market growth. Sustainability concerns regarding shrimp farming practices also pose a challenge, with consumers increasingly demanding eco-friendly and responsibly sourced products. Market segmentation reveals strong performance across distribution channels, with both on-trade (restaurants and hotels) and off-trade (retailers and e-commerce) segments showing substantial growth. The canned, fresh/chilled, and frozen shrimp formats dominate the market, reflecting consumer preferences for convenience and preservation. Key players, including The American Shrimp Company, Admiralty Island Fisheries Inc., and others, are strategically positioning themselves to capitalize on these market trends through product diversification, innovation, and sustainable sourcing practices.
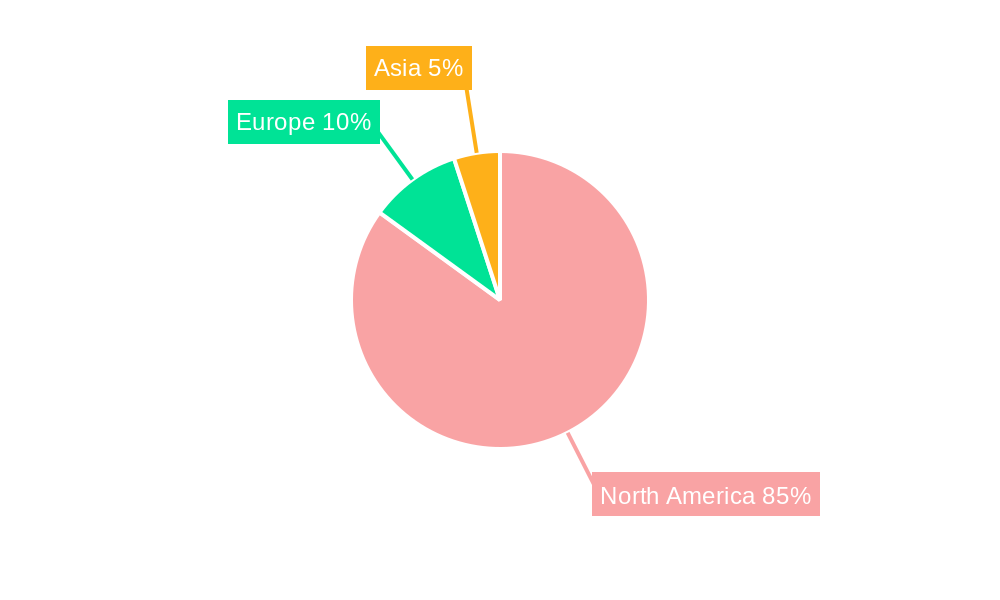
The competitive landscape is characterized by a mix of large-scale processors and smaller, regional players. The market is witnessing consolidation, with larger companies acquiring smaller ones to gain market share and enhance their supply chain efficiency. Geographic focus remains primarily on North America, with the United States accounting for the largest share. Future growth will likely depend on maintaining sustainable shrimp farming practices, mitigating price volatility, and meeting the growing demand for convenient and ethically sourced shrimp products. Innovations in processing and packaging, along with targeted marketing campaigns promoting the health benefits and versatility of shrimp, will be crucial for sustained market expansion. The ongoing trend toward healthier eating habits, coupled with the increasing popularity of shrimp in various culinary applications, suggests a promising outlook for the US shrimp industry.

USA Shrimp Industry: Market Analysis & Forecast (2019-2033)
This comprehensive report provides a detailed analysis of the USA shrimp industry, covering market structure, competitive dynamics, key trends, and future growth prospects. The study period spans from 2019 to 2033, with 2025 serving as the base and estimated year. This report offers actionable insights for industry stakeholders, including producers, distributors, and investors. The total market size is estimated at xx Million USD in 2025, with a projected Compound Annual Growth Rate (CAGR) of xx% during the forecast period (2025-2033).
USA Shrimp Industry Market Structure & Competitive Dynamics
The USA shrimp industry is characterized by a moderately concentrated market structure, with several large players and numerous smaller regional producers. Market share is largely determined by production capacity, distribution networks, and brand recognition. The industry exhibits a dynamic competitive landscape shaped by factors including technological advancements, evolving consumer preferences, and increasing regulatory scrutiny. Mergers and acquisitions (M&A) activity has been moderate in recent years, with deal values ranging from xx Million to xx Million USD, primarily focused on consolidating production and distribution capabilities. Innovation in sustainable aquaculture practices, such as recirculating aquaculture systems (RAS), is driving growth, while increased competition from imported shrimp presents a significant challenge. Regulatory frameworks, including those related to food safety and environmental sustainability, influence the operational costs and strategies of industry players. Product substitution pressures primarily come from other seafood alternatives, leading to a focus on premium shrimp products and value-added offerings. The increasing demand for sustainable and ethically sourced shrimp drives end-user trends.
- Market Concentration: Moderately concentrated, with a few dominant players holding significant market share.
- Innovation Ecosystems: Growing focus on sustainable aquaculture technologies (RAS).
- Regulatory Frameworks: Stringent food safety and environmental regulations.
- Product Substitutes: Other seafood options (e.g., salmon, tilapia).
- End-User Trends: Increasing demand for sustainable and ethically sourced shrimp.
- M&A Activity: Moderate activity, with deal values ranging from xx Million to xx Million USD.
USA Shrimp Industry Industry Trends & Insights
The USA shrimp industry is experiencing significant growth driven by several factors, including rising consumer demand for seafood, increasing disposable incomes, and the expanding food service sector. The CAGR for the period 2019-2024 was xx%, with a projected CAGR of xx% for 2025-2033. Technological advancements in aquaculture, such as RAS technology, are improving efficiency and sustainability, while consumer preferences are shifting towards healthier, ethically sourced, and sustainably produced shrimp. The market penetration of sustainably produced shrimp is steadily increasing, reflecting growing consumer awareness and preference for environmentally friendly practices. Competitive dynamics are shaped by factors including pricing pressure from imports, innovation in processing and packaging, and brand differentiation strategies. The industry faces challenges related to fluctuating raw material costs, labor shortages, and logistical complexities. The market shows strong potential for growth through the adoption of innovative technologies, strategic partnerships, and expansion into emerging markets.
Dominant Markets & Segments in USA Shrimp Industry
The frozen shrimp segment commands the largest market share, driven by convenience and longer shelf life. Within distribution channels, the on-trade segment (restaurants, hotels) holds a significant share due to high demand from the food service sector. The leading regions are the southern states, benefiting from proximity to production areas and established distribution networks.
- Key Drivers in Frozen Shrimp Segment: Convenience, longer shelf life, cost-effectiveness.
- Key Drivers in On-Trade Segment: High demand from restaurants and hotels.
- Leading Regions: Southern states (e.g., Texas, Louisiana, Georgia) due to proximity to production and established distribution.
The dominance analysis reveals that the frozen shrimp segment benefits from its cost-effectiveness and extended shelf life, making it particularly attractive for large-scale distribution and retail sales. The on-trade segment benefits from the high volume of shrimp consumed in restaurants and hotels. The geographic concentration in southern states reflects the historical concentration of shrimp farming and processing facilities in these areas, benefiting from favorable climatic conditions and established infrastructure.
USA Shrimp Industry Product Innovations
Recent product innovations focus on value-added shrimp products, such as pre-cooked, seasoned, and breaded shrimp, catering to consumer convenience and diverse culinary preferences. Technological advancements in processing and packaging technologies have improved product quality, extended shelf life, and enhanced food safety. These innovations enhance market fit by aligning with consumer demand for convenience and premium quality.
Report Segmentation & Scope
This report segments the USA shrimp industry based on distribution channels (on-trade and off-trade) and product forms (canned, fresh/chilled, frozen, processed). Growth projections, market sizes, and competitive dynamics are analyzed for each segment.
- Distribution Channels: On-Trade (restaurants, hotels) and Off-Trade (retailers, e-commerce) show distinct growth patterns based on consumer behavior and industry trends.
- Product Forms: Canned, fresh/chilled, frozen, and processed shrimp segments exhibit varying market sizes and growth rates driven by consumer preferences and technological advancements.
Key Drivers of USA Shrimp Industry Growth
Key growth drivers include increasing consumer demand for seafood, rising disposable incomes, technological advancements in sustainable aquaculture (RAS), and the expansion of food service sector. Government support for sustainable aquaculture practices further contributes to industry growth. Efficient logistics and strong distribution networks also play a vital role.
Challenges in the USA Shrimp Industry Sector
Challenges include fluctuating raw material costs, intense competition from imported shrimp, labor shortages, environmental regulations, and supply chain disruptions. These factors impose considerable constraints on industry profitability and sustainability. The fluctuating prices of raw materials directly impact production costs and profitability, while competition from imports puts downward pressure on prices.
Leading Players in the USA Shrimp Industry Market
- The American Shrimp Company
- Admiralty Island Fisheries Inc
- Beaver Street Fisheries
- Gulf Shrimp Co LLC
- Pacific American Fish Company Inc
- Millennium Ocean Star Corporation
- Dulcich Inc
- Sysco Corporation
- NaturalShrimp Inc
- Paul Piazza & Son Inc
Key Developments in USA Shrimp Industry Sector
- March 2022: Beaver Street Fisheries completed its packaging facility renovation in Jacksonville, improving storage capacity and efficiency.
- February 2022: NaturalShrimp partnered with Jefferson County, Florida, to build a new shrimp production facility and seek USD 25 Million in grants, signaling investment in expansion and sustainable aquaculture.
- January 2022: NaturalShrimp, Inc. and Gulf Shrimp Company Limited extended their partnership for live shrimp production using NaturalShrimp's RAS technology, promoting innovation and collaboration within the industry.
Strategic USA Shrimp Industry Market Outlook
The USA shrimp industry is poised for continued growth, driven by the increasing demand for sustainable and high-quality shrimp products. Strategic opportunities lie in investing in sustainable aquaculture technologies, expanding into value-added product segments, strengthening distribution networks, and focusing on building strong brands. Addressing challenges like labor shortages and supply chain vulnerabilities is crucial for long-term success.
USA Shrimp Industry Segmentation
-
1. Form
- 1.1. Canned
- 1.2. Fresh / Chilled
- 1.3. Frozen
- 1.4. Processed
-
2. Distribution Channel
-
2.1. Off-Trade
- 2.1.1. Convenience Stores
- 2.1.2. Online Channel
- 2.1.3. Supermarkets and Hypermarkets
- 2.1.4. Others
- 2.2. On-Trade
-
2.1. Off-Trade
USA Shrimp Industry Segmentation By Geography
-
1. North America
- 1.1. United States
- 1.2. Canada
- 1.3. Mexico
-
2. South America
- 2.1. Brazil
- 2.2. Argentina
- 2.3. Rest of South America
-
3. Europe
- 3.1. United Kingdom
- 3.2. Germany
- 3.3. France
- 3.4. Italy
- 3.5. Spain
- 3.6. Russia
- 3.7. Benelux
- 3.8. Nordics
- 3.9. Rest of Europe
-
4. Middle East & Africa
- 4.1. Turkey
- 4.2. Israel
- 4.3. GCC
- 4.4. North Africa
- 4.5. South Africa
- 4.6. Rest of Middle East & Africa
-
5. Asia Pacific
- 5.1. China
- 5.2. India
- 5.3. Japan
- 5.4. South Korea
- 5.5. ASEAN
- 5.6. Oceania
- 5.7. Rest of Asia Pacific
USA Shrimp Industry REPORT HIGHLIGHTS
| Aspects | Details |
|---|---|
| Study Period | 2019-2033 |
| Base Year | 2024 |
| Estimated Year | 2025 |
| Forecast Period | 2025-2033 |
| Historical Period | 2019-2024 |
| Growth Rate | CAGR of 6.04% from 2019-2033 |
| Segmentation |
|
Table of Contents
- 1. Introduction
- 1.1. Research Scope
- 1.2. Market Segmentation
- 1.3. Research Methodology
- 1.4. Definitions and Assumptions
- 2. Executive Summary
- 2.1. Introduction
- 3. Market Dynamics
- 3.1. Introduction
- 3.2. Market Drivers
- 3.2.1. Increasing Focus on Maintaining Health and Well-Being; Launching Supplements For Specific Purposes and Targeted Population
- 3.3. Market Restrains
- 3.3.1. Supplement Consumption and Their Side-effects; Inclination Towards Substitute Products
- 3.4. Market Trends
- 3.4.1. Increased consumer spending on seafood is boosting sales
- 4. Market Factor Analysis
- 4.1. Porters Five Forces
- 4.2. Supply/Value Chain
- 4.3. PESTEL analysis
- 4.4. Market Entropy
- 4.5. Patent/Trademark Analysis
- 5. Global USA Shrimp Industry Analysis, Insights and Forecast, 2019-2031
- 5.1. Market Analysis, Insights and Forecast - by Form
- 5.1.1. Canned
- 5.1.2. Fresh / Chilled
- 5.1.3. Frozen
- 5.1.4. Processed
- 5.2. Market Analysis, Insights and Forecast - by Distribution Channel
- 5.2.1. Off-Trade
- 5.2.1.1. Convenience Stores
- 5.2.1.2. Online Channel
- 5.2.1.3. Supermarkets and Hypermarkets
- 5.2.1.4. Others
- 5.2.2. On-Trade
- 5.2.1. Off-Trade
- 5.3. Market Analysis, Insights and Forecast - by Region
- 5.3.1. North America
- 5.3.2. South America
- 5.3.3. Europe
- 5.3.4. Middle East & Africa
- 5.3.5. Asia Pacific
- 5.1. Market Analysis, Insights and Forecast - by Form
- 6. North America USA Shrimp Industry Analysis, Insights and Forecast, 2019-2031
- 6.1. Market Analysis, Insights and Forecast - by Form
- 6.1.1. Canned
- 6.1.2. Fresh / Chilled
- 6.1.3. Frozen
- 6.1.4. Processed
- 6.2. Market Analysis, Insights and Forecast - by Distribution Channel
- 6.2.1. Off-Trade
- 6.2.1.1. Convenience Stores
- 6.2.1.2. Online Channel
- 6.2.1.3. Supermarkets and Hypermarkets
- 6.2.1.4. Others
- 6.2.2. On-Trade
- 6.2.1. Off-Trade
- 6.1. Market Analysis, Insights and Forecast - by Form
- 7. South America USA Shrimp Industry Analysis, Insights and Forecast, 2019-2031
- 7.1. Market Analysis, Insights and Forecast - by Form
- 7.1.1. Canned
- 7.1.2. Fresh / Chilled
- 7.1.3. Frozen
- 7.1.4. Processed
- 7.2. Market Analysis, Insights and Forecast - by Distribution Channel
- 7.2.1. Off-Trade
- 7.2.1.1. Convenience Stores
- 7.2.1.2. Online Channel
- 7.2.1.3. Supermarkets and Hypermarkets
- 7.2.1.4. Others
- 7.2.2. On-Trade
- 7.2.1. Off-Trade
- 7.1. Market Analysis, Insights and Forecast - by Form
- 8. Europe USA Shrimp Industry Analysis, Insights and Forecast, 2019-2031
- 8.1. Market Analysis, Insights and Forecast - by Form
- 8.1.1. Canned
- 8.1.2. Fresh / Chilled
- 8.1.3. Frozen
- 8.1.4. Processed
- 8.2. Market Analysis, Insights and Forecast - by Distribution Channel
- 8.2.1. Off-Trade
- 8.2.1.1. Convenience Stores
- 8.2.1.2. Online Channel
- 8.2.1.3. Supermarkets and Hypermarkets
- 8.2.1.4. Others
- 8.2.2. On-Trade
- 8.2.1. Off-Trade
- 8.1. Market Analysis, Insights and Forecast - by Form
- 9. Middle East & Africa USA Shrimp Industry Analysis, Insights and Forecast, 2019-2031
- 9.1. Market Analysis, Insights and Forecast - by Form
- 9.1.1. Canned
- 9.1.2. Fresh / Chilled
- 9.1.3. Frozen
- 9.1.4. Processed
- 9.2. Market Analysis, Insights and Forecast - by Distribution Channel
- 9.2.1. Off-Trade
- 9.2.1.1. Convenience Stores
- 9.2.1.2. Online Channel
- 9.2.1.3. Supermarkets and Hypermarkets
- 9.2.1.4. Others
- 9.2.2. On-Trade
- 9.2.1. Off-Trade
- 9.1. Market Analysis, Insights and Forecast - by Form
- 10. Asia Pacific USA Shrimp Industry Analysis, Insights and Forecast, 2019-2031
- 10.1. Market Analysis, Insights and Forecast - by Form
- 10.1.1. Canned
- 10.1.2. Fresh / Chilled
- 10.1.3. Frozen
- 10.1.4. Processed
- 10.2. Market Analysis, Insights and Forecast - by Distribution Channel
- 10.2.1. Off-Trade
- 10.2.1.1. Convenience Stores
- 10.2.1.2. Online Channel
- 10.2.1.3. Supermarkets and Hypermarkets
- 10.2.1.4. Others
- 10.2.2. On-Trade
- 10.2.1. Off-Trade
- 10.1. Market Analysis, Insights and Forecast - by Form
- 11. United States USA Shrimp Industry Analysis, Insights and Forecast, 2019-2031
- 12. Canada USA Shrimp Industry Analysis, Insights and Forecast, 2019-2031
- 13. Mexico USA Shrimp Industry Analysis, Insights and Forecast, 2019-2031
- 14. Competitive Analysis
- 14.1. Global Market Share Analysis 2024
- 14.2. Company Profiles
- 14.2.1 The American Shrimp Compan
- 14.2.1.1. Overview
- 14.2.1.2. Products
- 14.2.1.3. SWOT Analysis
- 14.2.1.4. Recent Developments
- 14.2.1.5. Financials (Based on Availability)
- 14.2.2 Admiralty Island Fisheries Inc
- 14.2.2.1. Overview
- 14.2.2.2. Products
- 14.2.2.3. SWOT Analysis
- 14.2.2.4. Recent Developments
- 14.2.2.5. Financials (Based on Availability)
- 14.2.3 Beaver Street Fisheries
- 14.2.3.1. Overview
- 14.2.3.2. Products
- 14.2.3.3. SWOT Analysis
- 14.2.3.4. Recent Developments
- 14.2.3.5. Financials (Based on Availability)
- 14.2.4 Gulf Shrimp Co LLC
- 14.2.4.1. Overview
- 14.2.4.2. Products
- 14.2.4.3. SWOT Analysis
- 14.2.4.4. Recent Developments
- 14.2.4.5. Financials (Based on Availability)
- 14.2.5 Pacific American Fish Company Inc
- 14.2.5.1. Overview
- 14.2.5.2. Products
- 14.2.5.3. SWOT Analysis
- 14.2.5.4. Recent Developments
- 14.2.5.5. Financials (Based on Availability)
- 14.2.6 Millennium Ocean Star Corporation
- 14.2.6.1. Overview
- 14.2.6.2. Products
- 14.2.6.3. SWOT Analysis
- 14.2.6.4. Recent Developments
- 14.2.6.5. Financials (Based on Availability)
- 14.2.7 Dulcich Inc
- 14.2.7.1. Overview
- 14.2.7.2. Products
- 14.2.7.3. SWOT Analysis
- 14.2.7.4. Recent Developments
- 14.2.7.5. Financials (Based on Availability)
- 14.2.8 Sysco Corporation
- 14.2.8.1. Overview
- 14.2.8.2. Products
- 14.2.8.3. SWOT Analysis
- 14.2.8.4. Recent Developments
- 14.2.8.5. Financials (Based on Availability)
- 14.2.9 NaturalShrimp Inc
- 14.2.9.1. Overview
- 14.2.9.2. Products
- 14.2.9.3. SWOT Analysis
- 14.2.9.4. Recent Developments
- 14.2.9.5. Financials (Based on Availability)
- 14.2.10 Paul Piazza & Son Inc
- 14.2.10.1. Overview
- 14.2.10.2. Products
- 14.2.10.3. SWOT Analysis
- 14.2.10.4. Recent Developments
- 14.2.10.5. Financials (Based on Availability)
- 14.2.1 The American Shrimp Compan
List of Figures
- Figure 1: Global USA Shrimp Industry Revenue Breakdown (Million, %) by Region 2024 & 2032
- Figure 2: North America USA Shrimp Industry Revenue (Million), by Country 2024 & 2032
- Figure 3: North America USA Shrimp Industry Revenue Share (%), by Country 2024 & 2032
- Figure 4: North America USA Shrimp Industry Revenue (Million), by Form 2024 & 2032
- Figure 5: North America USA Shrimp Industry Revenue Share (%), by Form 2024 & 2032
- Figure 6: North America USA Shrimp Industry Revenue (Million), by Distribution Channel 2024 & 2032
- Figure 7: North America USA Shrimp Industry Revenue Share (%), by Distribution Channel 2024 & 2032
- Figure 8: North America USA Shrimp Industry Revenue (Million), by Country 2024 & 2032
- Figure 9: North America USA Shrimp Industry Revenue Share (%), by Country 2024 & 2032
- Figure 10: South America USA Shrimp Industry Revenue (Million), by Form 2024 & 2032
- Figure 11: South America USA Shrimp Industry Revenue Share (%), by Form 2024 & 2032
- Figure 12: South America USA Shrimp Industry Revenue (Million), by Distribution Channel 2024 & 2032
- Figure 13: South America USA Shrimp Industry Revenue Share (%), by Distribution Channel 2024 & 2032
- Figure 14: South America USA Shrimp Industry Revenue (Million), by Country 2024 & 2032
- Figure 15: South America USA Shrimp Industry Revenue Share (%), by Country 2024 & 2032
- Figure 16: Europe USA Shrimp Industry Revenue (Million), by Form 2024 & 2032
- Figure 17: Europe USA Shrimp Industry Revenue Share (%), by Form 2024 & 2032
- Figure 18: Europe USA Shrimp Industry Revenue (Million), by Distribution Channel 2024 & 2032
- Figure 19: Europe USA Shrimp Industry Revenue Share (%), by Distribution Channel 2024 & 2032
- Figure 20: Europe USA Shrimp Industry Revenue (Million), by Country 2024 & 2032
- Figure 21: Europe USA Shrimp Industry Revenue Share (%), by Country 2024 & 2032
- Figure 22: Middle East & Africa USA Shrimp Industry Revenue (Million), by Form 2024 & 2032
- Figure 23: Middle East & Africa USA Shrimp Industry Revenue Share (%), by Form 2024 & 2032
- Figure 24: Middle East & Africa USA Shrimp Industry Revenue (Million), by Distribution Channel 2024 & 2032
- Figure 25: Middle East & Africa USA Shrimp Industry Revenue Share (%), by Distribution Channel 2024 & 2032
- Figure 26: Middle East & Africa USA Shrimp Industry Revenue (Million), by Country 2024 & 2032
- Figure 27: Middle East & Africa USA Shrimp Industry Revenue Share (%), by Country 2024 & 2032
- Figure 28: Asia Pacific USA Shrimp Industry Revenue (Million), by Form 2024 & 2032
- Figure 29: Asia Pacific USA Shrimp Industry Revenue Share (%), by Form 2024 & 2032
- Figure 30: Asia Pacific USA Shrimp Industry Revenue (Million), by Distribution Channel 2024 & 2032
- Figure 31: Asia Pacific USA Shrimp Industry Revenue Share (%), by Distribution Channel 2024 & 2032
- Figure 32: Asia Pacific USA Shrimp Industry Revenue (Million), by Country 2024 & 2032
- Figure 33: Asia Pacific USA Shrimp Industry Revenue Share (%), by Country 2024 & 2032
List of Tables
- Table 1: Global USA Shrimp Industry Revenue Million Forecast, by Region 2019 & 2032
- Table 2: Global USA Shrimp Industry Revenue Million Forecast, by Form 2019 & 2032
- Table 3: Global USA Shrimp Industry Revenue Million Forecast, by Distribution Channel 2019 & 2032
- Table 4: Global USA Shrimp Industry Revenue Million Forecast, by Region 2019 & 2032
- Table 5: Global USA Shrimp Industry Revenue Million Forecast, by Country 2019 & 2032
- Table 6: United States USA Shrimp Industry Revenue (Million) Forecast, by Application 2019 & 2032
- Table 7: Canada USA Shrimp Industry Revenue (Million) Forecast, by Application 2019 & 2032
- Table 8: Mexico USA Shrimp Industry Revenue (Million) Forecast, by Application 2019 & 2032
- Table 9: Global USA Shrimp Industry Revenue Million Forecast, by Form 2019 & 2032
- Table 10: Global USA Shrimp Industry Revenue Million Forecast, by Distribution Channel 2019 & 2032
- Table 11: Global USA Shrimp Industry Revenue Million Forecast, by Country 2019 & 2032
- Table 12: United States USA Shrimp Industry Revenue (Million) Forecast, by Application 2019 & 2032
- Table 13: Canada USA Shrimp Industry Revenue (Million) Forecast, by Application 2019 & 2032
- Table 14: Mexico USA Shrimp Industry Revenue (Million) Forecast, by Application 2019 & 2032
- Table 15: Global USA Shrimp Industry Revenue Million Forecast, by Form 2019 & 2032
- Table 16: Global USA Shrimp Industry Revenue Million Forecast, by Distribution Channel 2019 & 2032
- Table 17: Global USA Shrimp Industry Revenue Million Forecast, by Country 2019 & 2032
- Table 18: Brazil USA Shrimp Industry Revenue (Million) Forecast, by Application 2019 & 2032
- Table 19: Argentina USA Shrimp Industry Revenue (Million) Forecast, by Application 2019 & 2032
- Table 20: Rest of South America USA Shrimp Industry Revenue (Million) Forecast, by Application 2019 & 2032
- Table 21: Global USA Shrimp Industry Revenue Million Forecast, by Form 2019 & 2032
- Table 22: Global USA Shrimp Industry Revenue Million Forecast, by Distribution Channel 2019 & 2032
- Table 23: Global USA Shrimp Industry Revenue Million Forecast, by Country 2019 & 2032
- Table 24: United Kingdom USA Shrimp Industry Revenue (Million) Forecast, by Application 2019 & 2032
- Table 25: Germany USA Shrimp Industry Revenue (Million) Forecast, by Application 2019 & 2032
- Table 26: France USA Shrimp Industry Revenue (Million) Forecast, by Application 2019 & 2032
- Table 27: Italy USA Shrimp Industry Revenue (Million) Forecast, by Application 2019 & 2032
- Table 28: Spain USA Shrimp Industry Revenue (Million) Forecast, by Application 2019 & 2032
- Table 29: Russia USA Shrimp Industry Revenue (Million) Forecast, by Application 2019 & 2032
- Table 30: Benelux USA Shrimp Industry Revenue (Million) Forecast, by Application 2019 & 2032
- Table 31: Nordics USA Shrimp Industry Revenue (Million) Forecast, by Application 2019 & 2032
- Table 32: Rest of Europe USA Shrimp Industry Revenue (Million) Forecast, by Application 2019 & 2032
- Table 33: Global USA Shrimp Industry Revenue Million Forecast, by Form 2019 & 2032
- Table 34: Global USA Shrimp Industry Revenue Million Forecast, by Distribution Channel 2019 & 2032
- Table 35: Global USA Shrimp Industry Revenue Million Forecast, by Country 2019 & 2032
- Table 36: Turkey USA Shrimp Industry Revenue (Million) Forecast, by Application 2019 & 2032
- Table 37: Israel USA Shrimp Industry Revenue (Million) Forecast, by Application 2019 & 2032
- Table 38: GCC USA Shrimp Industry Revenue (Million) Forecast, by Application 2019 & 2032
- Table 39: North Africa USA Shrimp Industry Revenue (Million) Forecast, by Application 2019 & 2032
- Table 40: South Africa USA Shrimp Industry Revenue (Million) Forecast, by Application 2019 & 2032
- Table 41: Rest of Middle East & Africa USA Shrimp Industry Revenue (Million) Forecast, by Application 2019 & 2032
- Table 42: Global USA Shrimp Industry Revenue Million Forecast, by Form 2019 & 2032
- Table 43: Global USA Shrimp Industry Revenue Million Forecast, by Distribution Channel 2019 & 2032
- Table 44: Global USA Shrimp Industry Revenue Million Forecast, by Country 2019 & 2032
- Table 45: China USA Shrimp Industry Revenue (Million) Forecast, by Application 2019 & 2032
- Table 46: India USA Shrimp Industry Revenue (Million) Forecast, by Application 2019 & 2032
- Table 47: Japan USA Shrimp Industry Revenue (Million) Forecast, by Application 2019 & 2032
- Table 48: South Korea USA Shrimp Industry Revenue (Million) Forecast, by Application 2019 & 2032
- Table 49: ASEAN USA Shrimp Industry Revenue (Million) Forecast, by Application 2019 & 2032
- Table 50: Oceania USA Shrimp Industry Revenue (Million) Forecast, by Application 2019 & 2032
- Table 51: Rest of Asia Pacific USA Shrimp Industry Revenue (Million) Forecast, by Application 2019 & 2032
Frequently Asked Questions
1. What is the projected Compound Annual Growth Rate (CAGR) of the USA Shrimp Industry?
The projected CAGR is approximately 6.04%.
2. Which companies are prominent players in the USA Shrimp Industry?
Key companies in the market include The American Shrimp Compan, Admiralty Island Fisheries Inc, Beaver Street Fisheries, Gulf Shrimp Co LLC, Pacific American Fish Company Inc, Millennium Ocean Star Corporation, Dulcich Inc, Sysco Corporation, NaturalShrimp Inc, Paul Piazza & Son Inc.
3. What are the main segments of the USA Shrimp Industry?
The market segments include Form, Distribution Channel.
4. Can you provide details about the market size?
The market size is estimated to be USD XX Million as of 2022.
5. What are some drivers contributing to market growth?
Increasing Focus on Maintaining Health and Well-Being; Launching Supplements For Specific Purposes and Targeted Population.
6. What are the notable trends driving market growth?
Increased consumer spending on seafood is boosting sales.
7. Are there any restraints impacting market growth?
Supplement Consumption and Their Side-effects; Inclination Towards Substitute Products.
8. Can you provide examples of recent developments in the market?
March 2022: Beaver Street Fisheries completed its renovation in Jacksonville for the packaging facility. This move may help the company improve its storage facilities.February 2022: NaturalShrimp announced its partnership with Jefferson County, Florida, for a new shrimp production facility property, as well as to seek USD 25 million in available grants.January 2022: NaturalShrimp, Inc. and Gulf Shrimp Company Limited has agreed to continue their partnership for live shrimp by the first shrimp-focused, commercially operational RAS (Recirculating Aquaculture System) developed and patented by NaturalShrimp Inc.
9. What pricing options are available for accessing the report?
Pricing options include single-user, multi-user, and enterprise licenses priced at USD 3800, USD 4500, and USD 5800 respectively.
10. Is the market size provided in terms of value or volume?
The market size is provided in terms of value, measured in Million.
11. Are there any specific market keywords associated with the report?
Yes, the market keyword associated with the report is "USA Shrimp Industry," which aids in identifying and referencing the specific market segment covered.
12. How do I determine which pricing option suits my needs best?
The pricing options vary based on user requirements and access needs. Individual users may opt for single-user licenses, while businesses requiring broader access may choose multi-user or enterprise licenses for cost-effective access to the report.
13. Are there any additional resources or data provided in the USA Shrimp Industry report?
While the report offers comprehensive insights, it's advisable to review the specific contents or supplementary materials provided to ascertain if additional resources or data are available.
14. How can I stay updated on further developments or reports in the USA Shrimp Industry?
To stay informed about further developments, trends, and reports in the USA Shrimp Industry, consider subscribing to industry newsletters, following relevant companies and organizations, or regularly checking reputable industry news sources and publications.
Methodology
Step 1 - Identification of Relevant Samples Size from Population Database


Step 2 - Approaches for Defining Global Market Size (Value, Volume* & Price*)

Note*: In applicable scenarios
Step 3 - Data Sources
Primary Research
- Web Analytics
- Survey Reports
- Research Institute
- Latest Research Reports
- Opinion Leaders
Secondary Research
- Annual Reports
- White Paper
- Latest Press Release
- Industry Association
- Paid Database
- Investor Presentations

Step 4 - Data Triangulation
Involves using different sources of information in order to increase the validity of a study
These sources are likely to be stakeholders in a program - participants, other researchers, program staff, other community members, and so on.
Then we put all data in single framework & apply various statistical tools to find out the dynamic on the market.
During the analysis stage, feedback from the stakeholder groups would be compared to determine areas of agreement as well as areas of divergence


