

Key Insights
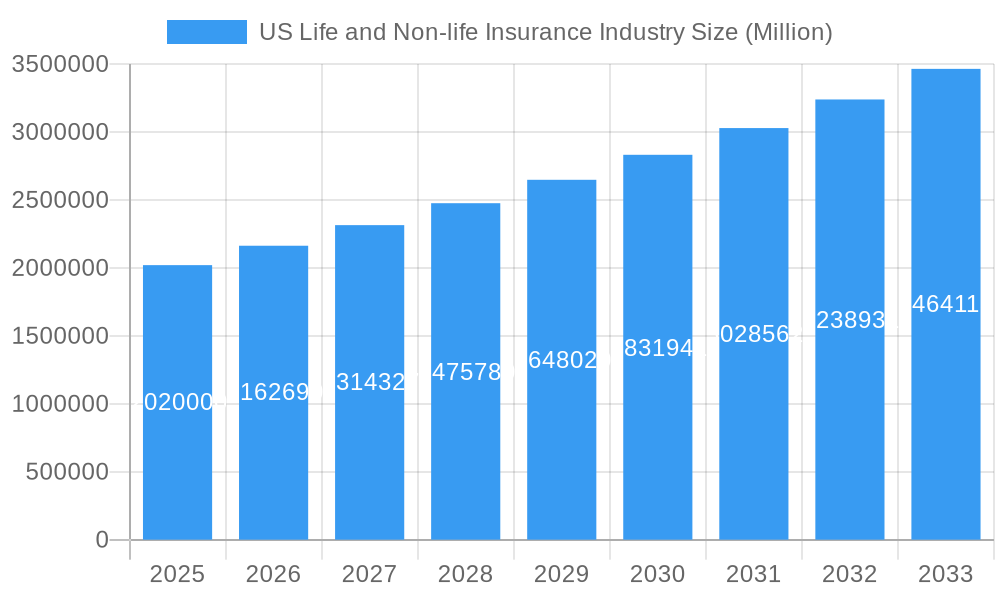
The US life and non-life insurance industry, valued at $2.02 trillion in 2025, is projected to experience robust growth, driven by several key factors. The aging population, increasing health concerns, and rising awareness of the need for financial security are fueling demand for life insurance products. Simultaneously, the increasing frequency and severity of natural disasters and cyber threats are driving demand for non-life insurance, particularly property and casualty coverage. Government regulations aimed at enhancing consumer protection and market stability contribute to the industry's growth, while economic fluctuations and competition among established players and insurtech startups present challenges. The market segmentation reflects this diversity, encompassing individual and group life insurance, health insurance (including Medicare and Medicaid related), property and casualty insurance (auto, home, commercial), and other specialized lines. Major players like Massachusetts Mutual Life Insurance Company, UnitedHealth Group, and Berkshire Hathaway leverage their established networks and financial strength to maintain market leadership. However, innovative insurtech companies are disrupting the market with digitally-driven solutions and personalized offerings.
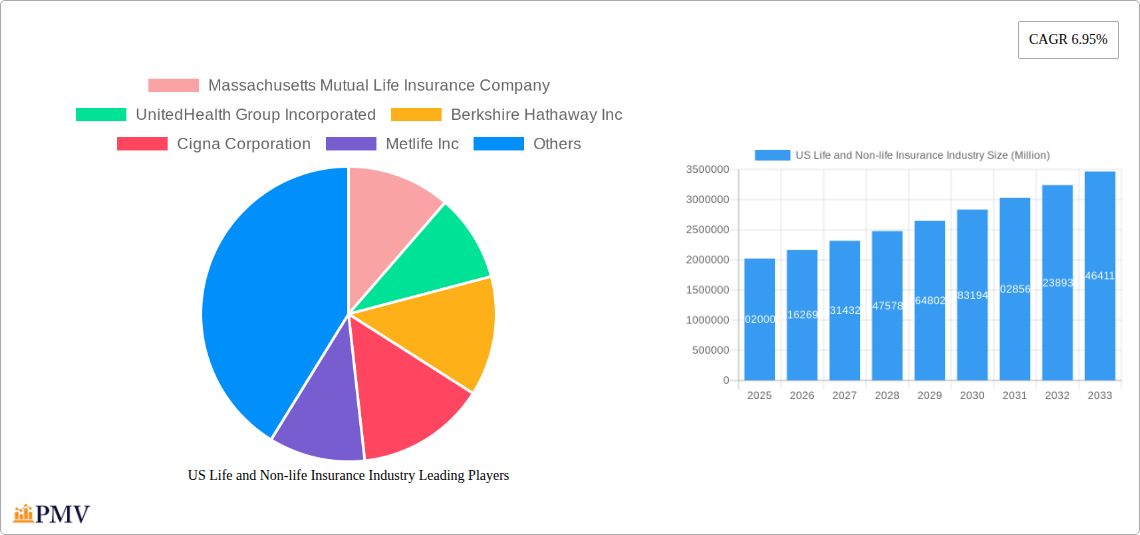
US Life and Non-life Insurance Industry Market Size (In Million)
Looking forward, the projected CAGR of 6.95% suggests consistent expansion through 2033. Several trends are shaping the industry's future. The rise of telematics and data analytics is improving risk assessment and leading to more personalized pricing. The increasing adoption of digital distribution channels, including online platforms and mobile apps, is enhancing accessibility and convenience. Regulatory changes, particularly regarding data privacy and cybersecurity, will significantly influence industry practices. Despite these positive trends, factors such as economic downturns, inflation, and evolving consumer preferences present ongoing challenges. Maintaining a competitive edge requires continuous innovation, strategic partnerships, and a strong focus on customer experience. The industry must adapt to shifting consumer demands and leverage emerging technologies to stay relevant in a dynamic market landscape.
US Life and Non-life Insurance Industry Company Market Share
US Life and Non-life Insurance Industry Report: 2019-2033
This comprehensive report provides a detailed analysis of the US Life and Non-life Insurance industry, covering market structure, competitive dynamics, growth trends, and future outlook from 2019 to 2033. The study period encompasses the historical period (2019-2024), the base year (2025), and the forecast period (2025-2033). This report is essential for industry professionals, investors, and strategic decision-makers seeking to navigate this dynamic market. The report utilizes USD Million for all financial values.
US Life and Non-life Insurance Industry Market Structure & Competitive Dynamics
The US life and non-life insurance market is characterized by a moderately concentrated structure, with several large players commanding significant market share. The top ten companies, including Massachusetts Mutual Life Insurance Company, UnitedHealth Group Incorporated, Berkshire Hathaway Inc, Cigna Corporation, Metlife Inc, Prudential Financial Inc, Aetna Inc, Centene Corporation, American International Group Inc, and State Farm (list not exhaustive), account for a significant portion of the overall market. However, the market also accommodates numerous smaller, specialized insurers. Innovation ecosystems are largely driven by technological advancements in data analytics, AI, and digital distribution channels. Regulatory frameworks, including those set by state insurance departments and federal agencies, play a crucial role in shaping market conduct and competition. Product substitutes, such as self-insurance and alternative risk financing mechanisms, exert some competitive pressure. End-user trends, particularly a growing demand for personalized insurance products and digital services, are driving market evolution. M&A activity has been relatively robust in recent years, with deal values ranging from tens to hundreds of millions of USD. For example, in 202x, [Company A] acquired [Company B] for xx Million USD, reshaping market dynamics within the [specific segment] sector. Market concentration is estimated at xx% in 2025, with a projected increase to xx% by 2033.
US Life and Non-life Insurance Industry Industry Trends & Insights
The US life and non-life insurance industry is experiencing substantial transformation, fueled by several key trends. Market growth is driven by factors such as increasing health consciousness, rising disposable incomes, and expanding coverage mandates. Technological disruptions, particularly the adoption of Insurtech solutions, are revolutionizing insurance distribution, underwriting, and claims processing. Consumers increasingly prefer personalized products, digital channels, and seamless customer experiences. This shift is intensifying competition and necessitating insurers to adapt to the evolving consumer landscape. The compound annual growth rate (CAGR) for the overall market is projected to be xx% during the forecast period (2025-2033). Market penetration varies significantly across different segments, with xx% saturation in [segment A] and xx% in [segment B] in 2025. The increasing adoption of telematics in auto insurance and the rise of AI-powered risk assessment tools are further shaping market dynamics. The evolving regulatory landscape, including stricter data privacy regulations and increased scrutiny of pricing practices, also presents both challenges and opportunities.
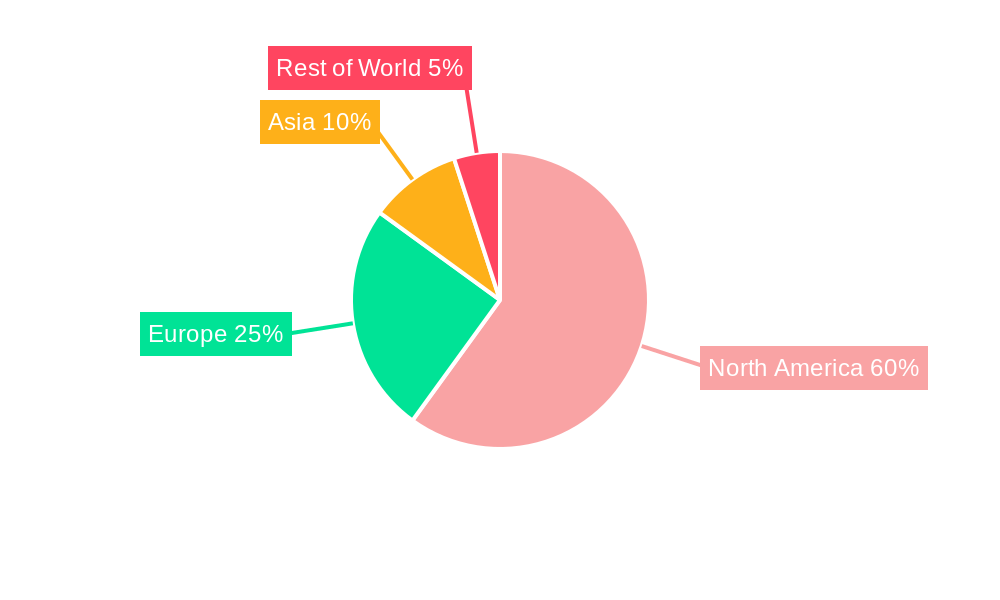
Dominant Markets & Segments in US Life and Non-life Insurance Industry
The US life and non-life insurance market exhibits regional variations in growth and penetration rates. The [Specific Region, e.g., Northeast] is currently the leading market, driven by factors such as higher per capita income, a dense population, and a well-established infrastructure.
- Key Drivers of Dominance:
- High per capita income and disposable income.
- Dense population and high concentration of businesses.
- Robust healthcare infrastructure supporting health insurance demand.
- Favorable regulatory environment fostering market growth.
- Established financial markets and investor confidence.
The dominance of the [Specific Region] is expected to continue throughout the forecast period, although other regions are expected to show growth, particularly driven by population increases and economic expansion. The health insurance segment holds the largest market share, with substantial growth driven by factors such as the Affordable Care Act (ACA) and the aging population.
US Life and Non-life Insurance Industry Product Innovations
Recent innovations focus on leveraging technology to enhance customer experience and improve efficiency. This includes the development of personalized insurance plans, AI-powered chatbots for customer service, and telematics-based usage-based insurance (UBI) programs for auto insurance. These innovations offer competitive advantages by improving risk assessment, reducing costs, and increasing customer satisfaction. The integration of blockchain technology for secure and transparent transactions is another emerging trend with significant potential.
Report Segmentation & Scope
This report segments the US Life and Non-life Insurance industry based on various factors including product type (life insurance, health insurance, property & casualty insurance, etc.), distribution channel (online, agents, brokers), and customer segment (individuals, businesses, etc.). Growth projections vary across segments, reflecting differing market dynamics and growth drivers. The competitive landscape is also unique to each segment, with varying levels of concentration and intensity of competition. For instance, the health insurance segment is expected to experience a CAGR of xx% driven by increasing health awareness and government initiatives, while the property & casualty insurance segment might see a xx% CAGR driven by growth in the construction sector and increased property values. Market sizes for each segment are estimated using 2025 as the base year.
Key Drivers of US Life and Non-life Insurance Industry Growth
Several factors are driving the growth of the US Life and Non-life Insurance industry. Technological advancements in data analytics, AI, and digital technologies are improving efficiency, enhancing customer experiences, and enabling the development of innovative products. Economic growth, coupled with rising disposable incomes, is increasing insurance affordability and demand. Favorable regulatory environments that encourage innovation and competition are supporting market expansion. The aging population is contributing to a rising demand for health insurance and retirement planning products. Finally, increasing awareness of the importance of insurance for risk mitigation is also playing a role in growth.
Challenges in the US Life and Non-life Insurance Industry Sector
The industry faces challenges, including increasing regulatory scrutiny, particularly regarding pricing and data privacy. Supply chain disruptions can impact operational efficiency, and intense competition necessitates continuous innovation and cost optimization. The rise of Insurtech companies and their innovative offerings present considerable competitive pressure. These challenges, while significant, also present opportunities for proactive insurers to differentiate themselves and capitalize on market trends. The increasing cost of healthcare significantly impacts the health insurance segment. The estimated financial impact of these challenges is an estimated loss of xx Million USD annually in 2025.
Leading Players in the US Life and Non-life Insurance Industry Market
Key Developments in US Life and Non-life Insurance Industry Sector
- 2022: UnitedHealth Group invested USD 100 Million in health worker diversity initiatives, aiming to improve healthcare access, affordability, and outcomes.
- 2021: Cigna launched its Cigna ID card, offering clients anytime, anywhere access to in-network doctors, care information, and cost estimates.
These developments highlight the industry's focus on leveraging technology, improving accessibility, and addressing social determinants of health.
Strategic US Life and Non-life Insurance Industry Market Outlook
The US Life and Non-life Insurance market exhibits significant growth potential in the coming years, driven by technological advancements, changing consumer preferences, and evolving regulatory landscapes. Strategic opportunities exist for insurers to leverage data analytics for personalized product offerings, to embrace digital distribution channels to expand reach, and to invest in innovative technologies like AI and blockchain. By adapting to evolving consumer needs and addressing societal challenges, the industry can capture significant market share and drive long-term growth. Strategic partnerships with Insurtech companies could prove to be particularly beneficial in the years to come.
US Life and Non-life Insurance Industry Segmentation
-
1. Insurance type
-
1.1. Life Insurance
- 1.1.1. Individual
- 1.1.2. Group
-
1.2. Non-life Insurance
- 1.2.1. Home
- 1.2.2. Motor
- 1.2.3. Other Non-life Insurances
-
1.1. Life Insurance
-
2. Distribution Channel
- 2.1. Direct
- 2.2. Agency
- 2.3. Banks
- 2.4. Other Distribution Channels
US Life and Non-life Insurance Industry Segmentation By Geography
-
1. North America
- 1.1. United States
- 1.2. Canada
- 1.3. Mexico
-
2. South America
- 2.1. Brazil
- 2.2. Argentina
- 2.3. Rest of South America
-
3. Europe
- 3.1. United Kingdom
- 3.2. Germany
- 3.3. France
- 3.4. Italy
- 3.5. Spain
- 3.6. Russia
- 3.7. Benelux
- 3.8. Nordics
- 3.9. Rest of Europe
-
4. Middle East & Africa
- 4.1. Turkey
- 4.2. Israel
- 4.3. GCC
- 4.4. North Africa
- 4.5. South Africa
- 4.6. Rest of Middle East & Africa
-
5. Asia Pacific
- 5.1. China
- 5.2. India
- 5.3. Japan
- 5.4. South Korea
- 5.5. ASEAN
- 5.6. Oceania
- 5.7. Rest of Asia Pacific
US Life and Non-life Insurance Industry Regional Market Share
Geographic Coverage of US Life and Non-life Insurance Industry
US Life and Non-life Insurance Industry REPORT HIGHLIGHTS
| Aspects | Details |
|---|---|
| Study Period | 2020-2034 |
| Base Year | 2025 |
| Estimated Year | 2026 |
| Forecast Period | 2026-2034 |
| Historical Period | 2020-2025 |
| Growth Rate | CAGR of 6.95% from 2020-2034 |
| Segmentation |
|
Table of Contents
- 1. Introduction
- 1.1. Research Scope
- 1.2. Market Segmentation
- 1.3. Research Objective
- 1.4. Definitions and Assumptions
- 2. Executive Summary
- 2.1. Market Snapshot
- 3. Market Dynamics
- 3.1. Market Drivers
- 3.2. Market Restrains
- 3.3. Market Trends
- 3.4. Market Opportunities
- 4. Market Factor Analysis
- 4.1. Porters Five Forces
- 4.1.1. Bargaining Power of Suppliers
- 4.1.2. Bargaining Power of Buyers
- 4.1.3. Threat of New Entrants
- 4.1.4. Threat of Substitutes
- 4.1.5. Competitive Rivalry
- 4.2. PESTEL analysis
- 4.3. BCG Analysis
- 4.3.1. Stars (High Growth, High Market Share)
- 4.3.2. Cash Cows (Low Growth, High Market Share)
- 4.3.3. Question Mark (High Growth, Low Market Share)
- 4.3.4. Dogs (Low Growth, Low Market Share)
- 4.4. Ansoff Matrix Analysis
- 4.5. Supply Chain Analysis
- 4.6. Regulatory Landscape
- 4.7. Current Market Potential and Opportunity Assessment (TAM–SAM–SOM Framework)
- 4.8. PMV Analyst Note
- 4.1. Porters Five Forces
- 5. Market Analysis, Insights and Forecast 2021-2033
- 5.1. Market Analysis, Insights and Forecast - by Insurance type
- 5.1.1. Life Insurance
- 5.1.1.1. Individual
- 5.1.1.2. Group
- 5.1.2. Non-life Insurance
- 5.1.2.1. Home
- 5.1.2.2. Motor
- 5.1.2.3. Other Non-life Insurances
- 5.1.1. Life Insurance
- 5.2. Market Analysis, Insights and Forecast - by Distribution Channel
- 5.2.1. Direct
- 5.2.2. Agency
- 5.2.3. Banks
- 5.2.4. Other Distribution Channels
- 5.3. Market Analysis, Insights and Forecast - by Region
- 5.3.1. North America
- 5.3.2. South America
- 5.3.3. Europe
- 5.3.4. Middle East & Africa
- 5.3.5. Asia Pacific
- 5.1. Market Analysis, Insights and Forecast - by Insurance type
- 6. Global US Life and Non-life Insurance Industry Analysis, Insights and Forecast, 2021-2033
- 6.1. Market Analysis, Insights and Forecast - by Insurance type
- 6.1.1. Life Insurance
- 6.1.1.1. Individual
- 6.1.1.2. Group
- 6.1.2. Non-life Insurance
- 6.1.2.1. Home
- 6.1.2.2. Motor
- 6.1.2.3. Other Non-life Insurances
- 6.1.1. Life Insurance
- 6.2. Market Analysis, Insights and Forecast - by Distribution Channel
- 6.2.1. Direct
- 6.2.2. Agency
- 6.2.3. Banks
- 6.2.4. Other Distribution Channels
- 6.1. Market Analysis, Insights and Forecast - by Insurance type
- 7. North America US Life and Non-life Insurance Industry Analysis, Insights and Forecast, 2020-2032
- 7.1. Market Analysis, Insights and Forecast - by Insurance type
- 7.1.1. Life Insurance
- 7.1.1.1. Individual
- 7.1.1.2. Group
- 7.1.2. Non-life Insurance
- 7.1.2.1. Home
- 7.1.2.2. Motor
- 7.1.2.3. Other Non-life Insurances
- 7.1.1. Life Insurance
- 7.2. Market Analysis, Insights and Forecast - by Distribution Channel
- 7.2.1. Direct
- 7.2.2. Agency
- 7.2.3. Banks
- 7.2.4. Other Distribution Channels
- 7.1. Market Analysis, Insights and Forecast - by Insurance type
- 8. South America US Life and Non-life Insurance Industry Analysis, Insights and Forecast, 2020-2032
- 8.1. Market Analysis, Insights and Forecast - by Insurance type
- 8.1.1. Life Insurance
- 8.1.1.1. Individual
- 8.1.1.2. Group
- 8.1.2. Non-life Insurance
- 8.1.2.1. Home
- 8.1.2.2. Motor
- 8.1.2.3. Other Non-life Insurances
- 8.1.1. Life Insurance
- 8.2. Market Analysis, Insights and Forecast - by Distribution Channel
- 8.2.1. Direct
- 8.2.2. Agency
- 8.2.3. Banks
- 8.2.4. Other Distribution Channels
- 8.1. Market Analysis, Insights and Forecast - by Insurance type
- 9. Europe US Life and Non-life Insurance Industry Analysis, Insights and Forecast, 2020-2032
- 9.1. Market Analysis, Insights and Forecast - by Insurance type
- 9.1.1. Life Insurance
- 9.1.1.1. Individual
- 9.1.1.2. Group
- 9.1.2. Non-life Insurance
- 9.1.2.1. Home
- 9.1.2.2. Motor
- 9.1.2.3. Other Non-life Insurances
- 9.1.1. Life Insurance
- 9.2. Market Analysis, Insights and Forecast - by Distribution Channel
- 9.2.1. Direct
- 9.2.2. Agency
- 9.2.3. Banks
- 9.2.4. Other Distribution Channels
- 9.1. Market Analysis, Insights and Forecast - by Insurance type
- 10. Middle East & Africa US Life and Non-life Insurance Industry Analysis, Insights and Forecast, 2020-2032
- 10.1. Market Analysis, Insights and Forecast - by Insurance type
- 10.1.1. Life Insurance
- 10.1.1.1. Individual
- 10.1.1.2. Group
- 10.1.2. Non-life Insurance
- 10.1.2.1. Home
- 10.1.2.2. Motor
- 10.1.2.3. Other Non-life Insurances
- 10.1.1. Life Insurance
- 10.2. Market Analysis, Insights and Forecast - by Distribution Channel
- 10.2.1. Direct
- 10.2.2. Agency
- 10.2.3. Banks
- 10.2.4. Other Distribution Channels
- 10.1. Market Analysis, Insights and Forecast - by Insurance type
- 11. Asia Pacific US Life and Non-life Insurance Industry Analysis, Insights and Forecast, 2020-2032
- 11.1. Market Analysis, Insights and Forecast - by Insurance type
- 11.1.1. Life Insurance
- 11.1.1.1. Individual
- 11.1.1.2. Group
- 11.1.2. Non-life Insurance
- 11.1.2.1. Home
- 11.1.2.2. Motor
- 11.1.2.3. Other Non-life Insurances
- 11.1.1. Life Insurance
- 11.2. Market Analysis, Insights and Forecast - by Distribution Channel
- 11.2.1. Direct
- 11.2.2. Agency
- 11.2.3. Banks
- 11.2.4. Other Distribution Channels
- 11.1. Market Analysis, Insights and Forecast - by Insurance type
- 12. Competitive Analysis
- 12.1. Company Profiles
- 12.1.1 Massachusetts Mutual Life Insurance Company
- 12.1.1.1. Company Overview
- 12.1.1.2. Products
- 12.1.1.3. Company Financials
- 12.1.1.4. SWOT Analysis
- 12.1.2 UnitedHealth Group Incorporated
- 12.1.2.1. Company Overview
- 12.1.2.2. Products
- 12.1.2.3. Company Financials
- 12.1.2.4. SWOT Analysis
- 12.1.3 Berkshire Hathaway Inc
- 12.1.3.1. Company Overview
- 12.1.3.2. Products
- 12.1.3.3. Company Financials
- 12.1.3.4. SWOT Analysis
- 12.1.4 Cigna Corporation
- 12.1.4.1. Company Overview
- 12.1.4.2. Products
- 12.1.4.3. Company Financials
- 12.1.4.4. SWOT Analysis
- 12.1.5 Metlife Inc
- 12.1.5.1. Company Overview
- 12.1.5.2. Products
- 12.1.5.3. Company Financials
- 12.1.5.4. SWOT Analysis
- 12.1.6 Prudential Financial Inc
- 12.1.6.1. Company Overview
- 12.1.6.2. Products
- 12.1.6.3. Company Financials
- 12.1.6.4. SWOT Analysis
- 12.1.7 Aetna Inc
- 12.1.7.1. Company Overview
- 12.1.7.2. Products
- 12.1.7.3. Company Financials
- 12.1.7.4. SWOT Analysis
- 12.1.8 Centene Corporation
- 12.1.8.1. Company Overview
- 12.1.8.2. Products
- 12.1.8.3. Company Financials
- 12.1.8.4. SWOT Analysis
- 12.1.9 American International Group Inc
- 12.1.9.1. Company Overview
- 12.1.9.2. Products
- 12.1.9.3. Company Financials
- 12.1.9.4. SWOT Analysis
- 12.1.10 State Farm**List Not Exhaustive
- 12.1.10.1. Company Overview
- 12.1.10.2. Products
- 12.1.10.3. Company Financials
- 12.1.10.4. SWOT Analysis
- 12.1.1 Massachusetts Mutual Life Insurance Company
- 12.2. Market Entropy
- 12.2.1 Company's Key Areas Served
- 12.2.2 Recent Developments
- 12.3. Company Market Share Analysis 2025
- 12.3.1 Top 5 Companies Market Share Analysis
- 12.3.2 Top 3 Companies Market Share Analysis
- 12.4. List of Potential Customers
- 13. Research Methodology
List of Figures
- Figure 1: Global US Life and Non-life Insurance Industry Revenue Breakdown (Million, %) by Region 2025 & 2033
- Figure 2: Global US Life and Non-life Insurance Industry Volume Breakdown (Trillion, %) by Region 2025 & 2033
- Figure 3: North America US Life and Non-life Insurance Industry Revenue (Million), by Insurance type 2025 & 2033
- Figure 4: North America US Life and Non-life Insurance Industry Volume (Trillion), by Insurance type 2025 & 2033
- Figure 5: North America US Life and Non-life Insurance Industry Revenue Share (%), by Insurance type 2025 & 2033
- Figure 6: North America US Life and Non-life Insurance Industry Volume Share (%), by Insurance type 2025 & 2033
- Figure 7: North America US Life and Non-life Insurance Industry Revenue (Million), by Distribution Channel 2025 & 2033
- Figure 8: North America US Life and Non-life Insurance Industry Volume (Trillion), by Distribution Channel 2025 & 2033
- Figure 9: North America US Life and Non-life Insurance Industry Revenue Share (%), by Distribution Channel 2025 & 2033
- Figure 10: North America US Life and Non-life Insurance Industry Volume Share (%), by Distribution Channel 2025 & 2033
- Figure 11: North America US Life and Non-life Insurance Industry Revenue (Million), by Country 2025 & 2033
- Figure 12: North America US Life and Non-life Insurance Industry Volume (Trillion), by Country 2025 & 2033
- Figure 13: North America US Life and Non-life Insurance Industry Revenue Share (%), by Country 2025 & 2033
- Figure 14: North America US Life and Non-life Insurance Industry Volume Share (%), by Country 2025 & 2033
- Figure 15: South America US Life and Non-life Insurance Industry Revenue (Million), by Insurance type 2025 & 2033
- Figure 16: South America US Life and Non-life Insurance Industry Volume (Trillion), by Insurance type 2025 & 2033
- Figure 17: South America US Life and Non-life Insurance Industry Revenue Share (%), by Insurance type 2025 & 2033
- Figure 18: South America US Life and Non-life Insurance Industry Volume Share (%), by Insurance type 2025 & 2033
- Figure 19: South America US Life and Non-life Insurance Industry Revenue (Million), by Distribution Channel 2025 & 2033
- Figure 20: South America US Life and Non-life Insurance Industry Volume (Trillion), by Distribution Channel 2025 & 2033
- Figure 21: South America US Life and Non-life Insurance Industry Revenue Share (%), by Distribution Channel 2025 & 2033
- Figure 22: South America US Life and Non-life Insurance Industry Volume Share (%), by Distribution Channel 2025 & 2033
- Figure 23: South America US Life and Non-life Insurance Industry Revenue (Million), by Country 2025 & 2033
- Figure 24: South America US Life and Non-life Insurance Industry Volume (Trillion), by Country 2025 & 2033
- Figure 25: South America US Life and Non-life Insurance Industry Revenue Share (%), by Country 2025 & 2033
- Figure 26: South America US Life and Non-life Insurance Industry Volume Share (%), by Country 2025 & 2033
- Figure 27: Europe US Life and Non-life Insurance Industry Revenue (Million), by Insurance type 2025 & 2033
- Figure 28: Europe US Life and Non-life Insurance Industry Volume (Trillion), by Insurance type 2025 & 2033
- Figure 29: Europe US Life and Non-life Insurance Industry Revenue Share (%), by Insurance type 2025 & 2033
- Figure 30: Europe US Life and Non-life Insurance Industry Volume Share (%), by Insurance type 2025 & 2033
- Figure 31: Europe US Life and Non-life Insurance Industry Revenue (Million), by Distribution Channel 2025 & 2033
- Figure 32: Europe US Life and Non-life Insurance Industry Volume (Trillion), by Distribution Channel 2025 & 2033
- Figure 33: Europe US Life and Non-life Insurance Industry Revenue Share (%), by Distribution Channel 2025 & 2033
- Figure 34: Europe US Life and Non-life Insurance Industry Volume Share (%), by Distribution Channel 2025 & 2033
- Figure 35: Europe US Life and Non-life Insurance Industry Revenue (Million), by Country 2025 & 2033
- Figure 36: Europe US Life and Non-life Insurance Industry Volume (Trillion), by Country 2025 & 2033
- Figure 37: Europe US Life and Non-life Insurance Industry Revenue Share (%), by Country 2025 & 2033
- Figure 38: Europe US Life and Non-life Insurance Industry Volume Share (%), by Country 2025 & 2033
- Figure 39: Middle East & Africa US Life and Non-life Insurance Industry Revenue (Million), by Insurance type 2025 & 2033
- Figure 40: Middle East & Africa US Life and Non-life Insurance Industry Volume (Trillion), by Insurance type 2025 & 2033
- Figure 41: Middle East & Africa US Life and Non-life Insurance Industry Revenue Share (%), by Insurance type 2025 & 2033
- Figure 42: Middle East & Africa US Life and Non-life Insurance Industry Volume Share (%), by Insurance type 2025 & 2033
- Figure 43: Middle East & Africa US Life and Non-life Insurance Industry Revenue (Million), by Distribution Channel 2025 & 2033
- Figure 44: Middle East & Africa US Life and Non-life Insurance Industry Volume (Trillion), by Distribution Channel 2025 & 2033
- Figure 45: Middle East & Africa US Life and Non-life Insurance Industry Revenue Share (%), by Distribution Channel 2025 & 2033
- Figure 46: Middle East & Africa US Life and Non-life Insurance Industry Volume Share (%), by Distribution Channel 2025 & 2033
- Figure 47: Middle East & Africa US Life and Non-life Insurance Industry Revenue (Million), by Country 2025 & 2033
- Figure 48: Middle East & Africa US Life and Non-life Insurance Industry Volume (Trillion), by Country 2025 & 2033
- Figure 49: Middle East & Africa US Life and Non-life Insurance Industry Revenue Share (%), by Country 2025 & 2033
- Figure 50: Middle East & Africa US Life and Non-life Insurance Industry Volume Share (%), by Country 2025 & 2033
- Figure 51: Asia Pacific US Life and Non-life Insurance Industry Revenue (Million), by Insurance type 2025 & 2033
- Figure 52: Asia Pacific US Life and Non-life Insurance Industry Volume (Trillion), by Insurance type 2025 & 2033
- Figure 53: Asia Pacific US Life and Non-life Insurance Industry Revenue Share (%), by Insurance type 2025 & 2033
- Figure 54: Asia Pacific US Life and Non-life Insurance Industry Volume Share (%), by Insurance type 2025 & 2033
- Figure 55: Asia Pacific US Life and Non-life Insurance Industry Revenue (Million), by Distribution Channel 2025 & 2033
- Figure 56: Asia Pacific US Life and Non-life Insurance Industry Volume (Trillion), by Distribution Channel 2025 & 2033
- Figure 57: Asia Pacific US Life and Non-life Insurance Industry Revenue Share (%), by Distribution Channel 2025 & 2033
- Figure 58: Asia Pacific US Life and Non-life Insurance Industry Volume Share (%), by Distribution Channel 2025 & 2033
- Figure 59: Asia Pacific US Life and Non-life Insurance Industry Revenue (Million), by Country 2025 & 2033
- Figure 60: Asia Pacific US Life and Non-life Insurance Industry Volume (Trillion), by Country 2025 & 2033
- Figure 61: Asia Pacific US Life and Non-life Insurance Industry Revenue Share (%), by Country 2025 & 2033
- Figure 62: Asia Pacific US Life and Non-life Insurance Industry Volume Share (%), by Country 2025 & 2033
List of Tables
- Table 1: Global US Life and Non-life Insurance Industry Revenue Million Forecast, by Insurance type 2020 & 2033
- Table 2: Global US Life and Non-life Insurance Industry Volume Trillion Forecast, by Insurance type 2020 & 2033
- Table 3: Global US Life and Non-life Insurance Industry Revenue Million Forecast, by Distribution Channel 2020 & 2033
- Table 4: Global US Life and Non-life Insurance Industry Volume Trillion Forecast, by Distribution Channel 2020 & 2033
- Table 5: Global US Life and Non-life Insurance Industry Revenue Million Forecast, by Region 2020 & 2033
- Table 6: Global US Life and Non-life Insurance Industry Volume Trillion Forecast, by Region 2020 & 2033
- Table 7: Global US Life and Non-life Insurance Industry Revenue Million Forecast, by Insurance type 2020 & 2033
- Table 8: Global US Life and Non-life Insurance Industry Volume Trillion Forecast, by Insurance type 2020 & 2033
- Table 9: Global US Life and Non-life Insurance Industry Revenue Million Forecast, by Distribution Channel 2020 & 2033
- Table 10: Global US Life and Non-life Insurance Industry Volume Trillion Forecast, by Distribution Channel 2020 & 2033
- Table 11: Global US Life and Non-life Insurance Industry Revenue Million Forecast, by Country 2020 & 2033
- Table 12: Global US Life and Non-life Insurance Industry Volume Trillion Forecast, by Country 2020 & 2033
- Table 13: United States US Life and Non-life Insurance Industry Revenue (Million) Forecast, by Application 2020 & 2033
- Table 14: United States US Life and Non-life Insurance Industry Volume (Trillion) Forecast, by Application 2020 & 2033
- Table 15: Canada US Life and Non-life Insurance Industry Revenue (Million) Forecast, by Application 2020 & 2033
- Table 16: Canada US Life and Non-life Insurance Industry Volume (Trillion) Forecast, by Application 2020 & 2033
- Table 17: Mexico US Life and Non-life Insurance Industry Revenue (Million) Forecast, by Application 2020 & 2033
- Table 18: Mexico US Life and Non-life Insurance Industry Volume (Trillion) Forecast, by Application 2020 & 2033
- Table 19: Global US Life and Non-life Insurance Industry Revenue Million Forecast, by Insurance type 2020 & 2033
- Table 20: Global US Life and Non-life Insurance Industry Volume Trillion Forecast, by Insurance type 2020 & 2033
- Table 21: Global US Life and Non-life Insurance Industry Revenue Million Forecast, by Distribution Channel 2020 & 2033
- Table 22: Global US Life and Non-life Insurance Industry Volume Trillion Forecast, by Distribution Channel 2020 & 2033
- Table 23: Global US Life and Non-life Insurance Industry Revenue Million Forecast, by Country 2020 & 2033
- Table 24: Global US Life and Non-life Insurance Industry Volume Trillion Forecast, by Country 2020 & 2033
- Table 25: Brazil US Life and Non-life Insurance Industry Revenue (Million) Forecast, by Application 2020 & 2033
- Table 26: Brazil US Life and Non-life Insurance Industry Volume (Trillion) Forecast, by Application 2020 & 2033
- Table 27: Argentina US Life and Non-life Insurance Industry Revenue (Million) Forecast, by Application 2020 & 2033
- Table 28: Argentina US Life and Non-life Insurance Industry Volume (Trillion) Forecast, by Application 2020 & 2033
- Table 29: Rest of South America US Life and Non-life Insurance Industry Revenue (Million) Forecast, by Application 2020 & 2033
- Table 30: Rest of South America US Life and Non-life Insurance Industry Volume (Trillion) Forecast, by Application 2020 & 2033
- Table 31: Global US Life and Non-life Insurance Industry Revenue Million Forecast, by Insurance type 2020 & 2033
- Table 32: Global US Life and Non-life Insurance Industry Volume Trillion Forecast, by Insurance type 2020 & 2033
- Table 33: Global US Life and Non-life Insurance Industry Revenue Million Forecast, by Distribution Channel 2020 & 2033
- Table 34: Global US Life and Non-life Insurance Industry Volume Trillion Forecast, by Distribution Channel 2020 & 2033
- Table 35: Global US Life and Non-life Insurance Industry Revenue Million Forecast, by Country 2020 & 2033
- Table 36: Global US Life and Non-life Insurance Industry Volume Trillion Forecast, by Country 2020 & 2033
- Table 37: United Kingdom US Life and Non-life Insurance Industry Revenue (Million) Forecast, by Application 2020 & 2033
- Table 38: United Kingdom US Life and Non-life Insurance Industry Volume (Trillion) Forecast, by Application 2020 & 2033
- Table 39: Germany US Life and Non-life Insurance Industry Revenue (Million) Forecast, by Application 2020 & 2033
- Table 40: Germany US Life and Non-life Insurance Industry Volume (Trillion) Forecast, by Application 2020 & 2033
- Table 41: France US Life and Non-life Insurance Industry Revenue (Million) Forecast, by Application 2020 & 2033
- Table 42: France US Life and Non-life Insurance Industry Volume (Trillion) Forecast, by Application 2020 & 2033
- Table 43: Italy US Life and Non-life Insurance Industry Revenue (Million) Forecast, by Application 2020 & 2033
- Table 44: Italy US Life and Non-life Insurance Industry Volume (Trillion) Forecast, by Application 2020 & 2033
- Table 45: Spain US Life and Non-life Insurance Industry Revenue (Million) Forecast, by Application 2020 & 2033
- Table 46: Spain US Life and Non-life Insurance Industry Volume (Trillion) Forecast, by Application 2020 & 2033
- Table 47: Russia US Life and Non-life Insurance Industry Revenue (Million) Forecast, by Application 2020 & 2033
- Table 48: Russia US Life and Non-life Insurance Industry Volume (Trillion) Forecast, by Application 2020 & 2033
- Table 49: Benelux US Life and Non-life Insurance Industry Revenue (Million) Forecast, by Application 2020 & 2033
- Table 50: Benelux US Life and Non-life Insurance Industry Volume (Trillion) Forecast, by Application 2020 & 2033
- Table 51: Nordics US Life and Non-life Insurance Industry Revenue (Million) Forecast, by Application 2020 & 2033
- Table 52: Nordics US Life and Non-life Insurance Industry Volume (Trillion) Forecast, by Application 2020 & 2033
- Table 53: Rest of Europe US Life and Non-life Insurance Industry Revenue (Million) Forecast, by Application 2020 & 2033
- Table 54: Rest of Europe US Life and Non-life Insurance Industry Volume (Trillion) Forecast, by Application 2020 & 2033
- Table 55: Global US Life and Non-life Insurance Industry Revenue Million Forecast, by Insurance type 2020 & 2033
- Table 56: Global US Life and Non-life Insurance Industry Volume Trillion Forecast, by Insurance type 2020 & 2033
- Table 57: Global US Life and Non-life Insurance Industry Revenue Million Forecast, by Distribution Channel 2020 & 2033
- Table 58: Global US Life and Non-life Insurance Industry Volume Trillion Forecast, by Distribution Channel 2020 & 2033
- Table 59: Global US Life and Non-life Insurance Industry Revenue Million Forecast, by Country 2020 & 2033
- Table 60: Global US Life and Non-life Insurance Industry Volume Trillion Forecast, by Country 2020 & 2033
- Table 61: Turkey US Life and Non-life Insurance Industry Revenue (Million) Forecast, by Application 2020 & 2033
- Table 62: Turkey US Life and Non-life Insurance Industry Volume (Trillion) Forecast, by Application 2020 & 2033
- Table 63: Israel US Life and Non-life Insurance Industry Revenue (Million) Forecast, by Application 2020 & 2033
- Table 64: Israel US Life and Non-life Insurance Industry Volume (Trillion) Forecast, by Application 2020 & 2033
- Table 65: GCC US Life and Non-life Insurance Industry Revenue (Million) Forecast, by Application 2020 & 2033
- Table 66: GCC US Life and Non-life Insurance Industry Volume (Trillion) Forecast, by Application 2020 & 2033
- Table 67: North Africa US Life and Non-life Insurance Industry Revenue (Million) Forecast, by Application 2020 & 2033
- Table 68: North Africa US Life and Non-life Insurance Industry Volume (Trillion) Forecast, by Application 2020 & 2033
- Table 69: South Africa US Life and Non-life Insurance Industry Revenue (Million) Forecast, by Application 2020 & 2033
- Table 70: South Africa US Life and Non-life Insurance Industry Volume (Trillion) Forecast, by Application 2020 & 2033
- Table 71: Rest of Middle East & Africa US Life and Non-life Insurance Industry Revenue (Million) Forecast, by Application 2020 & 2033
- Table 72: Rest of Middle East & Africa US Life and Non-life Insurance Industry Volume (Trillion) Forecast, by Application 2020 & 2033
- Table 73: Global US Life and Non-life Insurance Industry Revenue Million Forecast, by Insurance type 2020 & 2033
- Table 74: Global US Life and Non-life Insurance Industry Volume Trillion Forecast, by Insurance type 2020 & 2033
- Table 75: Global US Life and Non-life Insurance Industry Revenue Million Forecast, by Distribution Channel 2020 & 2033
- Table 76: Global US Life and Non-life Insurance Industry Volume Trillion Forecast, by Distribution Channel 2020 & 2033
- Table 77: Global US Life and Non-life Insurance Industry Revenue Million Forecast, by Country 2020 & 2033
- Table 78: Global US Life and Non-life Insurance Industry Volume Trillion Forecast, by Country 2020 & 2033
- Table 79: China US Life and Non-life Insurance Industry Revenue (Million) Forecast, by Application 2020 & 2033
- Table 80: China US Life and Non-life Insurance Industry Volume (Trillion) Forecast, by Application 2020 & 2033
- Table 81: India US Life and Non-life Insurance Industry Revenue (Million) Forecast, by Application 2020 & 2033
- Table 82: India US Life and Non-life Insurance Industry Volume (Trillion) Forecast, by Application 2020 & 2033
- Table 83: Japan US Life and Non-life Insurance Industry Revenue (Million) Forecast, by Application 2020 & 2033
- Table 84: Japan US Life and Non-life Insurance Industry Volume (Trillion) Forecast, by Application 2020 & 2033
- Table 85: South Korea US Life and Non-life Insurance Industry Revenue (Million) Forecast, by Application 2020 & 2033
- Table 86: South Korea US Life and Non-life Insurance Industry Volume (Trillion) Forecast, by Application 2020 & 2033
- Table 87: ASEAN US Life and Non-life Insurance Industry Revenue (Million) Forecast, by Application 2020 & 2033
- Table 88: ASEAN US Life and Non-life Insurance Industry Volume (Trillion) Forecast, by Application 2020 & 2033
- Table 89: Oceania US Life and Non-life Insurance Industry Revenue (Million) Forecast, by Application 2020 & 2033
- Table 90: Oceania US Life and Non-life Insurance Industry Volume (Trillion) Forecast, by Application 2020 & 2033
- Table 91: Rest of Asia Pacific US Life and Non-life Insurance Industry Revenue (Million) Forecast, by Application 2020 & 2033
- Table 92: Rest of Asia Pacific US Life and Non-life Insurance Industry Volume (Trillion) Forecast, by Application 2020 & 2033
Frequently Asked Questions
1. What is the projected Compound Annual Growth Rate (CAGR) of the US Life and Non-life Insurance Industry?
The projected CAGR is approximately 6.95%.
2. Which companies are prominent players in the US Life and Non-life Insurance Industry?
Key companies in the market include Massachusetts Mutual Life Insurance Company, UnitedHealth Group Incorporated, Berkshire Hathaway Inc, Cigna Corporation, Metlife Inc, Prudential Financial Inc, Aetna Inc, Centene Corporation, American International Group Inc, State Farm**List Not Exhaustive.
3. What are the main segments of the US Life and Non-life Insurance Industry?
The market segments include Insurance type, Distribution Channel.
4. Can you provide details about the market size?
The market size is estimated to be USD 2.02 Million as of 2022.
5. What are some drivers contributing to market growth?
N/A
6. What are the notable trends driving market growth?
Growing Insurtech in the United States is Driving the Market.
7. Are there any restraints impacting market growth?
N/A
8. Can you provide examples of recent developments in the market?
In 2022, With a USD100 million investment in health worker diversity, United Health Group advanced health equity and fulfilling its objectives to increase access to care, make it more affordable, and produce better health outcomes.
9. What pricing options are available for accessing the report?
Pricing options include single-user, multi-user, and enterprise licenses priced at USD 3800, USD 4500, and USD 5800 respectively.
10. Is the market size provided in terms of value or volume?
The market size is provided in terms of value, measured in Million and volume, measured in Trillion.
11. Are there any specific market keywords associated with the report?
Yes, the market keyword associated with the report is "US Life and Non-life Insurance Industry," which aids in identifying and referencing the specific market segment covered.
12. How do I determine which pricing option suits my needs best?
The pricing options vary based on user requirements and access needs. Individual users may opt for single-user licenses, while businesses requiring broader access may choose multi-user or enterprise licenses for cost-effective access to the report.
13. Are there any additional resources or data provided in the US Life and Non-life Insurance Industry report?
While the report offers comprehensive insights, it's advisable to review the specific contents or supplementary materials provided to ascertain if additional resources or data are available.
14. How can I stay updated on further developments or reports in the US Life and Non-life Insurance Industry?
To stay informed about further developments, trends, and reports in the US Life and Non-life Insurance Industry, consider subscribing to industry newsletters, following relevant companies and organizations, or regularly checking reputable industry news sources and publications.
Methodology
Step 1 - Identification of Relevant Samples Size from Population Database


Step 2 - Approaches for Defining Global Market Size (Value, Volume* & Price*)

Note*: In applicable scenarios
Step 3 - Data Sources
Primary Research
- Web Analytics
- Survey Reports
- Research Institute
- Latest Research Reports
- Opinion Leaders
Secondary Research
- Annual Reports
- White Paper
- Latest Press Release
- Industry Association
- Paid Database
- Investor Presentations

Step 4 - Data Triangulation
Involves using different sources of information in order to increase the validity of a study
These sources are likely to be stakeholders in a program - participants, other researchers, program staff, other community members, and so on.
Then we put all data in single framework & apply various statistical tools to find out the dynamic on the market.
During the analysis stage, feedback from the stakeholder groups would be compared to determine areas of agreement as well as areas of divergence