
Key Insights
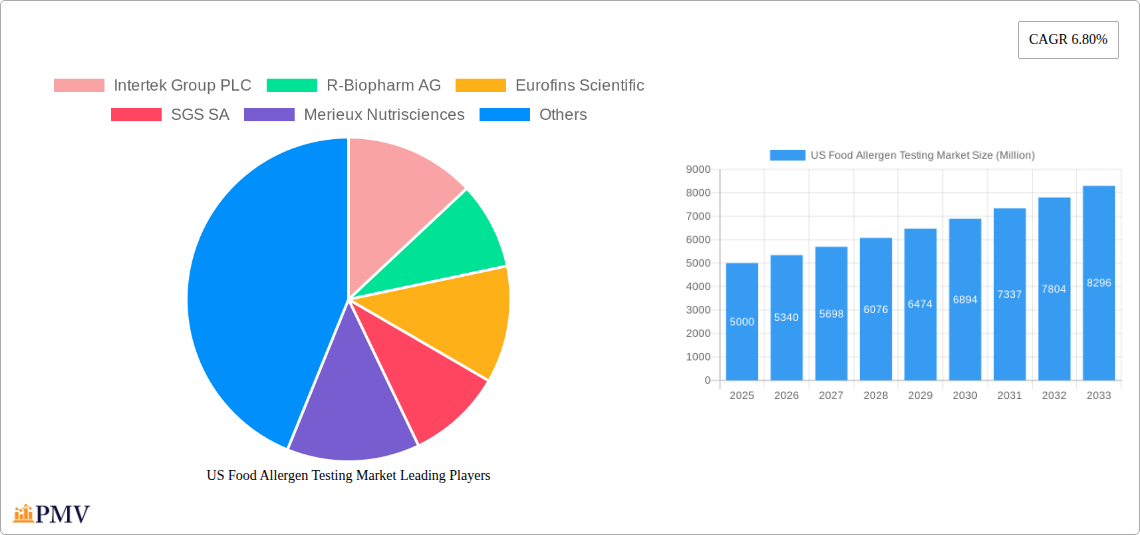
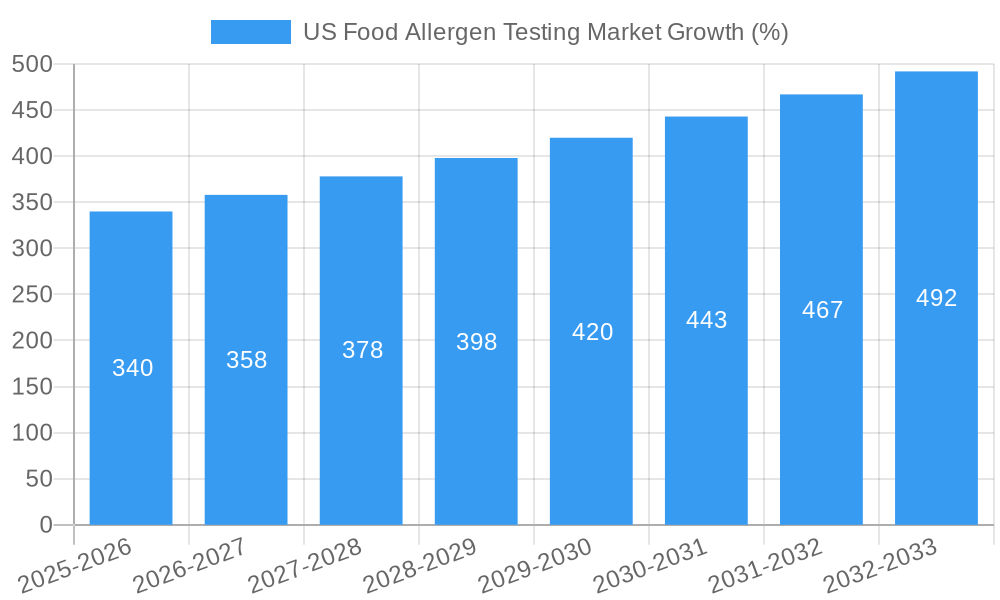
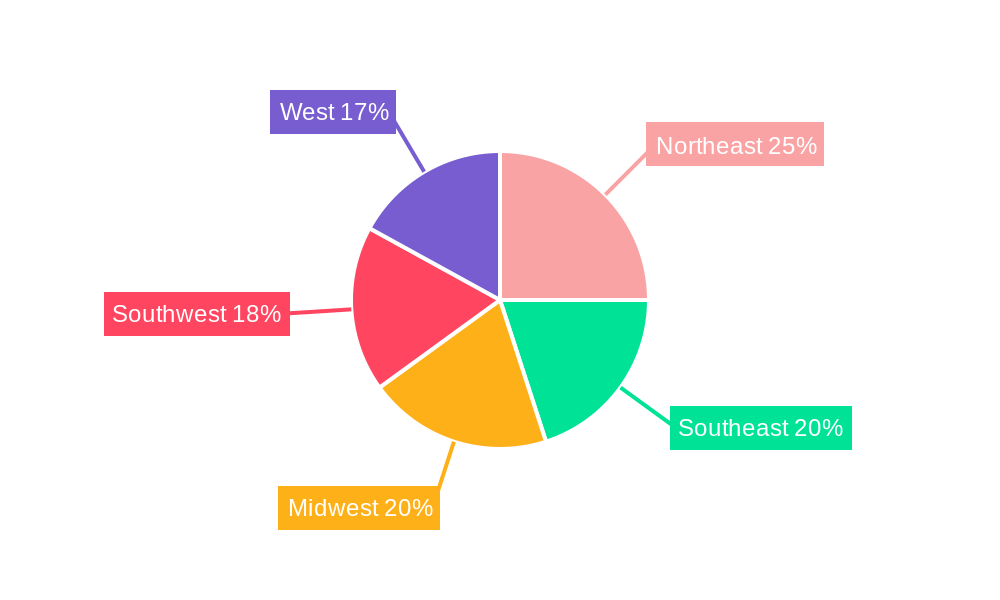
The US food allergen testing market is experiencing robust growth, driven by increasing consumer awareness of food allergies, stricter government regulations, and rising demand for safe and allergen-free food products. The market's Compound Annual Growth Rate (CAGR) of 6.80% from 2019 to 2024 suggests a significant expansion, projected to continue throughout the forecast period (2025-2033). Key segments contributing to this growth include dairy product, bakery and confectionery, meat and seafood, and baby food allergen testing. The prevalence of allergies, particularly in children, is a major driver, forcing manufacturers to implement rigorous testing protocols. Technological advancements, such as the adoption of rapid and sensitive biosensor-based and PCR technologies, are further accelerating market growth, offering faster and more accurate results. The increasing adoption of ELISA tests also continues to play a significant role, offering a balance of cost-effectiveness and reliability. Competition among major players like Intertek, Eurofins, and SGS fuels innovation and improves accessibility of testing services. Geographic distribution shows significant market penetration across all US regions, with the Northeast and West potentially exhibiting higher growth due to higher population density and greater awareness of food safety. Despite the growth, challenges remain, including the high cost of advanced testing technologies and the need for standardized testing procedures across different food categories.
The market is segmented by technology (biosensor-based, immunoassay-based/ELISA, PCR, others) and food type (dairy, bakery, meat, baby food, beverages, others). The biosensor-based segment is expected to witness considerable growth due to its speed and precision. Similarly, within food categories, increasing demand for allergen-free baby food and infant formulas is driving considerable market share for this segment. The competitive landscape comprises both large multinational corporations and specialized testing laboratories. These companies are actively engaged in strategic partnerships, acquisitions, and technological advancements to maintain their market share and offer comprehensive testing solutions catering to the diverse needs of the food industry. Future growth will be significantly influenced by evolving regulatory frameworks, the emergence of novel testing technologies, and ongoing efforts to educate consumers on food allergy management. Continued innovation in the sector is expected to push the market forward, creating opportunities for both established players and new entrants.
US Food Allergen Testing Market: A Comprehensive Report (2019-2033)
This detailed report provides a comprehensive analysis of the US Food Allergen Testing Market, offering invaluable insights for industry stakeholders, investors, and researchers. The study period spans from 2019 to 2033, with 2025 serving as the base and estimated year. The report meticulously examines market size, growth drivers, competitive dynamics, technological advancements, and future projections, offering a 360-degree view of this vital sector. The market is expected to reach xx Million by 2033, exhibiting a CAGR of xx% during the forecast period (2025-2033).
US Food Allergen Testing Market Market Structure & Competitive Dynamics
The US Food Allergen Testing market is characterized by a moderately concentrated landscape, with key players like Intertek Group PLC, R-Biopharm AG, Eurofins Scientific, SGS SA, Merieux Nutrisciences, Bureau Veritas, and TUV SUD holding significant market share. However, the market also features several smaller players and niche specialists, leading to a dynamic competitive environment. Market concentration is estimated at xx% in 2025, indicating a level of competition that is neither highly fragmented nor dominated by a few giants. Innovation is driven by advancements in testing technologies and increasing regulatory scrutiny. The regulatory framework, primarily governed by the FDA, plays a crucial role in shaping market dynamics, mandating stringent testing protocols and labeling requirements. This has fueled demand for accurate and reliable allergen testing services. Product substitutes are limited, as accurate allergen detection is critical for consumer safety and regulatory compliance. The market witnesses significant end-user trends toward proactive allergen management across the food supply chain.
Mergers and acquisitions (M&A) activities have played a significant role in market consolidation. In the period between 2019 and 2024, the total value of M&A deals in the US food allergen testing market is estimated at approximately xx Million. These acquisitions have primarily focused on expanding testing capabilities, geographic reach, and technological expertise.
- Market Concentration (2025): xx%
- Estimated M&A Deal Value (2019-2024): xx Million USD
US Food Allergen Testing Market Industry Trends & Insights
The US Food Allergen Testing market is experiencing robust growth, driven by several factors. The increasing prevalence of food allergies among consumers is a primary driver, fueling demand for accurate and reliable testing solutions. Stringent government regulations concerning food labeling and allergen management are also significantly impacting market growth. Technological advancements, particularly in areas like biosensors and PCR-based technologies, are enhancing the speed, accuracy, and efficiency of allergen testing. This has enabled faster turnaround times and more cost-effective solutions. Consumer preferences are shifting towards greater transparency and safety in food products, making allergen testing a crucial component of the food supply chain. The competitive landscape is further intensified by ongoing innovation, pricing strategies, and strategic partnerships among market players. Market penetration of advanced technologies like PCR is increasing steadily, reflecting their superior sensitivity and specificity compared to traditional methods. This leads to a higher degree of accuracy in identifying allergens. The market is projected to grow at a CAGR of xx% from 2025 to 2033.
Dominant Markets & Segments in US Food Allergen Testing Market
The US Food Allergen Testing market exhibits significant segmental variations. While the overall market is strong across the country, certain regions and food categories demonstrate higher growth.
Dominant Segments:
- Technology: Immunoassay-based/ELISA holds the largest market share in 2025 due to its established technology, relatively lower cost, and ease of use. PCR is experiencing faster growth due to its higher sensitivity and specificity, promising to gain significant market share in the forecast period.
- Food Testing: The Baby Food and Infant Formula segment dominates due to the high sensitivity of infants to allergens and stringent regulatory requirements. Dairy products and bakery and confectionery items also constitute substantial segments due to the prevalence of common allergens in these food types.
Key Drivers:
- Baby Food and Infant Formula: Stringent government regulations regarding allergen declaration and stringent consumer demand for safe products are key drivers for growth in this segment.
- Dairy Products: The widespread prevalence of dairy allergies, coupled with the growing consumer demand for allergen-free dairy options, fuels market growth.
- Economic Factors: Increased disposable incomes and higher awareness of health and safety have contributed to market growth.
US Food Allergen Testing Market Product Innovations
Recent product innovations have focused on enhancing speed, accuracy, and sensitivity of allergen detection. The integration of advanced technologies like biosensors and microfluidics into testing platforms has resulted in faster turnaround times and reduced costs. Portable and point-of-care testing devices are gaining traction due to their convenience and ability to provide rapid results. These innovations are aimed at addressing the needs of various stakeholders, from food manufacturers to regulatory agencies and consumers. The development of multiplex assays, which can simultaneously detect multiple allergens, represents a significant step forward in simplifying and streamlining the testing process.
Report Segmentation & Scope
This report segments the US Food Allergen Testing market based on technology (Biosensors-based, Immunoassay-based/ELISA, PCR, Other Technologies) and food type (Dairy Products, Bakery and Confectionery, Meat and Seafood, Baby Food and Infant Formula, Beverages, Other Processed Foods). Each segment is analyzed in detail, providing insights into its market size, growth rate, competitive landscape, and future projections. The report examines the market dynamics within each segment. For example, the Immunoassay-based/ELISA segment is expected to show a steady growth trajectory, driven by its wide adoption and cost-effectiveness. The PCR segment is poised for rapid expansion due to its improved sensitivity. Similarly, the Baby Food and Infant Formula segment is characterized by stringent regulatory standards, leading to increased demand for reliable allergen testing.
Key Drivers of US Food Allergen Testing Market Growth
Several factors drive the growth of the US Food Allergen Testing market. The rising prevalence of food allergies, coupled with increased consumer awareness and demand for allergen-free products, is a primary driver. Stringent government regulations regarding food labeling and allergen management are also contributing to market expansion. Technological advancements in testing methodologies, leading to more efficient and sensitive detection, further boost market growth. Finally, the growing emphasis on food safety and quality assurance across the food supply chain fuels the demand for reliable allergen testing services.
Challenges in the US Food Allergen Testing Market Sector
The US Food Allergen Testing market faces certain challenges. Maintaining the accuracy and reliability of testing methods amidst evolving allergen profiles is crucial. Supply chain disruptions and fluctuations in the prices of raw materials can impact testing costs and availability. The constantly evolving regulatory landscape necessitates continuous adaptation and compliance from testing providers. Competition among established players and emerging technologies adds pressure to maintain profitability and market share. These factors can impact market expansion and accessibility of advanced testing techniques.
Leading Players in the US Food Allergen Testing Market Market
- Intertek Group PLC
- R-Biopharm AG
- Eurofins Scientific
- SGS SA
- Merieux Nutrisciences
- Bureau Veritas
- TUV SUD
- List Not Exhaustive
Key Developments in US Food Allergen Testing Market Sector
- 2022-Q4: Eurofins Scientific launched a new rapid allergen testing kit for use in food production facilities.
- 2023-Q1: SGS SA acquired a smaller allergen testing company, expanding its testing capabilities.
- 2023-Q2: R-Biopharm AG announced the development of a new PCR-based allergen testing platform.
- Further details will be included in the complete report
Strategic US Food Allergen Testing Market Market Outlook
The future of the US Food Allergen Testing market looks promising. Continued advancements in testing technologies, coupled with a growing focus on food safety and regulatory compliance, will drive market growth. Emerging trends like point-of-care testing and personalized allergen management present significant opportunities for market expansion. Strategic partnerships and collaborations among industry players will further shape market dynamics. The market is expected to witness sustained growth, driven by technological innovation, increasing consumer awareness, and stringent regulatory frameworks.
US Food Allergen Testing Market Segmentation
-
1. Technology
- 1.1. Biosensors-based
- 1.2. Immunoassay-based/ELISA
- 1.3. PCR
- 1.4. Other Technologies
-
2. Food Testing
- 2.1. Dairy Products
- 2.2. Bakery and Confectionery
- 2.3. Meat and Seafood
- 2.4. Baby Food and Infant Formula
- 2.5. Beverages
- 2.6. Other Processed Foods
US Food Allergen Testing Market Segmentation By Geography
-
1. North America
- 1.1. United States
- 1.2. Canada
- 1.3. Mexico
-
2. South America
- 2.1. Brazil
- 2.2. Argentina
- 2.3. Rest of South America
-
3. Europe
- 3.1. United Kingdom
- 3.2. Germany
- 3.3. France
- 3.4. Italy
- 3.5. Spain
- 3.6. Russia
- 3.7. Benelux
- 3.8. Nordics
- 3.9. Rest of Europe
-
4. Middle East & Africa
- 4.1. Turkey
- 4.2. Israel
- 4.3. GCC
- 4.4. North Africa
- 4.5. South Africa
- 4.6. Rest of Middle East & Africa
-
5. Asia Pacific
- 5.1. China
- 5.2. India
- 5.3. Japan
- 5.4. South Korea
- 5.5. ASEAN
- 5.6. Oceania
- 5.7. Rest of Asia Pacific
US Food Allergen Testing Market REPORT HIGHLIGHTS
| Aspects | Details |
|---|---|
| Study Period | 2019-2033 |
| Base Year | 2024 |
| Estimated Year | 2025 |
| Forecast Period | 2025-2033 |
| Historical Period | 2019-2024 |
| Growth Rate | CAGR of 6.80% from 2019-2033 |
| Segmentation |
|
Table of Contents
- 1. Introduction
- 1.1. Research Scope
- 1.2. Market Segmentation
- 1.3. Research Methodology
- 1.4. Definitions and Assumptions
- 2. Executive Summary
- 2.1. Introduction
- 3. Market Dynamics
- 3.1. Introduction
- 3.2. Market Drivers
- 3.2.1. Increasing Consumer Demand for Products with Low Environmental Impacts; Dedicated Policies and Government Efforts to Promote the use of Biotechnology
- 3.3. Market Restrains
- 3.3.1. Deteriorating Fertility of Agricultural Lands
- 3.4. Market Trends
- 3.4.1. Increasing Demand for Allergen-free Food
- 4. Market Factor Analysis
- 4.1. Porters Five Forces
- 4.2. Supply/Value Chain
- 4.3. PESTEL analysis
- 4.4. Market Entropy
- 4.5. Patent/Trademark Analysis
- 5. Global US Food Allergen Testing Market Analysis, Insights and Forecast, 2019-2031
- 5.1. Market Analysis, Insights and Forecast - by Technology
- 5.1.1. Biosensors-based
- 5.1.2. Immunoassay-based/ELISA
- 5.1.3. PCR
- 5.1.4. Other Technologies
- 5.2. Market Analysis, Insights and Forecast - by Food Testing
- 5.2.1. Dairy Products
- 5.2.2. Bakery and Confectionery
- 5.2.3. Meat and Seafood
- 5.2.4. Baby Food and Infant Formula
- 5.2.5. Beverages
- 5.2.6. Other Processed Foods
- 5.3. Market Analysis, Insights and Forecast - by Region
- 5.3.1. North America
- 5.3.2. South America
- 5.3.3. Europe
- 5.3.4. Middle East & Africa
- 5.3.5. Asia Pacific
- 5.1. Market Analysis, Insights and Forecast - by Technology
- 6. North America US Food Allergen Testing Market Analysis, Insights and Forecast, 2019-2031
- 6.1. Market Analysis, Insights and Forecast - by Technology
- 6.1.1. Biosensors-based
- 6.1.2. Immunoassay-based/ELISA
- 6.1.3. PCR
- 6.1.4. Other Technologies
- 6.2. Market Analysis, Insights and Forecast - by Food Testing
- 6.2.1. Dairy Products
- 6.2.2. Bakery and Confectionery
- 6.2.3. Meat and Seafood
- 6.2.4. Baby Food and Infant Formula
- 6.2.5. Beverages
- 6.2.6. Other Processed Foods
- 6.1. Market Analysis, Insights and Forecast - by Technology
- 7. South America US Food Allergen Testing Market Analysis, Insights and Forecast, 2019-2031
- 7.1. Market Analysis, Insights and Forecast - by Technology
- 7.1.1. Biosensors-based
- 7.1.2. Immunoassay-based/ELISA
- 7.1.3. PCR
- 7.1.4. Other Technologies
- 7.2. Market Analysis, Insights and Forecast - by Food Testing
- 7.2.1. Dairy Products
- 7.2.2. Bakery and Confectionery
- 7.2.3. Meat and Seafood
- 7.2.4. Baby Food and Infant Formula
- 7.2.5. Beverages
- 7.2.6. Other Processed Foods
- 7.1. Market Analysis, Insights and Forecast - by Technology
- 8. Europe US Food Allergen Testing Market Analysis, Insights and Forecast, 2019-2031
- 8.1. Market Analysis, Insights and Forecast - by Technology
- 8.1.1. Biosensors-based
- 8.1.2. Immunoassay-based/ELISA
- 8.1.3. PCR
- 8.1.4. Other Technologies
- 8.2. Market Analysis, Insights and Forecast - by Food Testing
- 8.2.1. Dairy Products
- 8.2.2. Bakery and Confectionery
- 8.2.3. Meat and Seafood
- 8.2.4. Baby Food and Infant Formula
- 8.2.5. Beverages
- 8.2.6. Other Processed Foods
- 8.1. Market Analysis, Insights and Forecast - by Technology
- 9. Middle East & Africa US Food Allergen Testing Market Analysis, Insights and Forecast, 2019-2031
- 9.1. Market Analysis, Insights and Forecast - by Technology
- 9.1.1. Biosensors-based
- 9.1.2. Immunoassay-based/ELISA
- 9.1.3. PCR
- 9.1.4. Other Technologies
- 9.2. Market Analysis, Insights and Forecast - by Food Testing
- 9.2.1. Dairy Products
- 9.2.2. Bakery and Confectionery
- 9.2.3. Meat and Seafood
- 9.2.4. Baby Food and Infant Formula
- 9.2.5. Beverages
- 9.2.6. Other Processed Foods
- 9.1. Market Analysis, Insights and Forecast - by Technology
- 10. Asia Pacific US Food Allergen Testing Market Analysis, Insights and Forecast, 2019-2031
- 10.1. Market Analysis, Insights and Forecast - by Technology
- 10.1.1. Biosensors-based
- 10.1.2. Immunoassay-based/ELISA
- 10.1.3. PCR
- 10.1.4. Other Technologies
- 10.2. Market Analysis, Insights and Forecast - by Food Testing
- 10.2.1. Dairy Products
- 10.2.2. Bakery and Confectionery
- 10.2.3. Meat and Seafood
- 10.2.4. Baby Food and Infant Formula
- 10.2.5. Beverages
- 10.2.6. Other Processed Foods
- 10.1. Market Analysis, Insights and Forecast - by Technology
- 11. Northeast US Food Allergen Testing Market Analysis, Insights and Forecast, 2019-2031
- 12. Southeast US Food Allergen Testing Market Analysis, Insights and Forecast, 2019-2031
- 13. Midwest US Food Allergen Testing Market Analysis, Insights and Forecast, 2019-2031
- 14. Southwest US Food Allergen Testing Market Analysis, Insights and Forecast, 2019-2031
- 15. West US Food Allergen Testing Market Analysis, Insights and Forecast, 2019-2031
- 16. Competitive Analysis
- 16.1. Global Market Share Analysis 2024
- 16.2. Company Profiles
- 16.2.1 Intertek Group PLC
- 16.2.1.1. Overview
- 16.2.1.2. Products
- 16.2.1.3. SWOT Analysis
- 16.2.1.4. Recent Developments
- 16.2.1.5. Financials (Based on Availability)
- 16.2.2 R-Biopharm AG
- 16.2.2.1. Overview
- 16.2.2.2. Products
- 16.2.2.3. SWOT Analysis
- 16.2.2.4. Recent Developments
- 16.2.2.5. Financials (Based on Availability)
- 16.2.3 Eurofins Scientific
- 16.2.3.1. Overview
- 16.2.3.2. Products
- 16.2.3.3. SWOT Analysis
- 16.2.3.4. Recent Developments
- 16.2.3.5. Financials (Based on Availability)
- 16.2.4 SGS SA
- 16.2.4.1. Overview
- 16.2.4.2. Products
- 16.2.4.3. SWOT Analysis
- 16.2.4.4. Recent Developments
- 16.2.4.5. Financials (Based on Availability)
- 16.2.5 Merieux Nutrisciences
- 16.2.5.1. Overview
- 16.2.5.2. Products
- 16.2.5.3. SWOT Analysis
- 16.2.5.4. Recent Developments
- 16.2.5.5. Financials (Based on Availability)
- 16.2.6 Bureau Veritas
- 16.2.6.1. Overview
- 16.2.6.2. Products
- 16.2.6.3. SWOT Analysis
- 16.2.6.4. Recent Developments
- 16.2.6.5. Financials (Based on Availability)
- 16.2.7 TUV SUD*List Not Exhaustive
- 16.2.7.1. Overview
- 16.2.7.2. Products
- 16.2.7.3. SWOT Analysis
- 16.2.7.4. Recent Developments
- 16.2.7.5. Financials (Based on Availability)
- 16.2.1 Intertek Group PLC
List of Figures
- Figure 1: Global US Food Allergen Testing Market Revenue Breakdown (Million, %) by Region 2024 & 2032
- Figure 2: United states US Food Allergen Testing Market Revenue (Million), by Country 2024 & 2032
- Figure 3: United states US Food Allergen Testing Market Revenue Share (%), by Country 2024 & 2032
- Figure 4: North America US Food Allergen Testing Market Revenue (Million), by Technology 2024 & 2032
- Figure 5: North America US Food Allergen Testing Market Revenue Share (%), by Technology 2024 & 2032
- Figure 6: North America US Food Allergen Testing Market Revenue (Million), by Food Testing 2024 & 2032
- Figure 7: North America US Food Allergen Testing Market Revenue Share (%), by Food Testing 2024 & 2032
- Figure 8: North America US Food Allergen Testing Market Revenue (Million), by Country 2024 & 2032
- Figure 9: North America US Food Allergen Testing Market Revenue Share (%), by Country 2024 & 2032
- Figure 10: South America US Food Allergen Testing Market Revenue (Million), by Technology 2024 & 2032
- Figure 11: South America US Food Allergen Testing Market Revenue Share (%), by Technology 2024 & 2032
- Figure 12: South America US Food Allergen Testing Market Revenue (Million), by Food Testing 2024 & 2032
- Figure 13: South America US Food Allergen Testing Market Revenue Share (%), by Food Testing 2024 & 2032
- Figure 14: South America US Food Allergen Testing Market Revenue (Million), by Country 2024 & 2032
- Figure 15: South America US Food Allergen Testing Market Revenue Share (%), by Country 2024 & 2032
- Figure 16: Europe US Food Allergen Testing Market Revenue (Million), by Technology 2024 & 2032
- Figure 17: Europe US Food Allergen Testing Market Revenue Share (%), by Technology 2024 & 2032
- Figure 18: Europe US Food Allergen Testing Market Revenue (Million), by Food Testing 2024 & 2032
- Figure 19: Europe US Food Allergen Testing Market Revenue Share (%), by Food Testing 2024 & 2032
- Figure 20: Europe US Food Allergen Testing Market Revenue (Million), by Country 2024 & 2032
- Figure 21: Europe US Food Allergen Testing Market Revenue Share (%), by Country 2024 & 2032
- Figure 22: Middle East & Africa US Food Allergen Testing Market Revenue (Million), by Technology 2024 & 2032
- Figure 23: Middle East & Africa US Food Allergen Testing Market Revenue Share (%), by Technology 2024 & 2032
- Figure 24: Middle East & Africa US Food Allergen Testing Market Revenue (Million), by Food Testing 2024 & 2032
- Figure 25: Middle East & Africa US Food Allergen Testing Market Revenue Share (%), by Food Testing 2024 & 2032
- Figure 26: Middle East & Africa US Food Allergen Testing Market Revenue (Million), by Country 2024 & 2032
- Figure 27: Middle East & Africa US Food Allergen Testing Market Revenue Share (%), by Country 2024 & 2032
- Figure 28: Asia Pacific US Food Allergen Testing Market Revenue (Million), by Technology 2024 & 2032
- Figure 29: Asia Pacific US Food Allergen Testing Market Revenue Share (%), by Technology 2024 & 2032
- Figure 30: Asia Pacific US Food Allergen Testing Market Revenue (Million), by Food Testing 2024 & 2032
- Figure 31: Asia Pacific US Food Allergen Testing Market Revenue Share (%), by Food Testing 2024 & 2032
- Figure 32: Asia Pacific US Food Allergen Testing Market Revenue (Million), by Country 2024 & 2032
- Figure 33: Asia Pacific US Food Allergen Testing Market Revenue Share (%), by Country 2024 & 2032
List of Tables
- Table 1: Global US Food Allergen Testing Market Revenue Million Forecast, by Region 2019 & 2032
- Table 2: Global US Food Allergen Testing Market Revenue Million Forecast, by Technology 2019 & 2032
- Table 3: Global US Food Allergen Testing Market Revenue Million Forecast, by Food Testing 2019 & 2032
- Table 4: Global US Food Allergen Testing Market Revenue Million Forecast, by Region 2019 & 2032
- Table 5: Global US Food Allergen Testing Market Revenue Million Forecast, by Country 2019 & 2032
- Table 6: Northeast US Food Allergen Testing Market Revenue (Million) Forecast, by Application 2019 & 2032
- Table 7: Southeast US Food Allergen Testing Market Revenue (Million) Forecast, by Application 2019 & 2032
- Table 8: Midwest US Food Allergen Testing Market Revenue (Million) Forecast, by Application 2019 & 2032
- Table 9: Southwest US Food Allergen Testing Market Revenue (Million) Forecast, by Application 2019 & 2032
- Table 10: West US Food Allergen Testing Market Revenue (Million) Forecast, by Application 2019 & 2032
- Table 11: Global US Food Allergen Testing Market Revenue Million Forecast, by Technology 2019 & 2032
- Table 12: Global US Food Allergen Testing Market Revenue Million Forecast, by Food Testing 2019 & 2032
- Table 13: Global US Food Allergen Testing Market Revenue Million Forecast, by Country 2019 & 2032
- Table 14: United States US Food Allergen Testing Market Revenue (Million) Forecast, by Application 2019 & 2032
- Table 15: Canada US Food Allergen Testing Market Revenue (Million) Forecast, by Application 2019 & 2032
- Table 16: Mexico US Food Allergen Testing Market Revenue (Million) Forecast, by Application 2019 & 2032
- Table 17: Global US Food Allergen Testing Market Revenue Million Forecast, by Technology 2019 & 2032
- Table 18: Global US Food Allergen Testing Market Revenue Million Forecast, by Food Testing 2019 & 2032
- Table 19: Global US Food Allergen Testing Market Revenue Million Forecast, by Country 2019 & 2032
- Table 20: Brazil US Food Allergen Testing Market Revenue (Million) Forecast, by Application 2019 & 2032
- Table 21: Argentina US Food Allergen Testing Market Revenue (Million) Forecast, by Application 2019 & 2032
- Table 22: Rest of South America US Food Allergen Testing Market Revenue (Million) Forecast, by Application 2019 & 2032
- Table 23: Global US Food Allergen Testing Market Revenue Million Forecast, by Technology 2019 & 2032
- Table 24: Global US Food Allergen Testing Market Revenue Million Forecast, by Food Testing 2019 & 2032
- Table 25: Global US Food Allergen Testing Market Revenue Million Forecast, by Country 2019 & 2032
- Table 26: United Kingdom US Food Allergen Testing Market Revenue (Million) Forecast, by Application 2019 & 2032
- Table 27: Germany US Food Allergen Testing Market Revenue (Million) Forecast, by Application 2019 & 2032
- Table 28: France US Food Allergen Testing Market Revenue (Million) Forecast, by Application 2019 & 2032
- Table 29: Italy US Food Allergen Testing Market Revenue (Million) Forecast, by Application 2019 & 2032
- Table 30: Spain US Food Allergen Testing Market Revenue (Million) Forecast, by Application 2019 & 2032
- Table 31: Russia US Food Allergen Testing Market Revenue (Million) Forecast, by Application 2019 & 2032
- Table 32: Benelux US Food Allergen Testing Market Revenue (Million) Forecast, by Application 2019 & 2032
- Table 33: Nordics US Food Allergen Testing Market Revenue (Million) Forecast, by Application 2019 & 2032
- Table 34: Rest of Europe US Food Allergen Testing Market Revenue (Million) Forecast, by Application 2019 & 2032
- Table 35: Global US Food Allergen Testing Market Revenue Million Forecast, by Technology 2019 & 2032
- Table 36: Global US Food Allergen Testing Market Revenue Million Forecast, by Food Testing 2019 & 2032
- Table 37: Global US Food Allergen Testing Market Revenue Million Forecast, by Country 2019 & 2032
- Table 38: Turkey US Food Allergen Testing Market Revenue (Million) Forecast, by Application 2019 & 2032
- Table 39: Israel US Food Allergen Testing Market Revenue (Million) Forecast, by Application 2019 & 2032
- Table 40: GCC US Food Allergen Testing Market Revenue (Million) Forecast, by Application 2019 & 2032
- Table 41: North Africa US Food Allergen Testing Market Revenue (Million) Forecast, by Application 2019 & 2032
- Table 42: South Africa US Food Allergen Testing Market Revenue (Million) Forecast, by Application 2019 & 2032
- Table 43: Rest of Middle East & Africa US Food Allergen Testing Market Revenue (Million) Forecast, by Application 2019 & 2032
- Table 44: Global US Food Allergen Testing Market Revenue Million Forecast, by Technology 2019 & 2032
- Table 45: Global US Food Allergen Testing Market Revenue Million Forecast, by Food Testing 2019 & 2032
- Table 46: Global US Food Allergen Testing Market Revenue Million Forecast, by Country 2019 & 2032
- Table 47: China US Food Allergen Testing Market Revenue (Million) Forecast, by Application 2019 & 2032
- Table 48: India US Food Allergen Testing Market Revenue (Million) Forecast, by Application 2019 & 2032
- Table 49: Japan US Food Allergen Testing Market Revenue (Million) Forecast, by Application 2019 & 2032
- Table 50: South Korea US Food Allergen Testing Market Revenue (Million) Forecast, by Application 2019 & 2032
- Table 51: ASEAN US Food Allergen Testing Market Revenue (Million) Forecast, by Application 2019 & 2032
- Table 52: Oceania US Food Allergen Testing Market Revenue (Million) Forecast, by Application 2019 & 2032
- Table 53: Rest of Asia Pacific US Food Allergen Testing Market Revenue (Million) Forecast, by Application 2019 & 2032
Frequently Asked Questions
1. What is the projected Compound Annual Growth Rate (CAGR) of the US Food Allergen Testing Market?
The projected CAGR is approximately 6.80%.
2. Which companies are prominent players in the US Food Allergen Testing Market?
Key companies in the market include Intertek Group PLC, R-Biopharm AG, Eurofins Scientific, SGS SA, Merieux Nutrisciences, Bureau Veritas, TUV SUD*List Not Exhaustive.
3. What are the main segments of the US Food Allergen Testing Market?
The market segments include Technology, Food Testing .
4. Can you provide details about the market size?
The market size is estimated to be USD XX Million as of 2022.
5. What are some drivers contributing to market growth?
Increasing Consumer Demand for Products with Low Environmental Impacts; Dedicated Policies and Government Efforts to Promote the use of Biotechnology.
6. What are the notable trends driving market growth?
Increasing Demand for Allergen-free Food.
7. Are there any restraints impacting market growth?
Deteriorating Fertility of Agricultural Lands.
8. Can you provide examples of recent developments in the market?
N/A
9. What pricing options are available for accessing the report?
Pricing options include single-user, multi-user, and enterprise licenses priced at USD 4750, USD 5250, and USD 8750 respectively.
10. Is the market size provided in terms of value or volume?
The market size is provided in terms of value, measured in Million.
11. Are there any specific market keywords associated with the report?
Yes, the market keyword associated with the report is "US Food Allergen Testing Market," which aids in identifying and referencing the specific market segment covered.
12. How do I determine which pricing option suits my needs best?
The pricing options vary based on user requirements and access needs. Individual users may opt for single-user licenses, while businesses requiring broader access may choose multi-user or enterprise licenses for cost-effective access to the report.
13. Are there any additional resources or data provided in the US Food Allergen Testing Market report?
While the report offers comprehensive insights, it's advisable to review the specific contents or supplementary materials provided to ascertain if additional resources or data are available.
14. How can I stay updated on further developments or reports in the US Food Allergen Testing Market?
To stay informed about further developments, trends, and reports in the US Food Allergen Testing Market, consider subscribing to industry newsletters, following relevant companies and organizations, or regularly checking reputable industry news sources and publications.
Methodology
Step 1 - Identification of Relevant Samples Size from Population Database


Step 2 - Approaches for Defining Global Market Size (Value, Volume* & Price*)

Note*: In applicable scenarios
Step 3 - Data Sources
Primary Research
- Web Analytics
- Survey Reports
- Research Institute
- Latest Research Reports
- Opinion Leaders
Secondary Research
- Annual Reports
- White Paper
- Latest Press Release
- Industry Association
- Paid Database
- Investor Presentations

Step 4 - Data Triangulation
Involves using different sources of information in order to increase the validity of a study
These sources are likely to be stakeholders in a program - participants, other researchers, program staff, other community members, and so on.
Then we put all data in single framework & apply various statistical tools to find out the dynamic on the market.
During the analysis stage, feedback from the stakeholder groups would be compared to determine areas of agreement as well as areas of divergence


