

Key Insights
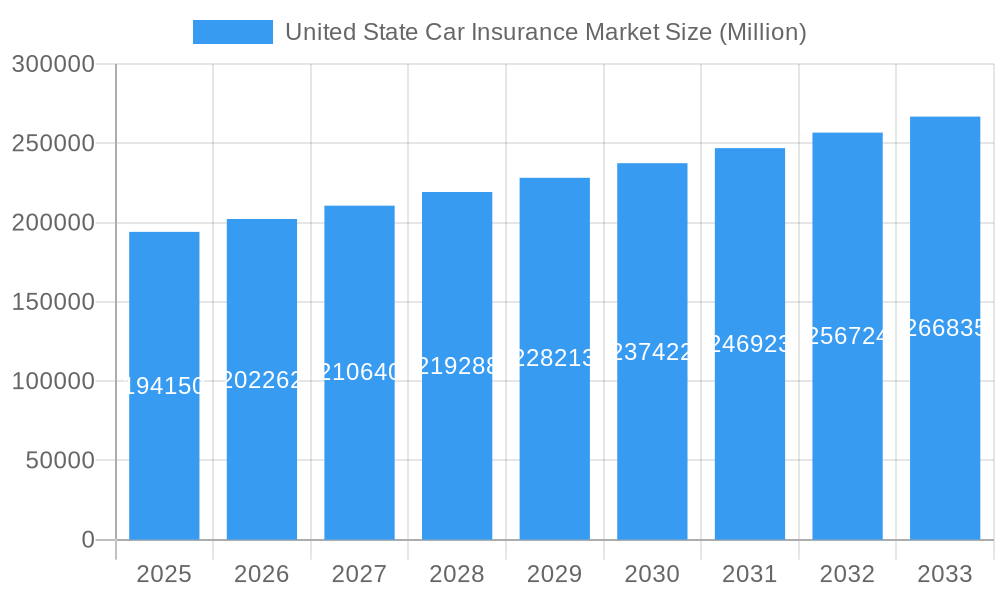
The United States car insurance market, valued at $194.15 billion in 2025, is projected to experience steady growth, driven by factors such as rising vehicle ownership, increasing urbanization leading to higher accident rates, and the stringent regulatory environment mandating car insurance. The market's Compound Annual Growth Rate (CAGR) of 4.21% from 2019 to 2025 suggests a consistent upward trajectory. This growth is further fueled by technological advancements, such as telematics and AI-powered risk assessment, which are improving efficiency and personalization within the industry. However, increasing premiums due to inflation and escalating claim costs pose a significant challenge. Furthermore, heightened competition among established players like State Farm, Berkshire Hathaway, Progressive, and Allstate, alongside the emergence of Insurtech companies, puts pressure on pricing and profit margins. The market segmentation is likely diverse, encompassing various coverage types (liability, collision, comprehensive), pricing models (usage-based, pay-as-you-drive), and customer demographics (age, driving history, location). The forecast period of 2025-2033 anticipates continued expansion, though the rate of growth might fluctuate based on economic conditions and evolving consumer preferences.
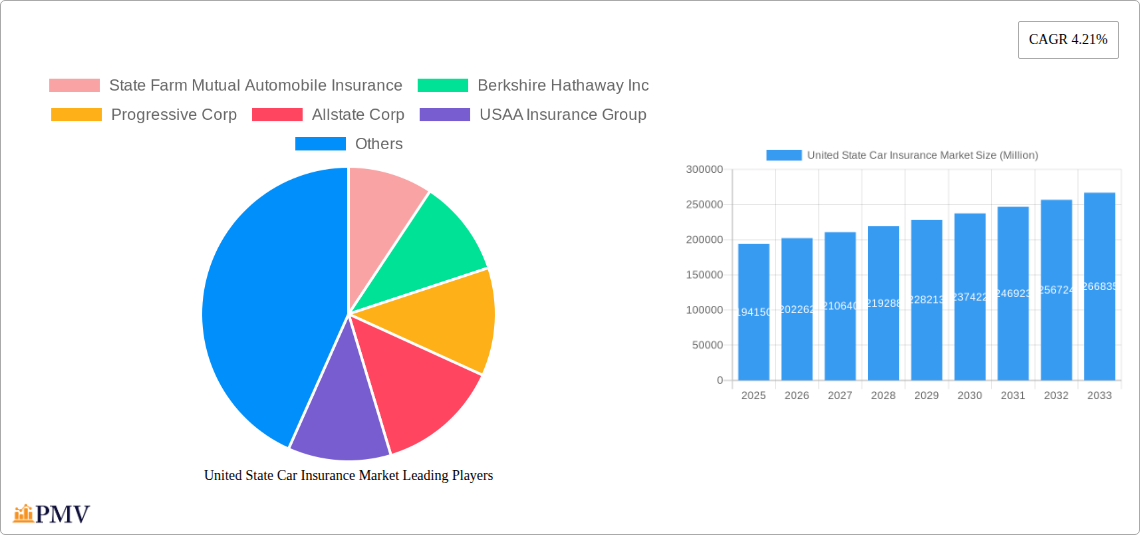
United State Car Insurance Market Market Size (In Billion)
The competitive landscape is characterized by a mix of large, established insurers with extensive distribution networks and newer, agile Insurtech firms leveraging technology to disrupt traditional models. These Insurtech companies often offer more flexible and personalized policies, appealing to younger generations. Regional variations in market penetration are likely to exist, influenced by factors such as population density, income levels, and state-specific regulations. Future growth will depend on the successful adaptation of insurers to changing consumer expectations, effective management of operational costs, and the successful integration of technological innovations to enhance customer experience and improve underwriting accuracy. The ability to manage risks associated with autonomous vehicles and cybersecurity threats will also play a crucial role in shaping the future of the market.
United State Car Insurance Market Company Market Share
United States Car Insurance Market Report: 2019-2033
This comprehensive report provides a detailed analysis of the United States car insurance market, offering invaluable insights for industry stakeholders, investors, and strategic decision-makers. Covering the period from 2019 to 2033 (Study Period), with a base year of 2025 and a forecast period of 2025-2033, this report leverages historical data (2019-2024) and robust forecasting methodologies to deliver a clear and actionable understanding of this dynamic market. The market size in 2025 is estimated to be xx Million.
United States Car Insurance Market Structure & Competitive Dynamics
This section delves into the competitive landscape of the US car insurance market, analyzing market concentration, innovation, regulatory frameworks, and industry dynamics. We examine the roles of key players like State Farm Mutual Automobile Insurance, Berkshire Hathaway Inc, Progressive Corp, Allstate Corp, USAA Insurance Group, Liberty Mutual, Farmers Insurance Group of Companies, Nationwide Mutual Group, American Family Insurance Group, and Travelers Companies Inc (list not exhaustive), assessing their market share and influence. The analysis incorporates an evaluation of mergers and acquisitions (M&A) activities, including deal values, and their impact on market consolidation. We explore the innovative ecosystems driving technological advancements and the regulatory frameworks shaping market practices. Furthermore, the report investigates the influence of substitute products and evolving end-user trends on market dynamics. The market is characterized by a high degree of concentration, with the top 10 insurers holding approximately xx% of the market share in 2025. M&A activity has been significant in recent years, with total deal values exceeding xx Million in the period 2019-2024.
- Market Concentration: High, with the top 10 insurers dominating.
- Innovation Ecosystems: Strong focus on digitalization and AI-powered solutions.
- Regulatory Frameworks: Stringent regulations impacting pricing and product offerings.
- Product Substitutes: Limited, with the primary competition being among established insurers.
- End-User Trends: Growing demand for personalized and digital-first insurance solutions.
- M&A Activities: Significant consolidation observed in recent years, driven by economies of scale and technological advancements.
United States Car Insurance Market Industry Trends & Insights
This section provides a detailed overview of the key industry trends shaping the US car insurance market. We analyze market growth drivers, including factors like population growth, increasing vehicle ownership, and rising awareness of insurance needs. The report also explores the impact of technological disruptions, such as the adoption of telematics and AI-powered claims processing. Furthermore, we examine shifting consumer preferences, focusing on the growing demand for personalized and digital insurance solutions. The competitive dynamics are analyzed, considering the strategies of key players to gain market share. The market is projected to experience a Compound Annual Growth Rate (CAGR) of xx% during the forecast period (2025-2033), driven by increasing vehicle ownership and technological advancements. Market penetration is expected to reach xx% by 2033.
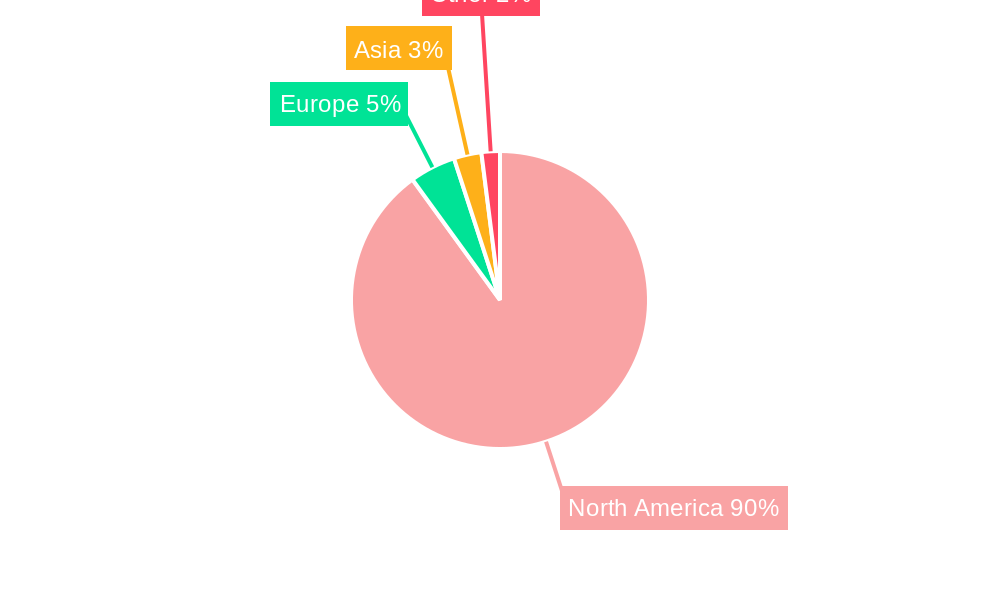
Dominant Markets & Segments in United States Car Insurance Market
This section identifies the leading regions, countries, or segments within the US car insurance market. We analyze the key factors driving the dominance of specific segments, examining economic policies, infrastructure development, and demographic trends. A detailed analysis of the leading regions will be provided. For example, California and Texas, with their large populations and high vehicle ownership rates, are expected to remain dominant markets.
- California: Strong economic growth and high vehicle density drive significant demand.
- Texas: Large population and robust automotive industry contribute to market growth.
- Florida: High population density and tourist traffic contribute to significant insurance demand.
- New York: Large population and robust economy contribute to market growth.
- Other States: Continued growth driven by factors such as population growth and economic development.
United States Car Insurance Market Product Innovations
This section summarizes recent product developments, focusing on technological advancements and their impact on market dynamics. The adoption of telematics, AI-powered claims processing, and personalized insurance products are key areas of innovation. These advancements enable insurers to offer more accurate risk assessments, streamlined claims processes, and tailored insurance packages, enhancing customer experience and driving market growth.
Report Segmentation & Scope
This report segments the US car insurance market based on several factors, including coverage type (e.g., liability, collision, comprehensive), distribution channel (e.g., direct, agents, brokers), and vehicle type (e.g., passenger cars, commercial vehicles). Each segment is analyzed based on growth projections, market size, and competitive dynamics. Market sizes and projections are provided for each key segment.
Key Drivers of United State Car Insurance Market Growth
The growth of the US car insurance market is propelled by several key factors, including: rising vehicle ownership; increasing awareness of insurance needs; technological advancements such as telematics and AI; favorable economic conditions fostering higher disposable incomes. Stringent government regulations also ensure market stability and consumer protection.
Challenges in the United State Car Insurance Market Sector
The US car insurance market faces challenges such as increasing regulatory scrutiny, rising claims costs due to advancements in auto repair technology, intense competition among established and new entrants, and fluctuations in economic conditions affecting consumer spending. These challenges may lead to decreased profitability for some insurers.
Leading Players in the United State Car Insurance Market Market
Key Developments in United State Car Insurance Market Sector
- August 2023: AXA S.A. launched STeP, a new digital claims solution aimed at streamlining the car insurance process, enhancing customer experience, and potentially reducing processing costs.
- May 2022: GEICO partnered with Tractable, integrating AI technology to assess car damage and accelerate the claims and repair process, resulting in faster claim settlements and cost efficiencies.
Strategic United States Car Insurance Market Outlook
The US car insurance market presents significant opportunities for growth, driven by ongoing technological innovation, increasing demand for personalized insurance solutions, and the potential for expansion into underserved markets. Strategic partnerships and investments in digital technologies will be crucial for insurers to maintain competitiveness and capitalize on future growth opportunities. The market is expected to continue its expansion, presenting lucrative opportunities for both established players and new entrants.
United State Car Insurance Market Segmentation
-
1. Coverage
- 1.1. Third-Party Liability Coverage
- 1.2. Collision/Comprehensive/Other Optional Coverage
-
2. Application
- 2.1. Personal Vehicles
- 2.2. Commercial Vehicles
-
3. Distribution Channel
- 3.1. Agents
- 3.2. Banks
- 3.3. Brokers
- 3.4. Other Distribution Channel
United State Car Insurance Market Segmentation By Geography
-
1. North America
- 1.1. United States
- 1.2. Canada
- 1.3. Mexico
-
2. South America
- 2.1. Brazil
- 2.2. Argentina
- 2.3. Rest of South America
-
3. Europe
- 3.1. United Kingdom
- 3.2. Germany
- 3.3. France
- 3.4. Italy
- 3.5. Spain
- 3.6. Russia
- 3.7. Benelux
- 3.8. Nordics
- 3.9. Rest of Europe
-
4. Middle East & Africa
- 4.1. Turkey
- 4.2. Israel
- 4.3. GCC
- 4.4. North Africa
- 4.5. South Africa
- 4.6. Rest of Middle East & Africa
-
5. Asia Pacific
- 5.1. China
- 5.2. India
- 5.3. Japan
- 5.4. South Korea
- 5.5. ASEAN
- 5.6. Oceania
- 5.7. Rest of Asia Pacific
United State Car Insurance Market Regional Market Share
Geographic Coverage of United State Car Insurance Market
United State Car Insurance Market REPORT HIGHLIGHTS
| Aspects | Details |
|---|---|
| Study Period | 2020-2034 |
| Base Year | 2025 |
| Estimated Year | 2026 |
| Forecast Period | 2026-2034 |
| Historical Period | 2020-2025 |
| Growth Rate | CAGR of 4.21% from 2020-2034 |
| Segmentation |
|
Table of Contents
- 1. Introduction
- 1.1. Research Scope
- 1.2. Market Segmentation
- 1.3. Research Objective
- 1.4. Definitions and Assumptions
- 2. Executive Summary
- 2.1. Market Snapshot
- 3. Market Dynamics
- 3.1. Market Drivers
- 3.2. Market Restrains
- 3.3. Market Trends
- 3.4. Market Opportunities
- 4. Market Factor Analysis
- 4.1. Porters Five Forces
- 4.1.1. Bargaining Power of Suppliers
- 4.1.2. Bargaining Power of Buyers
- 4.1.3. Threat of New Entrants
- 4.1.4. Threat of Substitutes
- 4.1.5. Competitive Rivalry
- 4.2. PESTEL analysis
- 4.3. BCG Analysis
- 4.3.1. Stars (High Growth, High Market Share)
- 4.3.2. Cash Cows (Low Growth, High Market Share)
- 4.3.3. Question Mark (High Growth, Low Market Share)
- 4.3.4. Dogs (Low Growth, Low Market Share)
- 4.4. Ansoff Matrix Analysis
- 4.5. Supply Chain Analysis
- 4.6. Regulatory Landscape
- 4.7. Current Market Potential and Opportunity Assessment (TAM–SAM–SOM Framework)
- 4.8. PMV Analyst Note
- 4.1. Porters Five Forces
- 5. Market Analysis, Insights and Forecast 2021-2033
- 5.1. Market Analysis, Insights and Forecast - by Coverage
- 5.1.1. Third-Party Liability Coverage
- 5.1.2. Collision/Comprehensive/Other Optional Coverage
- 5.2. Market Analysis, Insights and Forecast - by Application
- 5.2.1. Personal Vehicles
- 5.2.2. Commercial Vehicles
- 5.3. Market Analysis, Insights and Forecast - by Distribution Channel
- 5.3.1. Agents
- 5.3.2. Banks
- 5.3.3. Brokers
- 5.3.4. Other Distribution Channel
- 5.4. Market Analysis, Insights and Forecast - by Region
- 5.4.1. North America
- 5.4.2. South America
- 5.4.3. Europe
- 5.4.4. Middle East & Africa
- 5.4.5. Asia Pacific
- 5.1. Market Analysis, Insights and Forecast - by Coverage
- 6. Global United State Car Insurance Market Analysis, Insights and Forecast, 2021-2033
- 6.1. Market Analysis, Insights and Forecast - by Coverage
- 6.1.1. Third-Party Liability Coverage
- 6.1.2. Collision/Comprehensive/Other Optional Coverage
- 6.2. Market Analysis, Insights and Forecast - by Application
- 6.2.1. Personal Vehicles
- 6.2.2. Commercial Vehicles
- 6.3. Market Analysis, Insights and Forecast - by Distribution Channel
- 6.3.1. Agents
- 6.3.2. Banks
- 6.3.3. Brokers
- 6.3.4. Other Distribution Channel
- 6.1. Market Analysis, Insights and Forecast - by Coverage
- 7. North America United State Car Insurance Market Analysis, Insights and Forecast, 2020-2032
- 7.1. Market Analysis, Insights and Forecast - by Coverage
- 7.1.1. Third-Party Liability Coverage
- 7.1.2. Collision/Comprehensive/Other Optional Coverage
- 7.2. Market Analysis, Insights and Forecast - by Application
- 7.2.1. Personal Vehicles
- 7.2.2. Commercial Vehicles
- 7.3. Market Analysis, Insights and Forecast - by Distribution Channel
- 7.3.1. Agents
- 7.3.2. Banks
- 7.3.3. Brokers
- 7.3.4. Other Distribution Channel
- 7.1. Market Analysis, Insights and Forecast - by Coverage
- 8. South America United State Car Insurance Market Analysis, Insights and Forecast, 2020-2032
- 8.1. Market Analysis, Insights and Forecast - by Coverage
- 8.1.1. Third-Party Liability Coverage
- 8.1.2. Collision/Comprehensive/Other Optional Coverage
- 8.2. Market Analysis, Insights and Forecast - by Application
- 8.2.1. Personal Vehicles
- 8.2.2. Commercial Vehicles
- 8.3. Market Analysis, Insights and Forecast - by Distribution Channel
- 8.3.1. Agents
- 8.3.2. Banks
- 8.3.3. Brokers
- 8.3.4. Other Distribution Channel
- 8.1. Market Analysis, Insights and Forecast - by Coverage
- 9. Europe United State Car Insurance Market Analysis, Insights and Forecast, 2020-2032
- 9.1. Market Analysis, Insights and Forecast - by Coverage
- 9.1.1. Third-Party Liability Coverage
- 9.1.2. Collision/Comprehensive/Other Optional Coverage
- 9.2. Market Analysis, Insights and Forecast - by Application
- 9.2.1. Personal Vehicles
- 9.2.2. Commercial Vehicles
- 9.3. Market Analysis, Insights and Forecast - by Distribution Channel
- 9.3.1. Agents
- 9.3.2. Banks
- 9.3.3. Brokers
- 9.3.4. Other Distribution Channel
- 9.1. Market Analysis, Insights and Forecast - by Coverage
- 10. Middle East & Africa United State Car Insurance Market Analysis, Insights and Forecast, 2020-2032
- 10.1. Market Analysis, Insights and Forecast - by Coverage
- 10.1.1. Third-Party Liability Coverage
- 10.1.2. Collision/Comprehensive/Other Optional Coverage
- 10.2. Market Analysis, Insights and Forecast - by Application
- 10.2.1. Personal Vehicles
- 10.2.2. Commercial Vehicles
- 10.3. Market Analysis, Insights and Forecast - by Distribution Channel
- 10.3.1. Agents
- 10.3.2. Banks
- 10.3.3. Brokers
- 10.3.4. Other Distribution Channel
- 10.1. Market Analysis, Insights and Forecast - by Coverage
- 11. Asia Pacific United State Car Insurance Market Analysis, Insights and Forecast, 2020-2032
- 11.1. Market Analysis, Insights and Forecast - by Coverage
- 11.1.1. Third-Party Liability Coverage
- 11.1.2. Collision/Comprehensive/Other Optional Coverage
- 11.2. Market Analysis, Insights and Forecast - by Application
- 11.2.1. Personal Vehicles
- 11.2.2. Commercial Vehicles
- 11.3. Market Analysis, Insights and Forecast - by Distribution Channel
- 11.3.1. Agents
- 11.3.2. Banks
- 11.3.3. Brokers
- 11.3.4. Other Distribution Channel
- 11.1. Market Analysis, Insights and Forecast - by Coverage
- 12. Competitive Analysis
- 12.1. Company Profiles
- 12.1.1 State Farm Mutual Automobile Insurance
- 12.1.1.1. Company Overview
- 12.1.1.2. Products
- 12.1.1.3. Company Financials
- 12.1.1.4. SWOT Analysis
- 12.1.2 Berkshire Hathaway Inc
- 12.1.2.1. Company Overview
- 12.1.2.2. Products
- 12.1.2.3. Company Financials
- 12.1.2.4. SWOT Analysis
- 12.1.3 Progressive Corp
- 12.1.3.1. Company Overview
- 12.1.3.2. Products
- 12.1.3.3. Company Financials
- 12.1.3.4. SWOT Analysis
- 12.1.4 Allstate Corp
- 12.1.4.1. Company Overview
- 12.1.4.2. Products
- 12.1.4.3. Company Financials
- 12.1.4.4. SWOT Analysis
- 12.1.5 USAA Insurance Group
- 12.1.5.1. Company Overview
- 12.1.5.2. Products
- 12.1.5.3. Company Financials
- 12.1.5.4. SWOT Analysis
- 12.1.6 Liberty Mutual
- 12.1.6.1. Company Overview
- 12.1.6.2. Products
- 12.1.6.3. Company Financials
- 12.1.6.4. SWOT Analysis
- 12.1.7 Farmers Insurance Group of Companies
- 12.1.7.1. Company Overview
- 12.1.7.2. Products
- 12.1.7.3. Company Financials
- 12.1.7.4. SWOT Analysis
- 12.1.8 Nationwide Mutual Group
- 12.1.8.1. Company Overview
- 12.1.8.2. Products
- 12.1.8.3. Company Financials
- 12.1.8.4. SWOT Analysis
- 12.1.9 American Family Insurance Group
- 12.1.9.1. Company Overview
- 12.1.9.2. Products
- 12.1.9.3. Company Financials
- 12.1.9.4. SWOT Analysis
- 12.1.10 Travelers Companies Inc **List Not Exhaustive
- 12.1.10.1. Company Overview
- 12.1.10.2. Products
- 12.1.10.3. Company Financials
- 12.1.10.4. SWOT Analysis
- 12.1.1 State Farm Mutual Automobile Insurance
- 12.2. Market Entropy
- 12.2.1 Company's Key Areas Served
- 12.2.2 Recent Developments
- 12.3. Company Market Share Analysis 2025
- 12.3.1 Top 5 Companies Market Share Analysis
- 12.3.2 Top 3 Companies Market Share Analysis
- 12.4. List of Potential Customers
- 13. Research Methodology
List of Figures
- Figure 1: Global United State Car Insurance Market Revenue Breakdown (Million, %) by Region 2025 & 2033
- Figure 2: Global United State Car Insurance Market Volume Breakdown (Billion, %) by Region 2025 & 2033
- Figure 3: North America United State Car Insurance Market Revenue (Million), by Coverage 2025 & 2033
- Figure 4: North America United State Car Insurance Market Volume (Billion), by Coverage 2025 & 2033
- Figure 5: North America United State Car Insurance Market Revenue Share (%), by Coverage 2025 & 2033
- Figure 6: North America United State Car Insurance Market Volume Share (%), by Coverage 2025 & 2033
- Figure 7: North America United State Car Insurance Market Revenue (Million), by Application 2025 & 2033
- Figure 8: North America United State Car Insurance Market Volume (Billion), by Application 2025 & 2033
- Figure 9: North America United State Car Insurance Market Revenue Share (%), by Application 2025 & 2033
- Figure 10: North America United State Car Insurance Market Volume Share (%), by Application 2025 & 2033
- Figure 11: North America United State Car Insurance Market Revenue (Million), by Distribution Channel 2025 & 2033
- Figure 12: North America United State Car Insurance Market Volume (Billion), by Distribution Channel 2025 & 2033
- Figure 13: North America United State Car Insurance Market Revenue Share (%), by Distribution Channel 2025 & 2033
- Figure 14: North America United State Car Insurance Market Volume Share (%), by Distribution Channel 2025 & 2033
- Figure 15: North America United State Car Insurance Market Revenue (Million), by Country 2025 & 2033
- Figure 16: North America United State Car Insurance Market Volume (Billion), by Country 2025 & 2033
- Figure 17: North America United State Car Insurance Market Revenue Share (%), by Country 2025 & 2033
- Figure 18: North America United State Car Insurance Market Volume Share (%), by Country 2025 & 2033
- Figure 19: South America United State Car Insurance Market Revenue (Million), by Coverage 2025 & 2033
- Figure 20: South America United State Car Insurance Market Volume (Billion), by Coverage 2025 & 2033
- Figure 21: South America United State Car Insurance Market Revenue Share (%), by Coverage 2025 & 2033
- Figure 22: South America United State Car Insurance Market Volume Share (%), by Coverage 2025 & 2033
- Figure 23: South America United State Car Insurance Market Revenue (Million), by Application 2025 & 2033
- Figure 24: South America United State Car Insurance Market Volume (Billion), by Application 2025 & 2033
- Figure 25: South America United State Car Insurance Market Revenue Share (%), by Application 2025 & 2033
- Figure 26: South America United State Car Insurance Market Volume Share (%), by Application 2025 & 2033
- Figure 27: South America United State Car Insurance Market Revenue (Million), by Distribution Channel 2025 & 2033
- Figure 28: South America United State Car Insurance Market Volume (Billion), by Distribution Channel 2025 & 2033
- Figure 29: South America United State Car Insurance Market Revenue Share (%), by Distribution Channel 2025 & 2033
- Figure 30: South America United State Car Insurance Market Volume Share (%), by Distribution Channel 2025 & 2033
- Figure 31: South America United State Car Insurance Market Revenue (Million), by Country 2025 & 2033
- Figure 32: South America United State Car Insurance Market Volume (Billion), by Country 2025 & 2033
- Figure 33: South America United State Car Insurance Market Revenue Share (%), by Country 2025 & 2033
- Figure 34: South America United State Car Insurance Market Volume Share (%), by Country 2025 & 2033
- Figure 35: Europe United State Car Insurance Market Revenue (Million), by Coverage 2025 & 2033
- Figure 36: Europe United State Car Insurance Market Volume (Billion), by Coverage 2025 & 2033
- Figure 37: Europe United State Car Insurance Market Revenue Share (%), by Coverage 2025 & 2033
- Figure 38: Europe United State Car Insurance Market Volume Share (%), by Coverage 2025 & 2033
- Figure 39: Europe United State Car Insurance Market Revenue (Million), by Application 2025 & 2033
- Figure 40: Europe United State Car Insurance Market Volume (Billion), by Application 2025 & 2033
- Figure 41: Europe United State Car Insurance Market Revenue Share (%), by Application 2025 & 2033
- Figure 42: Europe United State Car Insurance Market Volume Share (%), by Application 2025 & 2033
- Figure 43: Europe United State Car Insurance Market Revenue (Million), by Distribution Channel 2025 & 2033
- Figure 44: Europe United State Car Insurance Market Volume (Billion), by Distribution Channel 2025 & 2033
- Figure 45: Europe United State Car Insurance Market Revenue Share (%), by Distribution Channel 2025 & 2033
- Figure 46: Europe United State Car Insurance Market Volume Share (%), by Distribution Channel 2025 & 2033
- Figure 47: Europe United State Car Insurance Market Revenue (Million), by Country 2025 & 2033
- Figure 48: Europe United State Car Insurance Market Volume (Billion), by Country 2025 & 2033
- Figure 49: Europe United State Car Insurance Market Revenue Share (%), by Country 2025 & 2033
- Figure 50: Europe United State Car Insurance Market Volume Share (%), by Country 2025 & 2033
- Figure 51: Middle East & Africa United State Car Insurance Market Revenue (Million), by Coverage 2025 & 2033
- Figure 52: Middle East & Africa United State Car Insurance Market Volume (Billion), by Coverage 2025 & 2033
- Figure 53: Middle East & Africa United State Car Insurance Market Revenue Share (%), by Coverage 2025 & 2033
- Figure 54: Middle East & Africa United State Car Insurance Market Volume Share (%), by Coverage 2025 & 2033
- Figure 55: Middle East & Africa United State Car Insurance Market Revenue (Million), by Application 2025 & 2033
- Figure 56: Middle East & Africa United State Car Insurance Market Volume (Billion), by Application 2025 & 2033
- Figure 57: Middle East & Africa United State Car Insurance Market Revenue Share (%), by Application 2025 & 2033
- Figure 58: Middle East & Africa United State Car Insurance Market Volume Share (%), by Application 2025 & 2033
- Figure 59: Middle East & Africa United State Car Insurance Market Revenue (Million), by Distribution Channel 2025 & 2033
- Figure 60: Middle East & Africa United State Car Insurance Market Volume (Billion), by Distribution Channel 2025 & 2033
- Figure 61: Middle East & Africa United State Car Insurance Market Revenue Share (%), by Distribution Channel 2025 & 2033
- Figure 62: Middle East & Africa United State Car Insurance Market Volume Share (%), by Distribution Channel 2025 & 2033
- Figure 63: Middle East & Africa United State Car Insurance Market Revenue (Million), by Country 2025 & 2033
- Figure 64: Middle East & Africa United State Car Insurance Market Volume (Billion), by Country 2025 & 2033
- Figure 65: Middle East & Africa United State Car Insurance Market Revenue Share (%), by Country 2025 & 2033
- Figure 66: Middle East & Africa United State Car Insurance Market Volume Share (%), by Country 2025 & 2033
- Figure 67: Asia Pacific United State Car Insurance Market Revenue (Million), by Coverage 2025 & 2033
- Figure 68: Asia Pacific United State Car Insurance Market Volume (Billion), by Coverage 2025 & 2033
- Figure 69: Asia Pacific United State Car Insurance Market Revenue Share (%), by Coverage 2025 & 2033
- Figure 70: Asia Pacific United State Car Insurance Market Volume Share (%), by Coverage 2025 & 2033
- Figure 71: Asia Pacific United State Car Insurance Market Revenue (Million), by Application 2025 & 2033
- Figure 72: Asia Pacific United State Car Insurance Market Volume (Billion), by Application 2025 & 2033
- Figure 73: Asia Pacific United State Car Insurance Market Revenue Share (%), by Application 2025 & 2033
- Figure 74: Asia Pacific United State Car Insurance Market Volume Share (%), by Application 2025 & 2033
- Figure 75: Asia Pacific United State Car Insurance Market Revenue (Million), by Distribution Channel 2025 & 2033
- Figure 76: Asia Pacific United State Car Insurance Market Volume (Billion), by Distribution Channel 2025 & 2033
- Figure 77: Asia Pacific United State Car Insurance Market Revenue Share (%), by Distribution Channel 2025 & 2033
- Figure 78: Asia Pacific United State Car Insurance Market Volume Share (%), by Distribution Channel 2025 & 2033
- Figure 79: Asia Pacific United State Car Insurance Market Revenue (Million), by Country 2025 & 2033
- Figure 80: Asia Pacific United State Car Insurance Market Volume (Billion), by Country 2025 & 2033
- Figure 81: Asia Pacific United State Car Insurance Market Revenue Share (%), by Country 2025 & 2033
- Figure 82: Asia Pacific United State Car Insurance Market Volume Share (%), by Country 2025 & 2033
List of Tables
- Table 1: Global United State Car Insurance Market Revenue Million Forecast, by Coverage 2020 & 2033
- Table 2: Global United State Car Insurance Market Volume Billion Forecast, by Coverage 2020 & 2033
- Table 3: Global United State Car Insurance Market Revenue Million Forecast, by Application 2020 & 2033
- Table 4: Global United State Car Insurance Market Volume Billion Forecast, by Application 2020 & 2033
- Table 5: Global United State Car Insurance Market Revenue Million Forecast, by Distribution Channel 2020 & 2033
- Table 6: Global United State Car Insurance Market Volume Billion Forecast, by Distribution Channel 2020 & 2033
- Table 7: Global United State Car Insurance Market Revenue Million Forecast, by Region 2020 & 2033
- Table 8: Global United State Car Insurance Market Volume Billion Forecast, by Region 2020 & 2033
- Table 9: Global United State Car Insurance Market Revenue Million Forecast, by Coverage 2020 & 2033
- Table 10: Global United State Car Insurance Market Volume Billion Forecast, by Coverage 2020 & 2033
- Table 11: Global United State Car Insurance Market Revenue Million Forecast, by Application 2020 & 2033
- Table 12: Global United State Car Insurance Market Volume Billion Forecast, by Application 2020 & 2033
- Table 13: Global United State Car Insurance Market Revenue Million Forecast, by Distribution Channel 2020 & 2033
- Table 14: Global United State Car Insurance Market Volume Billion Forecast, by Distribution Channel 2020 & 2033
- Table 15: Global United State Car Insurance Market Revenue Million Forecast, by Country 2020 & 2033
- Table 16: Global United State Car Insurance Market Volume Billion Forecast, by Country 2020 & 2033
- Table 17: United States United State Car Insurance Market Revenue (Million) Forecast, by Application 2020 & 2033
- Table 18: United States United State Car Insurance Market Volume (Billion) Forecast, by Application 2020 & 2033
- Table 19: Canada United State Car Insurance Market Revenue (Million) Forecast, by Application 2020 & 2033
- Table 20: Canada United State Car Insurance Market Volume (Billion) Forecast, by Application 2020 & 2033
- Table 21: Mexico United State Car Insurance Market Revenue (Million) Forecast, by Application 2020 & 2033
- Table 22: Mexico United State Car Insurance Market Volume (Billion) Forecast, by Application 2020 & 2033
- Table 23: Global United State Car Insurance Market Revenue Million Forecast, by Coverage 2020 & 2033
- Table 24: Global United State Car Insurance Market Volume Billion Forecast, by Coverage 2020 & 2033
- Table 25: Global United State Car Insurance Market Revenue Million Forecast, by Application 2020 & 2033
- Table 26: Global United State Car Insurance Market Volume Billion Forecast, by Application 2020 & 2033
- Table 27: Global United State Car Insurance Market Revenue Million Forecast, by Distribution Channel 2020 & 2033
- Table 28: Global United State Car Insurance Market Volume Billion Forecast, by Distribution Channel 2020 & 2033
- Table 29: Global United State Car Insurance Market Revenue Million Forecast, by Country 2020 & 2033
- Table 30: Global United State Car Insurance Market Volume Billion Forecast, by Country 2020 & 2033
- Table 31: Brazil United State Car Insurance Market Revenue (Million) Forecast, by Application 2020 & 2033
- Table 32: Brazil United State Car Insurance Market Volume (Billion) Forecast, by Application 2020 & 2033
- Table 33: Argentina United State Car Insurance Market Revenue (Million) Forecast, by Application 2020 & 2033
- Table 34: Argentina United State Car Insurance Market Volume (Billion) Forecast, by Application 2020 & 2033
- Table 35: Rest of South America United State Car Insurance Market Revenue (Million) Forecast, by Application 2020 & 2033
- Table 36: Rest of South America United State Car Insurance Market Volume (Billion) Forecast, by Application 2020 & 2033
- Table 37: Global United State Car Insurance Market Revenue Million Forecast, by Coverage 2020 & 2033
- Table 38: Global United State Car Insurance Market Volume Billion Forecast, by Coverage 2020 & 2033
- Table 39: Global United State Car Insurance Market Revenue Million Forecast, by Application 2020 & 2033
- Table 40: Global United State Car Insurance Market Volume Billion Forecast, by Application 2020 & 2033
- Table 41: Global United State Car Insurance Market Revenue Million Forecast, by Distribution Channel 2020 & 2033
- Table 42: Global United State Car Insurance Market Volume Billion Forecast, by Distribution Channel 2020 & 2033
- Table 43: Global United State Car Insurance Market Revenue Million Forecast, by Country 2020 & 2033
- Table 44: Global United State Car Insurance Market Volume Billion Forecast, by Country 2020 & 2033
- Table 45: United Kingdom United State Car Insurance Market Revenue (Million) Forecast, by Application 2020 & 2033
- Table 46: United Kingdom United State Car Insurance Market Volume (Billion) Forecast, by Application 2020 & 2033
- Table 47: Germany United State Car Insurance Market Revenue (Million) Forecast, by Application 2020 & 2033
- Table 48: Germany United State Car Insurance Market Volume (Billion) Forecast, by Application 2020 & 2033
- Table 49: France United State Car Insurance Market Revenue (Million) Forecast, by Application 2020 & 2033
- Table 50: France United State Car Insurance Market Volume (Billion) Forecast, by Application 2020 & 2033
- Table 51: Italy United State Car Insurance Market Revenue (Million) Forecast, by Application 2020 & 2033
- Table 52: Italy United State Car Insurance Market Volume (Billion) Forecast, by Application 2020 & 2033
- Table 53: Spain United State Car Insurance Market Revenue (Million) Forecast, by Application 2020 & 2033
- Table 54: Spain United State Car Insurance Market Volume (Billion) Forecast, by Application 2020 & 2033
- Table 55: Russia United State Car Insurance Market Revenue (Million) Forecast, by Application 2020 & 2033
- Table 56: Russia United State Car Insurance Market Volume (Billion) Forecast, by Application 2020 & 2033
- Table 57: Benelux United State Car Insurance Market Revenue (Million) Forecast, by Application 2020 & 2033
- Table 58: Benelux United State Car Insurance Market Volume (Billion) Forecast, by Application 2020 & 2033
- Table 59: Nordics United State Car Insurance Market Revenue (Million) Forecast, by Application 2020 & 2033
- Table 60: Nordics United State Car Insurance Market Volume (Billion) Forecast, by Application 2020 & 2033
- Table 61: Rest of Europe United State Car Insurance Market Revenue (Million) Forecast, by Application 2020 & 2033
- Table 62: Rest of Europe United State Car Insurance Market Volume (Billion) Forecast, by Application 2020 & 2033
- Table 63: Global United State Car Insurance Market Revenue Million Forecast, by Coverage 2020 & 2033
- Table 64: Global United State Car Insurance Market Volume Billion Forecast, by Coverage 2020 & 2033
- Table 65: Global United State Car Insurance Market Revenue Million Forecast, by Application 2020 & 2033
- Table 66: Global United State Car Insurance Market Volume Billion Forecast, by Application 2020 & 2033
- Table 67: Global United State Car Insurance Market Revenue Million Forecast, by Distribution Channel 2020 & 2033
- Table 68: Global United State Car Insurance Market Volume Billion Forecast, by Distribution Channel 2020 & 2033
- Table 69: Global United State Car Insurance Market Revenue Million Forecast, by Country 2020 & 2033
- Table 70: Global United State Car Insurance Market Volume Billion Forecast, by Country 2020 & 2033
- Table 71: Turkey United State Car Insurance Market Revenue (Million) Forecast, by Application 2020 & 2033
- Table 72: Turkey United State Car Insurance Market Volume (Billion) Forecast, by Application 2020 & 2033
- Table 73: Israel United State Car Insurance Market Revenue (Million) Forecast, by Application 2020 & 2033
- Table 74: Israel United State Car Insurance Market Volume (Billion) Forecast, by Application 2020 & 2033
- Table 75: GCC United State Car Insurance Market Revenue (Million) Forecast, by Application 2020 & 2033
- Table 76: GCC United State Car Insurance Market Volume (Billion) Forecast, by Application 2020 & 2033
- Table 77: North Africa United State Car Insurance Market Revenue (Million) Forecast, by Application 2020 & 2033
- Table 78: North Africa United State Car Insurance Market Volume (Billion) Forecast, by Application 2020 & 2033
- Table 79: South Africa United State Car Insurance Market Revenue (Million) Forecast, by Application 2020 & 2033
- Table 80: South Africa United State Car Insurance Market Volume (Billion) Forecast, by Application 2020 & 2033
- Table 81: Rest of Middle East & Africa United State Car Insurance Market Revenue (Million) Forecast, by Application 2020 & 2033
- Table 82: Rest of Middle East & Africa United State Car Insurance Market Volume (Billion) Forecast, by Application 2020 & 2033
- Table 83: Global United State Car Insurance Market Revenue Million Forecast, by Coverage 2020 & 2033
- Table 84: Global United State Car Insurance Market Volume Billion Forecast, by Coverage 2020 & 2033
- Table 85: Global United State Car Insurance Market Revenue Million Forecast, by Application 2020 & 2033
- Table 86: Global United State Car Insurance Market Volume Billion Forecast, by Application 2020 & 2033
- Table 87: Global United State Car Insurance Market Revenue Million Forecast, by Distribution Channel 2020 & 2033
- Table 88: Global United State Car Insurance Market Volume Billion Forecast, by Distribution Channel 2020 & 2033
- Table 89: Global United State Car Insurance Market Revenue Million Forecast, by Country 2020 & 2033
- Table 90: Global United State Car Insurance Market Volume Billion Forecast, by Country 2020 & 2033
- Table 91: China United State Car Insurance Market Revenue (Million) Forecast, by Application 2020 & 2033
- Table 92: China United State Car Insurance Market Volume (Billion) Forecast, by Application 2020 & 2033
- Table 93: India United State Car Insurance Market Revenue (Million) Forecast, by Application 2020 & 2033
- Table 94: India United State Car Insurance Market Volume (Billion) Forecast, by Application 2020 & 2033
- Table 95: Japan United State Car Insurance Market Revenue (Million) Forecast, by Application 2020 & 2033
- Table 96: Japan United State Car Insurance Market Volume (Billion) Forecast, by Application 2020 & 2033
- Table 97: South Korea United State Car Insurance Market Revenue (Million) Forecast, by Application 2020 & 2033
- Table 98: South Korea United State Car Insurance Market Volume (Billion) Forecast, by Application 2020 & 2033
- Table 99: ASEAN United State Car Insurance Market Revenue (Million) Forecast, by Application 2020 & 2033
- Table 100: ASEAN United State Car Insurance Market Volume (Billion) Forecast, by Application 2020 & 2033
- Table 101: Oceania United State Car Insurance Market Revenue (Million) Forecast, by Application 2020 & 2033
- Table 102: Oceania United State Car Insurance Market Volume (Billion) Forecast, by Application 2020 & 2033
- Table 103: Rest of Asia Pacific United State Car Insurance Market Revenue (Million) Forecast, by Application 2020 & 2033
- Table 104: Rest of Asia Pacific United State Car Insurance Market Volume (Billion) Forecast, by Application 2020 & 2033
Frequently Asked Questions
1. What is the projected Compound Annual Growth Rate (CAGR) of the United State Car Insurance Market?
The projected CAGR is approximately 4.21%.
2. Which companies are prominent players in the United State Car Insurance Market?
Key companies in the market include State Farm Mutual Automobile Insurance, Berkshire Hathaway Inc, Progressive Corp, Allstate Corp, USAA Insurance Group, Liberty Mutual, Farmers Insurance Group of Companies, Nationwide Mutual Group, American Family Insurance Group, Travelers Companies Inc **List Not Exhaustive.
3. What are the main segments of the United State Car Insurance Market?
The market segments include Coverage, Application, Distribution Channel.
4. Can you provide details about the market size?
The market size is estimated to be USD 194.15 Million as of 2022.
5. What are some drivers contributing to market growth?
Rising Number of Accidents Drives The Market; An increase in Road Traffic Accidents Drives The Market.
6. What are the notable trends driving market growth?
Rise In Number Of Traffic Accidents.
7. Are there any restraints impacting market growth?
Rising Number of Accidents Drives The Market; An increase in Road Traffic Accidents Drives The Market.
8. Can you provide examples of recent developments in the market?
August 2023: AXA S.A. introduced its latest digital claims solution, STeP, which simplifies the car insurance process.
9. What pricing options are available for accessing the report?
Pricing options include single-user, multi-user, and enterprise licenses priced at USD 3800, USD 4500, and USD 5800 respectively.
10. Is the market size provided in terms of value or volume?
The market size is provided in terms of value, measured in Million and volume, measured in Billion.
11. Are there any specific market keywords associated with the report?
Yes, the market keyword associated with the report is "United State Car Insurance Market," which aids in identifying and referencing the specific market segment covered.
12. How do I determine which pricing option suits my needs best?
The pricing options vary based on user requirements and access needs. Individual users may opt for single-user licenses, while businesses requiring broader access may choose multi-user or enterprise licenses for cost-effective access to the report.
13. Are there any additional resources or data provided in the United State Car Insurance Market report?
While the report offers comprehensive insights, it's advisable to review the specific contents or supplementary materials provided to ascertain if additional resources or data are available.
14. How can I stay updated on further developments or reports in the United State Car Insurance Market?
To stay informed about further developments, trends, and reports in the United State Car Insurance Market, consider subscribing to industry newsletters, following relevant companies and organizations, or regularly checking reputable industry news sources and publications.
Methodology
Step 1 - Identification of Relevant Samples Size from Population Database


Step 2 - Approaches for Defining Global Market Size (Value, Volume* & Price*)

Note*: In applicable scenarios
Step 3 - Data Sources
Primary Research
- Web Analytics
- Survey Reports
- Research Institute
- Latest Research Reports
- Opinion Leaders
Secondary Research
- Annual Reports
- White Paper
- Latest Press Release
- Industry Association
- Paid Database
- Investor Presentations

Step 4 - Data Triangulation
Involves using different sources of information in order to increase the validity of a study
These sources are likely to be stakeholders in a program - participants, other researchers, program staff, other community members, and so on.
Then we put all data in single framework & apply various statistical tools to find out the dynamic on the market.
During the analysis stage, feedback from the stakeholder groups would be compared to determine areas of agreement as well as areas of divergence