
Key Insights
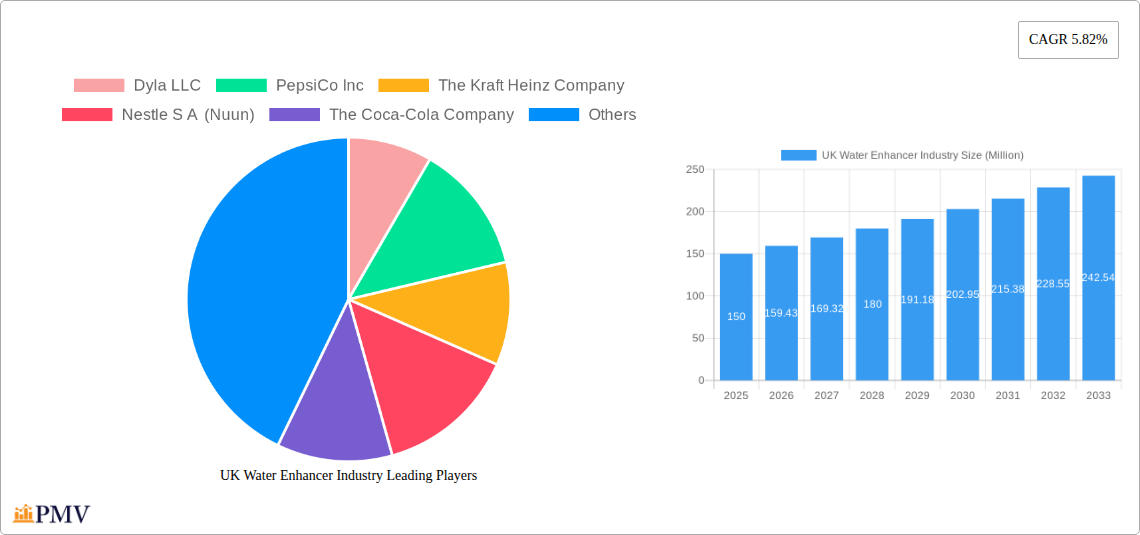
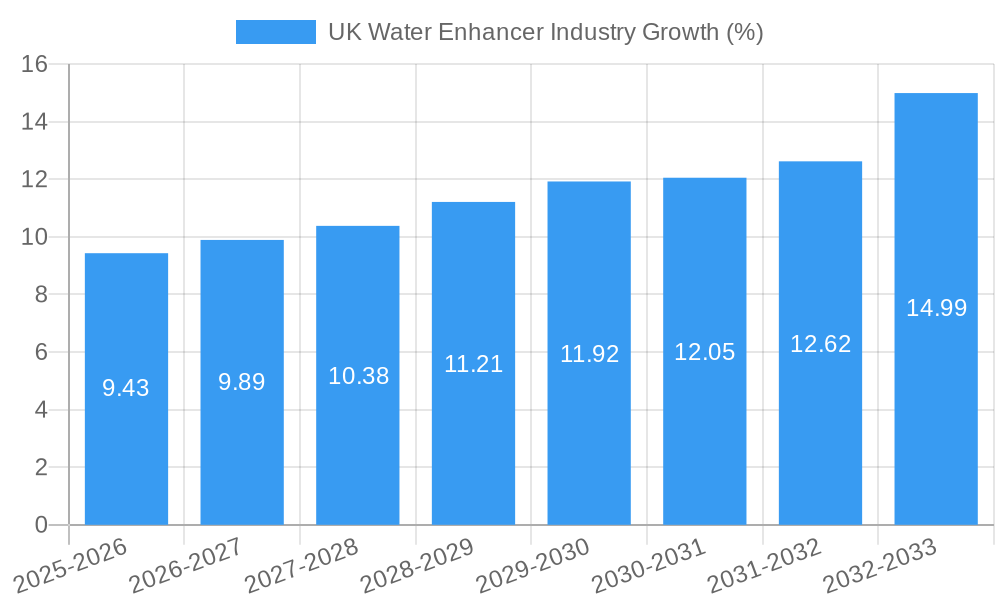
The UK water enhancer market, valued at approximately £150 million in 2025, is projected to experience robust growth, exhibiting a compound annual growth rate (CAGR) of 5.82% from 2025 to 2033. This expansion is fueled by several key factors. Firstly, the rising consumer awareness of health and wellness is driving demand for healthier beverage options, with water enhancers providing a low-calorie, low-sugar alternative to sugary drinks. Secondly, the increasing popularity of customized beverages allows consumers to tailor their drinks to their preferences, contributing to the market's appeal. The convenience of water enhancers, easily added to water at home or on-the-go, also contributes significantly to their growth. Finally, innovative product launches featuring a wider array of flavors and functional benefits, such as added vitamins or electrolytes, are attracting new customer segments.
However, the market faces certain challenges. Price sensitivity among consumers, particularly during economic uncertainty, could limit spending on premium water enhancers. Competition from established beverage companies with large marketing budgets also poses a significant hurdle for smaller players. Successfully navigating these challenges requires a strategic approach focused on value propositions, effective marketing targeting specific demographics, and building strong brand loyalty. Market segmentation reveals a robust presence across various distribution channels, including hypermarkets/supermarkets, convenience stores, and rapidly growing online retail platforms. Key players like PepsiCo, Nestle, and Coca-Cola, along with smaller niche brands, are vying for market share, showcasing the dynamic nature of this evolving market. The forecast period (2025-2033) is expected to witness significant innovation and further market consolidation, presenting both opportunities and challenges for existing and emerging players.
This comprehensive report provides an in-depth analysis of the UK water enhancer industry, offering invaluable insights for businesses, investors, and stakeholders. The report covers the period 2019-2033, with a focus on the estimated year 2025 and a forecast period spanning 2025-2033. Key players such as Dyla LLC, PepsiCo Inc, The Kraft Heinz Company, Nestle S.A (Nuun), The Coca-Cola Company, Jelsert (Starburst), Refresco, Wisdom Natural Brands, Exante Diet Ltd, and Britvic plc are analyzed for their market share, strategies, and innovation within the growing UK market. The total market value is estimated to reach £XX Million by 2033.
UK Water Enhancer Industry Market Structure & Competitive Dynamics
The UK water enhancer market exhibits a moderately consolidated structure, with key players such as PepsiCo, Nestle, and Britvic holding significant market share. However, the market also shows signs of fragmentation due to the emergence of smaller, niche players focusing on specialized flavors, functional ingredients, and sustainable packaging. Innovation is a key competitive differentiator, with companies constantly launching new products with unique flavor profiles, added vitamins, and natural ingredients. Regulatory frameworks surrounding food and beverage labeling and health claims are important considerations for market participants. The market also faces competition from other hydration options like ready-to-drink teas and fruit juices. Mergers and acquisitions (M&A) activity has been relatively low in recent years, with deal values estimated at approximately £XX Million in the past five years. This relatively low level of M&A activity indicates that companies are predominantly focusing on organic growth strategies to expand within the market.
- Market Concentration: Moderately consolidated, with major players holding a significant, but not dominant, share.
- Innovation Ecosystems: Active, with continuous product launches and innovation in flavors, functionality, and packaging.
- Regulatory Frameworks: Stringent, focusing on labeling, health claims, and ingredient regulations.
- Product Substitutes: Ready-to-drink teas, fruit juices, and other beverages.
- End-User Trends: Growing preference for healthier, functional beverages, and convenient formats.
- M&A Activity: Relatively low, with estimated deal values around £XX Million over the past five years.
UK Water Enhancer Industry Industry Trends & Insights
The UK water enhancer market is experiencing robust growth, driven by several key factors. The increasing health-conscious consumer base is a significant driver, with consumers seeking healthier alternatives to sugary drinks. The demand for convenient and portable hydration solutions is also fueling market expansion. Technological advancements in flavor creation and natural ingredient sourcing are contributing to the development of innovative products. Market penetration is currently at approximately XX%, with a projected Compound Annual Growth Rate (CAGR) of XX% during the forecast period (2025-2033). However, price sensitivity and the competitive landscape pose challenges to sustained growth. The market is witnessing a shift towards natural and organic ingredients, driving innovation in product formulations. This growing trend is expected to continue driving growth in the market throughout the forecast period.
Dominant Markets & Segments in UK Water Enhancer Industry
The Hypermarket/Supermarket channel currently dominates the UK water enhancer market, accounting for approximately XX% of total sales. This dominance is primarily attributed to high consumer footfall and established distribution networks. However, the online retail sector is rapidly gaining traction, fueled by increasing e-commerce adoption and the convenience it offers.
- Hypermarket/Supermarket:
- Key Drivers: High consumer footfall, established distribution networks, competitive pricing strategies.
- Convenience Store:
- Key Drivers: Location accessibility, impulse purchasing behavior, focus on smaller, portable packs.
- Online Retail Stores:
- Key Drivers: Growing e-commerce adoption, convenience of home delivery, expanding product ranges.
- Other Distribution Channels:
- Key Drivers: Direct-to-consumer sales, specialized retailers, foodservice channels.
UK Water Enhancer Industry Product Innovations
Recent innovations in the UK water enhancer market include the introduction of sugar-free options, functional formulations with added vitamins and minerals, and convenient portable formats such as stick packs and drops. Technological advancements in flavor technology and natural ingredient extraction are enabling the creation of more complex and appealing flavor profiles. These innovations cater to the growing demand for healthier and more convenient hydration options, aligning with broader consumer health and wellness trends.
Report Segmentation & Scope
This report segments the UK water enhancer market based on distribution channels: Hypermarket/Supermarket, Convenience Store, Online Retail Stores, and Other Distribution Channels. Each segment's market size, growth projections, and competitive dynamics are analyzed. The Hypermarket/Supermarket segment is expected to maintain its dominance, while online retail and convenience stores are projected to witness significant growth during the forecast period. "Other Distribution Channels" includes niche retailers and direct-to-consumer channels. The growth of this segment is dependent on market specific trends and niche product offerings.
Key Drivers of UK Water Enhancer Industry Growth
Several key factors contribute to the growth of the UK water enhancer industry:
- Health and Wellness Trends: The rising awareness of health and wellness among consumers drives demand for healthier alternatives to sugary drinks.
- Convenience: The increasing preference for convenient and portable hydration solutions fuels the growth of water enhancers in convenient formats.
- Technological Advancements: Innovations in flavor technology and natural ingredient sourcing create more appealing and functional products.
Challenges in the UK Water Enhancer Industry Sector
The UK water enhancer industry faces challenges such as:
- Intense Competition: The presence of numerous established players and new entrants creates fierce competition.
- Price Sensitivity: Consumers are often price-sensitive when choosing beverages, impacting profitability.
- Changing Consumer Preferences: Keeping pace with evolving consumer preferences in flavor and functionality is crucial.
Leading Players in the UK Water Enhancer Industry Market
- Dyla LLC
- PepsiCo Inc
- The Kraft Heinz Company
- Nestle S.A (Nuun)
- The Coca-Cola Company
- Jelsert (Starburst)
- Refresco
- Wisdom Natural Brands
- Exante Diet Ltd
- Britvic plc
Key Developments in UK Water Enhancer Industry Sector
- July 2021: Crème de la Cream launches Chupa Chups-flavored Lolly Drops water enhancers in the UK and other European markets. This leveraged brand recognition and introduced a unique flavor profile to the market.
- November 2021: Waterdrop introduces NERO, a natural energy water enhancer, highlighting the growing interest in functional beverages. This showcases innovation within the product category.
- April 2022: Britvic plc launches Robinsons Benefit Drops, vitamin-enhanced water enhancers, catering to health-conscious consumers. This introduction capitalized on the growing demand for functional beverages.
Strategic UK Water Enhancer Industry Market Outlook
The UK water enhancer market presents significant opportunities for growth in the coming years. Continued innovation in flavor profiles, functional ingredients, and sustainable packaging will be key to success. Focusing on health and wellness trends and catering to the demand for convenient hydration solutions will be crucial for capturing market share. The expanding online retail channel presents further potential for market expansion, alongside opportunities for companies to leverage established and emerging brands for co-branding and product diversification. The market is poised for continued expansion, driven by sustained consumer demand and ongoing product innovation.
UK Water Enhancer Industry Segmentation
-
1. Distribution Channel
- 1.1. Hypermarket/Supermarket
- 1.2. Convenience Store
- 1.3. Online Retails Stores
- 1.4. Other Distribution Channels
UK Water Enhancer Industry Segmentation By Geography
-
1. North America
- 1.1. United States
- 1.2. Canada
- 1.3. Mexico
-
2. South America
- 2.1. Brazil
- 2.2. Argentina
- 2.3. Rest of South America
-
3. Europe
- 3.1. United Kingdom
- 3.2. Germany
- 3.3. France
- 3.4. Italy
- 3.5. Spain
- 3.6. Russia
- 3.7. Benelux
- 3.8. Nordics
- 3.9. Rest of Europe
-
4. Middle East & Africa
- 4.1. Turkey
- 4.2. Israel
- 4.3. GCC
- 4.4. North Africa
- 4.5. South Africa
- 4.6. Rest of Middle East & Africa
-
5. Asia Pacific
- 5.1. China
- 5.2. India
- 5.3. Japan
- 5.4. South Korea
- 5.5. ASEAN
- 5.6. Oceania
- 5.7. Rest of Asia Pacific
UK Water Enhancer Industry REPORT HIGHLIGHTS
| Aspects | Details |
|---|---|
| Study Period | 2019-2033 |
| Base Year | 2024 |
| Estimated Year | 2025 |
| Forecast Period | 2025-2033 |
| Historical Period | 2019-2024 |
| Growth Rate | CAGR of 5.82% from 2019-2033 |
| Segmentation |
|
Table of Contents
- 1. Introduction
- 1.1. Research Scope
- 1.2. Market Segmentation
- 1.3. Research Methodology
- 1.4. Definitions and Assumptions
- 2. Executive Summary
- 2.1. Introduction
- 3. Market Dynamics
- 3.1. Introduction
- 3.2. Market Drivers
- 3.2.1. Rise of e-commerce has made it easier for consumers to access a wide variety of water enhancers
- 3.3. Market Restrains
- 3.3.1. Economic downturns or fluctuations in disposable income can impact consumer spending on non-essential products
- 3.4. Market Trends
- 3.4.1. Growing trend towards personalized nutrition and functional beverages supports the market for water enhancers
- 4. Market Factor Analysis
- 4.1. Porters Five Forces
- 4.2. Supply/Value Chain
- 4.3. PESTEL analysis
- 4.4. Market Entropy
- 4.5. Patent/Trademark Analysis
- 5. Global UK Water Enhancer Industry Analysis, Insights and Forecast, 2019-2031
- 5.1. Market Analysis, Insights and Forecast - by Distribution Channel
- 5.1.1. Hypermarket/Supermarket
- 5.1.2. Convenience Store
- 5.1.3. Online Retails Stores
- 5.1.4. Other Distribution Channels
- 5.2. Market Analysis, Insights and Forecast - by Region
- 5.2.1. North America
- 5.2.2. South America
- 5.2.3. Europe
- 5.2.4. Middle East & Africa
- 5.2.5. Asia Pacific
- 5.1. Market Analysis, Insights and Forecast - by Distribution Channel
- 6. North America UK Water Enhancer Industry Analysis, Insights and Forecast, 2019-2031
- 6.1. Market Analysis, Insights and Forecast - by Distribution Channel
- 6.1.1. Hypermarket/Supermarket
- 6.1.2. Convenience Store
- 6.1.3. Online Retails Stores
- 6.1.4. Other Distribution Channels
- 6.1. Market Analysis, Insights and Forecast - by Distribution Channel
- 7. South America UK Water Enhancer Industry Analysis, Insights and Forecast, 2019-2031
- 7.1. Market Analysis, Insights and Forecast - by Distribution Channel
- 7.1.1. Hypermarket/Supermarket
- 7.1.2. Convenience Store
- 7.1.3. Online Retails Stores
- 7.1.4. Other Distribution Channels
- 7.1. Market Analysis, Insights and Forecast - by Distribution Channel
- 8. Europe UK Water Enhancer Industry Analysis, Insights and Forecast, 2019-2031
- 8.1. Market Analysis, Insights and Forecast - by Distribution Channel
- 8.1.1. Hypermarket/Supermarket
- 8.1.2. Convenience Store
- 8.1.3. Online Retails Stores
- 8.1.4. Other Distribution Channels
- 8.1. Market Analysis, Insights and Forecast - by Distribution Channel
- 9. Middle East & Africa UK Water Enhancer Industry Analysis, Insights and Forecast, 2019-2031
- 9.1. Market Analysis, Insights and Forecast - by Distribution Channel
- 9.1.1. Hypermarket/Supermarket
- 9.1.2. Convenience Store
- 9.1.3. Online Retails Stores
- 9.1.4. Other Distribution Channels
- 9.1. Market Analysis, Insights and Forecast - by Distribution Channel
- 10. Asia Pacific UK Water Enhancer Industry Analysis, Insights and Forecast, 2019-2031
- 10.1. Market Analysis, Insights and Forecast - by Distribution Channel
- 10.1.1. Hypermarket/Supermarket
- 10.1.2. Convenience Store
- 10.1.3. Online Retails Stores
- 10.1.4. Other Distribution Channels
- 10.1. Market Analysis, Insights and Forecast - by Distribution Channel
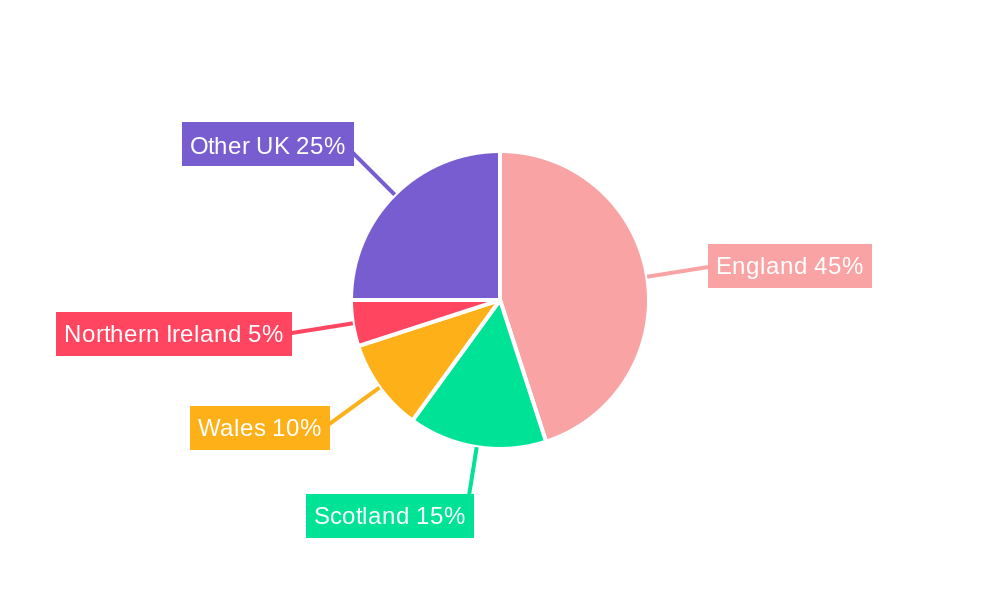
- 11. England UK Water Enhancer Industry Analysis, Insights and Forecast, 2019-2031
- 12. Wales UK Water Enhancer Industry Analysis, Insights and Forecast, 2019-2031
- 13. Scotland UK Water Enhancer Industry Analysis, Insights and Forecast, 2019-2031
- 14. Northern UK Water Enhancer Industry Analysis, Insights and Forecast, 2019-2031
- 15. Ireland UK Water Enhancer Industry Analysis, Insights and Forecast, 2019-2031
- 16. Competitive Analysis
- 16.1. Global Market Share Analysis 2024
- 16.2. Company Profiles
- 16.2.1 Dyla LLC
- 16.2.1.1. Overview
- 16.2.1.2. Products
- 16.2.1.3. SWOT Analysis
- 16.2.1.4. Recent Developments
- 16.2.1.5. Financials (Based on Availability)
- 16.2.2 PepsiCo Inc
- 16.2.2.1. Overview
- 16.2.2.2. Products
- 16.2.2.3. SWOT Analysis
- 16.2.2.4. Recent Developments
- 16.2.2.5. Financials (Based on Availability)
- 16.2.3 The Kraft Heinz Company
- 16.2.3.1. Overview
- 16.2.3.2. Products
- 16.2.3.3. SWOT Analysis
- 16.2.3.4. Recent Developments
- 16.2.3.5. Financials (Based on Availability)
- 16.2.4 Nestle S A (Nuun)
- 16.2.4.1. Overview
- 16.2.4.2. Products
- 16.2.4.3. SWOT Analysis
- 16.2.4.4. Recent Developments
- 16.2.4.5. Financials (Based on Availability)
- 16.2.5 The Coca-Cola Company
- 16.2.5.1. Overview
- 16.2.5.2. Products
- 16.2.5.3. SWOT Analysis
- 16.2.5.4. Recent Developments
- 16.2.5.5. Financials (Based on Availability)
- 16.2.6 Jelsert (Starburst)
- 16.2.6.1. Overview
- 16.2.6.2. Products
- 16.2.6.3. SWOT Analysis
- 16.2.6.4. Recent Developments
- 16.2.6.5. Financials (Based on Availability)
- 16.2.7 Refresco
- 16.2.7.1. Overview
- 16.2.7.2. Products
- 16.2.7.3. SWOT Analysis
- 16.2.7.4. Recent Developments
- 16.2.7.5. Financials (Based on Availability)
- 16.2.8 Wisdom Natural Brands
- 16.2.8.1. Overview
- 16.2.8.2. Products
- 16.2.8.3. SWOT Analysis
- 16.2.8.4. Recent Developments
- 16.2.8.5. Financials (Based on Availability)
- 16.2.9 Exante Diet Ltd
- 16.2.9.1. Overview
- 16.2.9.2. Products
- 16.2.9.3. SWOT Analysis
- 16.2.9.4. Recent Developments
- 16.2.9.5. Financials (Based on Availability)
- 16.2.10 Britvic plc
- 16.2.10.1. Overview
- 16.2.10.2. Products
- 16.2.10.3. SWOT Analysis
- 16.2.10.4. Recent Developments
- 16.2.10.5. Financials (Based on Availability)
- 16.2.1 Dyla LLC
List of Figures
- Figure 1: Global UK Water Enhancer Industry Revenue Breakdown (Million, %) by Region 2024 & 2032
- Figure 2: United kingdom Region UK Water Enhancer Industry Revenue (Million), by Country 2024 & 2032
- Figure 3: United kingdom Region UK Water Enhancer Industry Revenue Share (%), by Country 2024 & 2032
- Figure 4: North America UK Water Enhancer Industry Revenue (Million), by Distribution Channel 2024 & 2032
- Figure 5: North America UK Water Enhancer Industry Revenue Share (%), by Distribution Channel 2024 & 2032
- Figure 6: North America UK Water Enhancer Industry Revenue (Million), by Country 2024 & 2032
- Figure 7: North America UK Water Enhancer Industry Revenue Share (%), by Country 2024 & 2032
- Figure 8: South America UK Water Enhancer Industry Revenue (Million), by Distribution Channel 2024 & 2032
- Figure 9: South America UK Water Enhancer Industry Revenue Share (%), by Distribution Channel 2024 & 2032
- Figure 10: South America UK Water Enhancer Industry Revenue (Million), by Country 2024 & 2032
- Figure 11: South America UK Water Enhancer Industry Revenue Share (%), by Country 2024 & 2032
- Figure 12: Europe UK Water Enhancer Industry Revenue (Million), by Distribution Channel 2024 & 2032
- Figure 13: Europe UK Water Enhancer Industry Revenue Share (%), by Distribution Channel 2024 & 2032
- Figure 14: Europe UK Water Enhancer Industry Revenue (Million), by Country 2024 & 2032
- Figure 15: Europe UK Water Enhancer Industry Revenue Share (%), by Country 2024 & 2032
- Figure 16: Middle East & Africa UK Water Enhancer Industry Revenue (Million), by Distribution Channel 2024 & 2032
- Figure 17: Middle East & Africa UK Water Enhancer Industry Revenue Share (%), by Distribution Channel 2024 & 2032
- Figure 18: Middle East & Africa UK Water Enhancer Industry Revenue (Million), by Country 2024 & 2032
- Figure 19: Middle East & Africa UK Water Enhancer Industry Revenue Share (%), by Country 2024 & 2032
- Figure 20: Asia Pacific UK Water Enhancer Industry Revenue (Million), by Distribution Channel 2024 & 2032
- Figure 21: Asia Pacific UK Water Enhancer Industry Revenue Share (%), by Distribution Channel 2024 & 2032
- Figure 22: Asia Pacific UK Water Enhancer Industry Revenue (Million), by Country 2024 & 2032
- Figure 23: Asia Pacific UK Water Enhancer Industry Revenue Share (%), by Country 2024 & 2032
List of Tables
- Table 1: Global UK Water Enhancer Industry Revenue Million Forecast, by Region 2019 & 2032
- Table 2: Global UK Water Enhancer Industry Revenue Million Forecast, by Distribution Channel 2019 & 2032
- Table 3: Global UK Water Enhancer Industry Revenue Million Forecast, by Region 2019 & 2032
- Table 4: Global UK Water Enhancer Industry Revenue Million Forecast, by Country 2019 & 2032
- Table 5: England UK Water Enhancer Industry Revenue (Million) Forecast, by Application 2019 & 2032
- Table 6: Wales UK Water Enhancer Industry Revenue (Million) Forecast, by Application 2019 & 2032
- Table 7: Scotland UK Water Enhancer Industry Revenue (Million) Forecast, by Application 2019 & 2032
- Table 8: Northern UK Water Enhancer Industry Revenue (Million) Forecast, by Application 2019 & 2032
- Table 9: Ireland UK Water Enhancer Industry Revenue (Million) Forecast, by Application 2019 & 2032
- Table 10: Global UK Water Enhancer Industry Revenue Million Forecast, by Distribution Channel 2019 & 2032
- Table 11: Global UK Water Enhancer Industry Revenue Million Forecast, by Country 2019 & 2032
- Table 12: United States UK Water Enhancer Industry Revenue (Million) Forecast, by Application 2019 & 2032
- Table 13: Canada UK Water Enhancer Industry Revenue (Million) Forecast, by Application 2019 & 2032
- Table 14: Mexico UK Water Enhancer Industry Revenue (Million) Forecast, by Application 2019 & 2032
- Table 15: Global UK Water Enhancer Industry Revenue Million Forecast, by Distribution Channel 2019 & 2032
- Table 16: Global UK Water Enhancer Industry Revenue Million Forecast, by Country 2019 & 2032
- Table 17: Brazil UK Water Enhancer Industry Revenue (Million) Forecast, by Application 2019 & 2032
- Table 18: Argentina UK Water Enhancer Industry Revenue (Million) Forecast, by Application 2019 & 2032
- Table 19: Rest of South America UK Water Enhancer Industry Revenue (Million) Forecast, by Application 2019 & 2032
- Table 20: Global UK Water Enhancer Industry Revenue Million Forecast, by Distribution Channel 2019 & 2032
- Table 21: Global UK Water Enhancer Industry Revenue Million Forecast, by Country 2019 & 2032
- Table 22: United Kingdom UK Water Enhancer Industry Revenue (Million) Forecast, by Application 2019 & 2032
- Table 23: Germany UK Water Enhancer Industry Revenue (Million) Forecast, by Application 2019 & 2032
- Table 24: France UK Water Enhancer Industry Revenue (Million) Forecast, by Application 2019 & 2032
- Table 25: Italy UK Water Enhancer Industry Revenue (Million) Forecast, by Application 2019 & 2032
- Table 26: Spain UK Water Enhancer Industry Revenue (Million) Forecast, by Application 2019 & 2032
- Table 27: Russia UK Water Enhancer Industry Revenue (Million) Forecast, by Application 2019 & 2032
- Table 28: Benelux UK Water Enhancer Industry Revenue (Million) Forecast, by Application 2019 & 2032
- Table 29: Nordics UK Water Enhancer Industry Revenue (Million) Forecast, by Application 2019 & 2032
- Table 30: Rest of Europe UK Water Enhancer Industry Revenue (Million) Forecast, by Application 2019 & 2032
- Table 31: Global UK Water Enhancer Industry Revenue Million Forecast, by Distribution Channel 2019 & 2032
- Table 32: Global UK Water Enhancer Industry Revenue Million Forecast, by Country 2019 & 2032
- Table 33: Turkey UK Water Enhancer Industry Revenue (Million) Forecast, by Application 2019 & 2032
- Table 34: Israel UK Water Enhancer Industry Revenue (Million) Forecast, by Application 2019 & 2032
- Table 35: GCC UK Water Enhancer Industry Revenue (Million) Forecast, by Application 2019 & 2032
- Table 36: North Africa UK Water Enhancer Industry Revenue (Million) Forecast, by Application 2019 & 2032
- Table 37: South Africa UK Water Enhancer Industry Revenue (Million) Forecast, by Application 2019 & 2032
- Table 38: Rest of Middle East & Africa UK Water Enhancer Industry Revenue (Million) Forecast, by Application 2019 & 2032
- Table 39: Global UK Water Enhancer Industry Revenue Million Forecast, by Distribution Channel 2019 & 2032
- Table 40: Global UK Water Enhancer Industry Revenue Million Forecast, by Country 2019 & 2032
- Table 41: China UK Water Enhancer Industry Revenue (Million) Forecast, by Application 2019 & 2032
- Table 42: India UK Water Enhancer Industry Revenue (Million) Forecast, by Application 2019 & 2032
- Table 43: Japan UK Water Enhancer Industry Revenue (Million) Forecast, by Application 2019 & 2032
- Table 44: South Korea UK Water Enhancer Industry Revenue (Million) Forecast, by Application 2019 & 2032
- Table 45: ASEAN UK Water Enhancer Industry Revenue (Million) Forecast, by Application 2019 & 2032
- Table 46: Oceania UK Water Enhancer Industry Revenue (Million) Forecast, by Application 2019 & 2032
- Table 47: Rest of Asia Pacific UK Water Enhancer Industry Revenue (Million) Forecast, by Application 2019 & 2032
Frequently Asked Questions
1. What is the projected Compound Annual Growth Rate (CAGR) of the UK Water Enhancer Industry?
The projected CAGR is approximately 5.82%.
2. Which companies are prominent players in the UK Water Enhancer Industry?
Key companies in the market include Dyla LLC, PepsiCo Inc, The Kraft Heinz Company, Nestle S A (Nuun), The Coca-Cola Company, Jelsert (Starburst), Refresco, Wisdom Natural Brands, Exante Diet Ltd, Britvic plc.
3. What are the main segments of the UK Water Enhancer Industry?
The market segments include Distribution Channel.
4. Can you provide details about the market size?
The market size is estimated to be USD XX Million as of 2022.
5. What are some drivers contributing to market growth?
Rise of e-commerce has made it easier for consumers to access a wide variety of water enhancers.
6. What are the notable trends driving market growth?
Growing trend towards personalized nutrition and functional beverages supports the market for water enhancers.
7. Are there any restraints impacting market growth?
Economic downturns or fluctuations in disposable income can impact consumer spending on non-essential products.
8. Can you provide examples of recent developments in the market?
In April 2022, Robinsons, a brand of Britvic plc launched water enhancer new Benefit Drops with added vitamins in four different flavors. Benefit drops are the perfect portable format for consumers on the go as they deliver great taste and additional vitamins in their water consumption.
9. What pricing options are available for accessing the report?
Pricing options include single-user, multi-user, and enterprise licenses priced at USD 3800, USD 4500, and USD 5800 respectively.
10. Is the market size provided in terms of value or volume?
The market size is provided in terms of value, measured in Million.
11. Are there any specific market keywords associated with the report?
Yes, the market keyword associated with the report is "UK Water Enhancer Industry," which aids in identifying and referencing the specific market segment covered.
12. How do I determine which pricing option suits my needs best?
The pricing options vary based on user requirements and access needs. Individual users may opt for single-user licenses, while businesses requiring broader access may choose multi-user or enterprise licenses for cost-effective access to the report.
13. Are there any additional resources or data provided in the UK Water Enhancer Industry report?
While the report offers comprehensive insights, it's advisable to review the specific contents or supplementary materials provided to ascertain if additional resources or data are available.
14. How can I stay updated on further developments or reports in the UK Water Enhancer Industry?
To stay informed about further developments, trends, and reports in the UK Water Enhancer Industry, consider subscribing to industry newsletters, following relevant companies and organizations, or regularly checking reputable industry news sources and publications.
Methodology
Step 1 - Identification of Relevant Samples Size from Population Database


Step 2 - Approaches for Defining Global Market Size (Value, Volume* & Price*)

Note*: In applicable scenarios
Step 3 - Data Sources
Primary Research
- Web Analytics
- Survey Reports
- Research Institute
- Latest Research Reports
- Opinion Leaders
Secondary Research
- Annual Reports
- White Paper
- Latest Press Release
- Industry Association
- Paid Database
- Investor Presentations

Step 4 - Data Triangulation
Involves using different sources of information in order to increase the validity of a study
These sources are likely to be stakeholders in a program - participants, other researchers, program staff, other community members, and so on.
Then we put all data in single framework & apply various statistical tools to find out the dynamic on the market.
During the analysis stage, feedback from the stakeholder groups would be compared to determine areas of agreement as well as areas of divergence


