
Key Insights
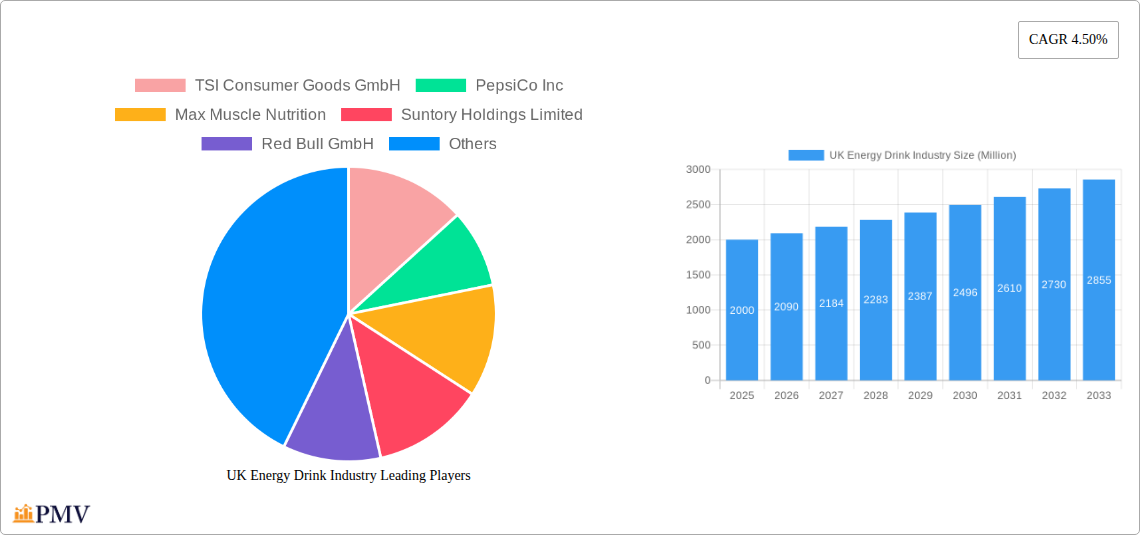
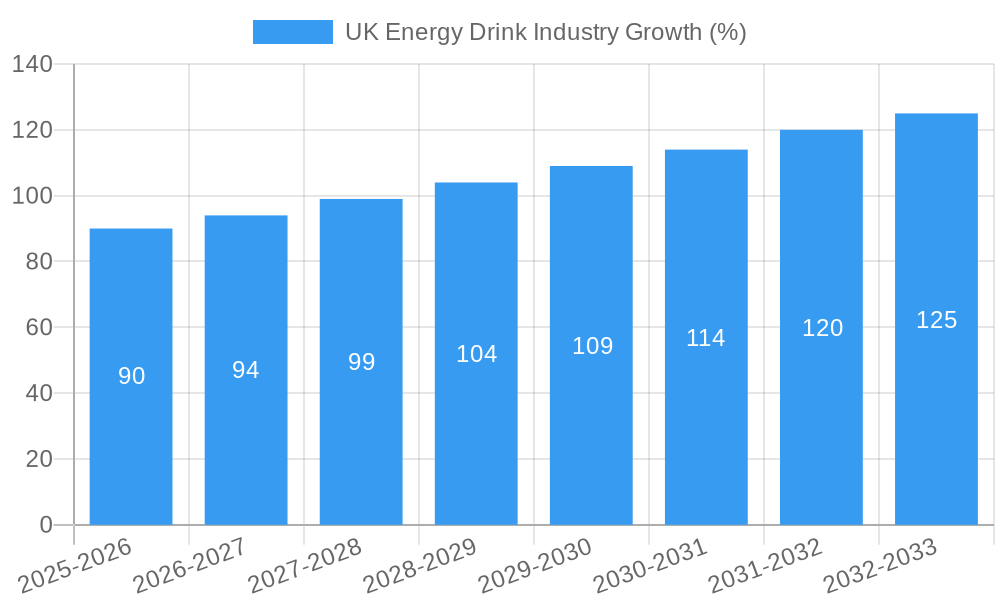
The UK energy drink market, valued at approximately £2 billion in 2025, is projected to experience robust growth, with a compound annual growth rate (CAGR) of 4.5% from 2025 to 2033. This expansion is fueled by several key factors. The increasing prevalence of busy lifestyles and demanding work schedules among young adults and professionals is driving demand for quick energy boosts. Health-conscious trends are also influencing the market, with a growing preference for low-sugar and functional energy drinks containing natural ingredients and added vitamins. The diversification of product offerings, including functional energy drinks targeting specific needs like enhanced focus or improved athletic performance, further contributes to market growth. Distribution channels are also evolving, with online retail experiencing significant growth alongside traditional supermarkets and convenience stores. However, concerns surrounding the high sugar content and potential negative health effects of excessive energy drink consumption pose a restraint on market growth. Regulatory pressures and increasing consumer awareness of health implications will likely lead manufacturers to innovate with healthier formulations and transparent labeling. The market segmentation reflects these trends, with PET bottles gaining popularity over cans due to convenience and perceived eco-friendliness for certain brands. Drinks and shots remain dominant product types, but mixers are showcasing notable growth as consumers seek more sophisticated and versatile beverage options.
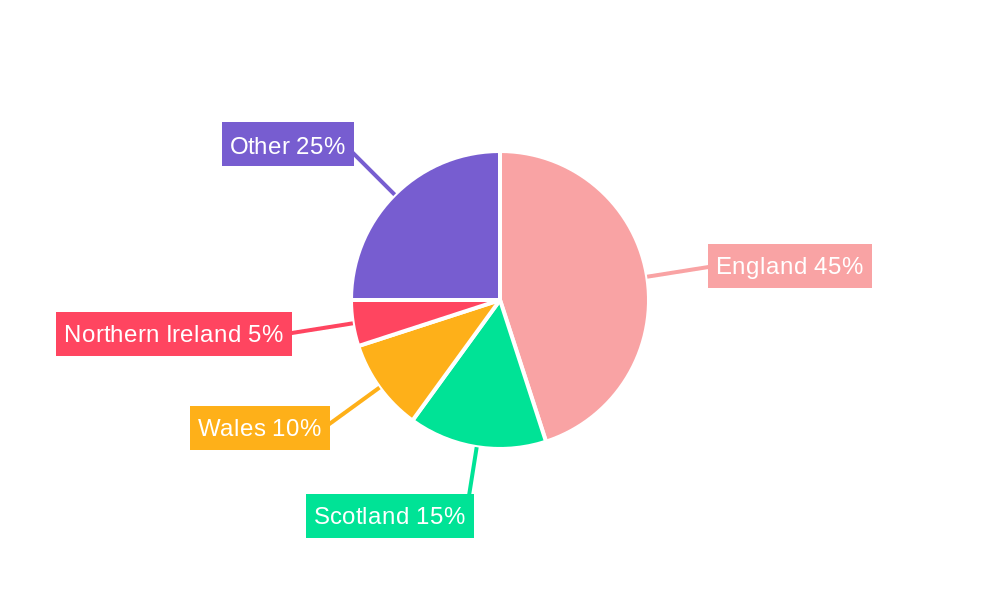
The competitive landscape is dominated by established multinational players such as Coca-Cola, PepsiCo, and Red Bull, along with regional and emerging brands vying for market share. These companies are investing heavily in marketing and product innovation to cater to evolving consumer preferences. The regional distribution within the UK shows a relatively even spread across England, Wales, Scotland, and Northern Ireland, although regional variations in consumption patterns might exist. The continued success of the UK energy drink market will hinge on the ability of manufacturers to successfully navigate the evolving consumer landscape, balancing the demand for convenient energy boosts with growing health and wellness concerns. This requires strategic focus on product development, targeted marketing, and a commitment to sustainability and ethical sourcing.
UK Energy Drink Industry: A Comprehensive Market Report (2019-2033)
This in-depth report provides a comprehensive analysis of the UK energy drink industry, offering invaluable insights for businesses, investors, and stakeholders. Covering the period 2019-2033, with a focus on 2025, this report meticulously examines market trends, competitive dynamics, and future growth potential. The report leverages extensive data analysis to provide actionable insights and forecasts, enabling informed decision-making within this dynamic sector.
UK Energy Drink Industry Market Structure & Competitive Dynamics
The UK energy drink market is characterized by a high level of competition, with both multinational giants and emerging brands vying for market share. Market concentration is relatively high, with a few major players dominating the landscape. However, the emergence of innovative, healthier alternatives is challenging the established order. The regulatory framework, particularly concerning sugar content and marketing to young people, plays a significant role in shaping the competitive dynamics. Product substitutes, such as coffee and functional beverages, also exert pressure on the market.
- Market Share: Red Bull and Monster Energy hold significant market share, estimated at xx% and xx% respectively in 2025. Coca-Cola and PepsiCo also command substantial portions of the market through their respective energy drink brands.
- M&A Activity: The industry has witnessed significant M&A activity in recent years, with deal values totaling an estimated £xx Million in the period 2019-2024. These mergers and acquisitions have often involved larger companies acquiring smaller, more innovative players to expand their product portfolios and enhance their market positions.
- Innovation Ecosystems: A vibrant ecosystem of startups and smaller companies is driving innovation in areas such as natural ingredients, functional benefits, and sustainable packaging. This leads to increased product differentiation and competition.
- End-User Trends: Growing health consciousness and demand for healthier alternatives are driving the growth of low-sugar and plant-based energy drinks.
UK Energy Drink Industry Industry Trends & Insights
The UK energy drink market exhibits strong growth, driven by several key factors. The increasing demand for convenient and functional beverages fuels expansion. Changing lifestyles, particularly among young adults, contribute significantly to market growth. Health concerns surrounding sugar content have also shaped the market, fostering innovation in healthier formulations. The market is witnessing technological disruptions, with the rise of sustainable packaging and personalized product offerings.
- CAGR: The market is projected to register a CAGR of xx% during the forecast period (2025-2033).
- Market Penetration: The penetration rate of energy drinks in the UK is estimated at xx% in 2025, with potential for further expansion.
- Consumer Preferences: Consumers increasingly seek natural, low-sugar, and functional energy drinks. This trend is driving innovation in product formulation and marketing.
Dominant Markets & Segments in UK Energy Drink Industry
The UK energy drink market shows strong growth across all segments, but certain areas exhibit greater dominance.
By Packaging Type:
- Cans: Cans continue to dominate, driven by their portability, convenience, and established consumer preference.
- PET Bottles: PET bottles are gaining traction, particularly for larger formats and at home consumption.
By Product Type:
- Drinks: Traditional energy drinks remain the largest segment.
- Shots: Shots are gaining popularity for their convenience and quick energy boost.
- Mixers: Mixers, allowing for customization and reduced sugar intake, are a growing niche.
By Distribution Channel:
- Supermarkets/Hypermarkets: These channels remain the primary distribution route for energy drinks.
- Convenience Stores: Convenience stores play a crucial role in impulse purchases.
- Specialist Stores: Specialist stores cater to niche segments and drive specific product innovation.
- Online Retail Stores: Online sales are growing steadily.
- Other Distribution Channels: This includes cafes, restaurants, and gyms.
Key Drivers: Strong economic growth, robust retail infrastructure, and a young and active population contribute to the market's success. Government policies on food and beverage regulations also affect the market.
UK Energy Drink Industry Product Innovations
Recent product innovations focus on healthier formulations, including low-sugar, natural, and plant-based options. Companies are also experimenting with new flavors and functional ingredients to cater to evolving consumer preferences. Technological advancements in packaging, such as sustainable materials and innovative designs, are also shaping the market. This focus on health-conscious, ethically sourced ingredients resonates strongly with a growing segment of environmentally and health-aware consumers.
Report Segmentation & Scope
This report segments the UK energy drink market by packaging type (can, PET bottle), product type (drinks, shots, mixers), and distribution channel (supermarkets/hypermarkets, convenience stores, specialist stores, online retail stores, other distribution channels). Each segment's growth projections, market size, and competitive dynamics are thoroughly analyzed across the historical (2019-2024), base (2025), and forecast (2025-2033) periods.
Key Drivers of UK Energy Drink Industry Growth
The UK energy drink market growth is propelled by several factors: the increasing demand for convenient and functional beverages, the rising disposable incomes among young adults, and the expanding health-conscious consumer base seeking healthier alternatives. Innovative product launches featuring natural ingredients and functional benefits further fuel this growth.
Challenges in the UK Energy Drink Industry Sector
The UK energy drink industry faces challenges including increasing regulatory scrutiny concerning sugar content and marketing, supply chain disruptions impacting ingredient sourcing and packaging, and the intensifying competition from both established players and emerging brands. These factors can create considerable variability in both the supply and demand for the product.
Leading Players in the UK Energy Drink Industry Market
- TSI Consumer Goods GmbH
- PepsiCo Inc
- Max Muscle Nutrition
- Suntory Holdings Limited
- Red Bull GmbH
- The Coca-Cola Company
- Nestle SA
- Global Trade Holdings Co Ltd
- Monster Energy Company
- GlaxoSmithKline PLC
Key Developments in UK Energy Drink Industry Sector
- September 2022: Launch of Virtue Clean Energy, a zero-sugar, zero-calorie energy drink with natural ingredients.
- June 2022: Tenzing launched two new plant-based energy shot blends.
- March 2022: PerfectTed launched a range of canned natural energy drinks powered by matcha green tea.
These launches reflect the growing consumer demand for healthier and more sustainable energy drink options.
Strategic UK Energy Drink Industry Market Outlook
The UK energy drink market presents significant opportunities for growth, particularly in the segments of healthier and more sustainable products. Strategic partnerships, innovative product development, and targeted marketing campaigns will be crucial for success. Focusing on consumer preferences for natural ingredients, functional benefits, and sustainable packaging will be key to capturing market share in this evolving landscape. The market is expected to continue its robust growth trajectory in the coming years, driven by changing consumer preferences and technological advancements.
UK Energy Drink Industry Segmentation
-
1. Packaging Type
- 1.1. Can
- 1.2. PET Bottle
-
2. Product Type
- 2.1. Drinks
- 2.2. Shots
- 2.3. Mixers
-
3. Distribution Channel
- 3.1. Supermarkets/Hypermarkets
- 3.2. Convenience Stores
- 3.3. Specalist Stores
- 3.4. Online Retail Stores
- 3.5. Other Distribution Channels
UK Energy Drink Industry Segmentation By Geography
-
1. North America
- 1.1. United States
- 1.2. Canada
- 1.3. Mexico
-
2. South America
- 2.1. Brazil
- 2.2. Argentina
- 2.3. Rest of South America
-
3. Europe
- 3.1. United Kingdom
- 3.2. Germany
- 3.3. France
- 3.4. Italy
- 3.5. Spain
- 3.6. Russia
- 3.7. Benelux
- 3.8. Nordics
- 3.9. Rest of Europe
-
4. Middle East & Africa
- 4.1. Turkey
- 4.2. Israel
- 4.3. GCC
- 4.4. North Africa
- 4.5. South Africa
- 4.6. Rest of Middle East & Africa
-
5. Asia Pacific
- 5.1. China
- 5.2. India
- 5.3. Japan
- 5.4. South Korea
- 5.5. ASEAN
- 5.6. Oceania
- 5.7. Rest of Asia Pacific
UK Energy Drink Industry REPORT HIGHLIGHTS
| Aspects | Details |
|---|---|
| Study Period | 2019-2033 |
| Base Year | 2024 |
| Estimated Year | 2025 |
| Forecast Period | 2025-2033 |
| Historical Period | 2019-2024 |
| Growth Rate | CAGR of 4.50% from 2019-2033 |
| Segmentation |
|
Table of Contents
- 1. Introduction
- 1.1. Research Scope
- 1.2. Market Segmentation
- 1.3. Research Methodology
- 1.4. Definitions and Assumptions
- 2. Executive Summary
- 2.1. Introduction
- 3. Market Dynamics
- 3.1. Introduction
- 3.2. Market Drivers
- 3.2.1. Rising Health & Wellness Trends; Strategic Initiatives By Key Players
- 3.3. Market Restrains
- 3.3.1. Cost Considerations Coupled With Availability Of Alternatives
- 3.4. Market Trends
- 3.4.1. The Drinks Segment Dominates the Energy Drink Market
- 4. Market Factor Analysis
- 4.1. Porters Five Forces
- 4.2. Supply/Value Chain
- 4.3. PESTEL analysis
- 4.4. Market Entropy
- 4.5. Patent/Trademark Analysis
- 5. Global UK Energy Drink Industry Analysis, Insights and Forecast, 2019-2031
- 5.1. Market Analysis, Insights and Forecast - by Packaging Type
- 5.1.1. Can
- 5.1.2. PET Bottle
- 5.2. Market Analysis, Insights and Forecast - by Product Type
- 5.2.1. Drinks
- 5.2.2. Shots
- 5.2.3. Mixers
- 5.3. Market Analysis, Insights and Forecast - by Distribution Channel
- 5.3.1. Supermarkets/Hypermarkets
- 5.3.2. Convenience Stores
- 5.3.3. Specalist Stores
- 5.3.4. Online Retail Stores
- 5.3.5. Other Distribution Channels
- 5.4. Market Analysis, Insights and Forecast - by Region
- 5.4.1. North America
- 5.4.2. South America
- 5.4.3. Europe
- 5.4.4. Middle East & Africa
- 5.4.5. Asia Pacific
- 5.1. Market Analysis, Insights and Forecast - by Packaging Type
- 6. North America UK Energy Drink Industry Analysis, Insights and Forecast, 2019-2031
- 6.1. Market Analysis, Insights and Forecast - by Packaging Type
- 6.1.1. Can
- 6.1.2. PET Bottle
- 6.2. Market Analysis, Insights and Forecast - by Product Type
- 6.2.1. Drinks
- 6.2.2. Shots
- 6.2.3. Mixers
- 6.3. Market Analysis, Insights and Forecast - by Distribution Channel
- 6.3.1. Supermarkets/Hypermarkets
- 6.3.2. Convenience Stores
- 6.3.3. Specalist Stores
- 6.3.4. Online Retail Stores
- 6.3.5. Other Distribution Channels
- 6.1. Market Analysis, Insights and Forecast - by Packaging Type
- 7. South America UK Energy Drink Industry Analysis, Insights and Forecast, 2019-2031
- 7.1. Market Analysis, Insights and Forecast - by Packaging Type
- 7.1.1. Can
- 7.1.2. PET Bottle
- 7.2. Market Analysis, Insights and Forecast - by Product Type
- 7.2.1. Drinks
- 7.2.2. Shots
- 7.2.3. Mixers
- 7.3. Market Analysis, Insights and Forecast - by Distribution Channel
- 7.3.1. Supermarkets/Hypermarkets
- 7.3.2. Convenience Stores
- 7.3.3. Specalist Stores
- 7.3.4. Online Retail Stores
- 7.3.5. Other Distribution Channels
- 7.1. Market Analysis, Insights and Forecast - by Packaging Type
- 8. Europe UK Energy Drink Industry Analysis, Insights and Forecast, 2019-2031
- 8.1. Market Analysis, Insights and Forecast - by Packaging Type
- 8.1.1. Can
- 8.1.2. PET Bottle
- 8.2. Market Analysis, Insights and Forecast - by Product Type
- 8.2.1. Drinks
- 8.2.2. Shots
- 8.2.3. Mixers
- 8.3. Market Analysis, Insights and Forecast - by Distribution Channel
- 8.3.1. Supermarkets/Hypermarkets
- 8.3.2. Convenience Stores
- 8.3.3. Specalist Stores
- 8.3.4. Online Retail Stores
- 8.3.5. Other Distribution Channels
- 8.1. Market Analysis, Insights and Forecast - by Packaging Type
- 9. Middle East & Africa UK Energy Drink Industry Analysis, Insights and Forecast, 2019-2031
- 9.1. Market Analysis, Insights and Forecast - by Packaging Type
- 9.1.1. Can
- 9.1.2. PET Bottle
- 9.2. Market Analysis, Insights and Forecast - by Product Type
- 9.2.1. Drinks
- 9.2.2. Shots
- 9.2.3. Mixers
- 9.3. Market Analysis, Insights and Forecast - by Distribution Channel
- 9.3.1. Supermarkets/Hypermarkets
- 9.3.2. Convenience Stores
- 9.3.3. Specalist Stores
- 9.3.4. Online Retail Stores
- 9.3.5. Other Distribution Channels
- 9.1. Market Analysis, Insights and Forecast - by Packaging Type
- 10. Asia Pacific UK Energy Drink Industry Analysis, Insights and Forecast, 2019-2031
- 10.1. Market Analysis, Insights and Forecast - by Packaging Type
- 10.1.1. Can
- 10.1.2. PET Bottle
- 10.2. Market Analysis, Insights and Forecast - by Product Type
- 10.2.1. Drinks
- 10.2.2. Shots
- 10.2.3. Mixers
- 10.3. Market Analysis, Insights and Forecast - by Distribution Channel
- 10.3.1. Supermarkets/Hypermarkets
- 10.3.2. Convenience Stores
- 10.3.3. Specalist Stores
- 10.3.4. Online Retail Stores
- 10.3.5. Other Distribution Channels
- 10.1. Market Analysis, Insights and Forecast - by Packaging Type
- 11. England UK Energy Drink Industry Analysis, Insights and Forecast, 2019-2031
- 12. Wales UK Energy Drink Industry Analysis, Insights and Forecast, 2019-2031
- 13. Scotland UK Energy Drink Industry Analysis, Insights and Forecast, 2019-2031
- 14. Northern UK Energy Drink Industry Analysis, Insights and Forecast, 2019-2031
- 15. Ireland UK Energy Drink Industry Analysis, Insights and Forecast, 2019-2031
- 16. Competitive Analysis
- 16.1. Global Market Share Analysis 2024
- 16.2. Company Profiles
- 16.2.1 TSI Consumer Goods GmbH
- 16.2.1.1. Overview
- 16.2.1.2. Products
- 16.2.1.3. SWOT Analysis
- 16.2.1.4. Recent Developments
- 16.2.1.5. Financials (Based on Availability)
- 16.2.2 PepsiCo Inc
- 16.2.2.1. Overview
- 16.2.2.2. Products
- 16.2.2.3. SWOT Analysis
- 16.2.2.4. Recent Developments
- 16.2.2.5. Financials (Based on Availability)
- 16.2.3 Max Muscle Nutrition
- 16.2.3.1. Overview
- 16.2.3.2. Products
- 16.2.3.3. SWOT Analysis
- 16.2.3.4. Recent Developments
- 16.2.3.5. Financials (Based on Availability)
- 16.2.4 Suntory Holdings Limited
- 16.2.4.1. Overview
- 16.2.4.2. Products
- 16.2.4.3. SWOT Analysis
- 16.2.4.4. Recent Developments
- 16.2.4.5. Financials (Based on Availability)
- 16.2.5 Red Bull GmbH
- 16.2.5.1. Overview
- 16.2.5.2. Products
- 16.2.5.3. SWOT Analysis
- 16.2.5.4. Recent Developments
- 16.2.5.5. Financials (Based on Availability)
- 16.2.6 The Coca-Cola Company
- 16.2.6.1. Overview
- 16.2.6.2. Products
- 16.2.6.3. SWOT Analysis
- 16.2.6.4. Recent Developments
- 16.2.6.5. Financials (Based on Availability)
- 16.2.7 Nestle SA*List Not Exhaustive
- 16.2.7.1. Overview
- 16.2.7.2. Products
- 16.2.7.3. SWOT Analysis
- 16.2.7.4. Recent Developments
- 16.2.7.5. Financials (Based on Availability)
- 16.2.8 Global Trade Holdings Co Ltd
- 16.2.8.1. Overview
- 16.2.8.2. Products
- 16.2.8.3. SWOT Analysis
- 16.2.8.4. Recent Developments
- 16.2.8.5. Financials (Based on Availability)
- 16.2.9 Monster Energy Company
- 16.2.9.1. Overview
- 16.2.9.2. Products
- 16.2.9.3. SWOT Analysis
- 16.2.9.4. Recent Developments
- 16.2.9.5. Financials (Based on Availability)
- 16.2.10 GlaxoSmithKline PLC
- 16.2.10.1. Overview
- 16.2.10.2. Products
- 16.2.10.3. SWOT Analysis
- 16.2.10.4. Recent Developments
- 16.2.10.5. Financials (Based on Availability)
- 16.2.1 TSI Consumer Goods GmbH
List of Figures
- Figure 1: Global UK Energy Drink Industry Revenue Breakdown (Million, %) by Region 2024 & 2032
- Figure 2: Global UK Energy Drink Industry Volume Breakdown (K Liters, %) by Region 2024 & 2032
- Figure 3: United kingdom Region UK Energy Drink Industry Revenue (Million), by Country 2024 & 2032
- Figure 4: United kingdom Region UK Energy Drink Industry Volume (K Liters), by Country 2024 & 2032
- Figure 5: United kingdom Region UK Energy Drink Industry Revenue Share (%), by Country 2024 & 2032
- Figure 6: United kingdom Region UK Energy Drink Industry Volume Share (%), by Country 2024 & 2032
- Figure 7: North America UK Energy Drink Industry Revenue (Million), by Packaging Type 2024 & 2032
- Figure 8: North America UK Energy Drink Industry Volume (K Liters), by Packaging Type 2024 & 2032
- Figure 9: North America UK Energy Drink Industry Revenue Share (%), by Packaging Type 2024 & 2032
- Figure 10: North America UK Energy Drink Industry Volume Share (%), by Packaging Type 2024 & 2032
- Figure 11: North America UK Energy Drink Industry Revenue (Million), by Product Type 2024 & 2032
- Figure 12: North America UK Energy Drink Industry Volume (K Liters), by Product Type 2024 & 2032
- Figure 13: North America UK Energy Drink Industry Revenue Share (%), by Product Type 2024 & 2032
- Figure 14: North America UK Energy Drink Industry Volume Share (%), by Product Type 2024 & 2032
- Figure 15: North America UK Energy Drink Industry Revenue (Million), by Distribution Channel 2024 & 2032
- Figure 16: North America UK Energy Drink Industry Volume (K Liters), by Distribution Channel 2024 & 2032
- Figure 17: North America UK Energy Drink Industry Revenue Share (%), by Distribution Channel 2024 & 2032
- Figure 18: North America UK Energy Drink Industry Volume Share (%), by Distribution Channel 2024 & 2032
- Figure 19: North America UK Energy Drink Industry Revenue (Million), by Country 2024 & 2032
- Figure 20: North America UK Energy Drink Industry Volume (K Liters), by Country 2024 & 2032
- Figure 21: North America UK Energy Drink Industry Revenue Share (%), by Country 2024 & 2032
- Figure 22: North America UK Energy Drink Industry Volume Share (%), by Country 2024 & 2032
- Figure 23: South America UK Energy Drink Industry Revenue (Million), by Packaging Type 2024 & 2032
- Figure 24: South America UK Energy Drink Industry Volume (K Liters), by Packaging Type 2024 & 2032
- Figure 25: South America UK Energy Drink Industry Revenue Share (%), by Packaging Type 2024 & 2032
- Figure 26: South America UK Energy Drink Industry Volume Share (%), by Packaging Type 2024 & 2032
- Figure 27: South America UK Energy Drink Industry Revenue (Million), by Product Type 2024 & 2032
- Figure 28: South America UK Energy Drink Industry Volume (K Liters), by Product Type 2024 & 2032
- Figure 29: South America UK Energy Drink Industry Revenue Share (%), by Product Type 2024 & 2032
- Figure 30: South America UK Energy Drink Industry Volume Share (%), by Product Type 2024 & 2032
- Figure 31: South America UK Energy Drink Industry Revenue (Million), by Distribution Channel 2024 & 2032
- Figure 32: South America UK Energy Drink Industry Volume (K Liters), by Distribution Channel 2024 & 2032
- Figure 33: South America UK Energy Drink Industry Revenue Share (%), by Distribution Channel 2024 & 2032
- Figure 34: South America UK Energy Drink Industry Volume Share (%), by Distribution Channel 2024 & 2032
- Figure 35: South America UK Energy Drink Industry Revenue (Million), by Country 2024 & 2032
- Figure 36: South America UK Energy Drink Industry Volume (K Liters), by Country 2024 & 2032
- Figure 37: South America UK Energy Drink Industry Revenue Share (%), by Country 2024 & 2032
- Figure 38: South America UK Energy Drink Industry Volume Share (%), by Country 2024 & 2032
- Figure 39: Europe UK Energy Drink Industry Revenue (Million), by Packaging Type 2024 & 2032
- Figure 40: Europe UK Energy Drink Industry Volume (K Liters), by Packaging Type 2024 & 2032
- Figure 41: Europe UK Energy Drink Industry Revenue Share (%), by Packaging Type 2024 & 2032
- Figure 42: Europe UK Energy Drink Industry Volume Share (%), by Packaging Type 2024 & 2032
- Figure 43: Europe UK Energy Drink Industry Revenue (Million), by Product Type 2024 & 2032
- Figure 44: Europe UK Energy Drink Industry Volume (K Liters), by Product Type 2024 & 2032
- Figure 45: Europe UK Energy Drink Industry Revenue Share (%), by Product Type 2024 & 2032
- Figure 46: Europe UK Energy Drink Industry Volume Share (%), by Product Type 2024 & 2032
- Figure 47: Europe UK Energy Drink Industry Revenue (Million), by Distribution Channel 2024 & 2032
- Figure 48: Europe UK Energy Drink Industry Volume (K Liters), by Distribution Channel 2024 & 2032
- Figure 49: Europe UK Energy Drink Industry Revenue Share (%), by Distribution Channel 2024 & 2032
- Figure 50: Europe UK Energy Drink Industry Volume Share (%), by Distribution Channel 2024 & 2032
- Figure 51: Europe UK Energy Drink Industry Revenue (Million), by Country 2024 & 2032
- Figure 52: Europe UK Energy Drink Industry Volume (K Liters), by Country 2024 & 2032
- Figure 53: Europe UK Energy Drink Industry Revenue Share (%), by Country 2024 & 2032
- Figure 54: Europe UK Energy Drink Industry Volume Share (%), by Country 2024 & 2032
- Figure 55: Middle East & Africa UK Energy Drink Industry Revenue (Million), by Packaging Type 2024 & 2032
- Figure 56: Middle East & Africa UK Energy Drink Industry Volume (K Liters), by Packaging Type 2024 & 2032
- Figure 57: Middle East & Africa UK Energy Drink Industry Revenue Share (%), by Packaging Type 2024 & 2032
- Figure 58: Middle East & Africa UK Energy Drink Industry Volume Share (%), by Packaging Type 2024 & 2032
- Figure 59: Middle East & Africa UK Energy Drink Industry Revenue (Million), by Product Type 2024 & 2032
- Figure 60: Middle East & Africa UK Energy Drink Industry Volume (K Liters), by Product Type 2024 & 2032
- Figure 61: Middle East & Africa UK Energy Drink Industry Revenue Share (%), by Product Type 2024 & 2032
- Figure 62: Middle East & Africa UK Energy Drink Industry Volume Share (%), by Product Type 2024 & 2032
- Figure 63: Middle East & Africa UK Energy Drink Industry Revenue (Million), by Distribution Channel 2024 & 2032
- Figure 64: Middle East & Africa UK Energy Drink Industry Volume (K Liters), by Distribution Channel 2024 & 2032
- Figure 65: Middle East & Africa UK Energy Drink Industry Revenue Share (%), by Distribution Channel 2024 & 2032
- Figure 66: Middle East & Africa UK Energy Drink Industry Volume Share (%), by Distribution Channel 2024 & 2032
- Figure 67: Middle East & Africa UK Energy Drink Industry Revenue (Million), by Country 2024 & 2032
- Figure 68: Middle East & Africa UK Energy Drink Industry Volume (K Liters), by Country 2024 & 2032
- Figure 69: Middle East & Africa UK Energy Drink Industry Revenue Share (%), by Country 2024 & 2032
- Figure 70: Middle East & Africa UK Energy Drink Industry Volume Share (%), by Country 2024 & 2032
- Figure 71: Asia Pacific UK Energy Drink Industry Revenue (Million), by Packaging Type 2024 & 2032
- Figure 72: Asia Pacific UK Energy Drink Industry Volume (K Liters), by Packaging Type 2024 & 2032
- Figure 73: Asia Pacific UK Energy Drink Industry Revenue Share (%), by Packaging Type 2024 & 2032
- Figure 74: Asia Pacific UK Energy Drink Industry Volume Share (%), by Packaging Type 2024 & 2032
- Figure 75: Asia Pacific UK Energy Drink Industry Revenue (Million), by Product Type 2024 & 2032
- Figure 76: Asia Pacific UK Energy Drink Industry Volume (K Liters), by Product Type 2024 & 2032
- Figure 77: Asia Pacific UK Energy Drink Industry Revenue Share (%), by Product Type 2024 & 2032
- Figure 78: Asia Pacific UK Energy Drink Industry Volume Share (%), by Product Type 2024 & 2032
- Figure 79: Asia Pacific UK Energy Drink Industry Revenue (Million), by Distribution Channel 2024 & 2032
- Figure 80: Asia Pacific UK Energy Drink Industry Volume (K Liters), by Distribution Channel 2024 & 2032
- Figure 81: Asia Pacific UK Energy Drink Industry Revenue Share (%), by Distribution Channel 2024 & 2032
- Figure 82: Asia Pacific UK Energy Drink Industry Volume Share (%), by Distribution Channel 2024 & 2032
- Figure 83: Asia Pacific UK Energy Drink Industry Revenue (Million), by Country 2024 & 2032
- Figure 84: Asia Pacific UK Energy Drink Industry Volume (K Liters), by Country 2024 & 2032
- Figure 85: Asia Pacific UK Energy Drink Industry Revenue Share (%), by Country 2024 & 2032
- Figure 86: Asia Pacific UK Energy Drink Industry Volume Share (%), by Country 2024 & 2032
List of Tables
- Table 1: Global UK Energy Drink Industry Revenue Million Forecast, by Region 2019 & 2032
- Table 2: Global UK Energy Drink Industry Volume K Liters Forecast, by Region 2019 & 2032
- Table 3: Global UK Energy Drink Industry Revenue Million Forecast, by Packaging Type 2019 & 2032
- Table 4: Global UK Energy Drink Industry Volume K Liters Forecast, by Packaging Type 2019 & 2032
- Table 5: Global UK Energy Drink Industry Revenue Million Forecast, by Product Type 2019 & 2032
- Table 6: Global UK Energy Drink Industry Volume K Liters Forecast, by Product Type 2019 & 2032
- Table 7: Global UK Energy Drink Industry Revenue Million Forecast, by Distribution Channel 2019 & 2032
- Table 8: Global UK Energy Drink Industry Volume K Liters Forecast, by Distribution Channel 2019 & 2032
- Table 9: Global UK Energy Drink Industry Revenue Million Forecast, by Region 2019 & 2032
- Table 10: Global UK Energy Drink Industry Volume K Liters Forecast, by Region 2019 & 2032
- Table 11: Global UK Energy Drink Industry Revenue Million Forecast, by Country 2019 & 2032
- Table 12: Global UK Energy Drink Industry Volume K Liters Forecast, by Country 2019 & 2032
- Table 13: England UK Energy Drink Industry Revenue (Million) Forecast, by Application 2019 & 2032
- Table 14: England UK Energy Drink Industry Volume (K Liters) Forecast, by Application 2019 & 2032
- Table 15: Wales UK Energy Drink Industry Revenue (Million) Forecast, by Application 2019 & 2032
- Table 16: Wales UK Energy Drink Industry Volume (K Liters) Forecast, by Application 2019 & 2032
- Table 17: Scotland UK Energy Drink Industry Revenue (Million) Forecast, by Application 2019 & 2032
- Table 18: Scotland UK Energy Drink Industry Volume (K Liters) Forecast, by Application 2019 & 2032
- Table 19: Northern UK Energy Drink Industry Revenue (Million) Forecast, by Application 2019 & 2032
- Table 20: Northern UK Energy Drink Industry Volume (K Liters) Forecast, by Application 2019 & 2032
- Table 21: Ireland UK Energy Drink Industry Revenue (Million) Forecast, by Application 2019 & 2032
- Table 22: Ireland UK Energy Drink Industry Volume (K Liters) Forecast, by Application 2019 & 2032
- Table 23: Global UK Energy Drink Industry Revenue Million Forecast, by Packaging Type 2019 & 2032
- Table 24: Global UK Energy Drink Industry Volume K Liters Forecast, by Packaging Type 2019 & 2032
- Table 25: Global UK Energy Drink Industry Revenue Million Forecast, by Product Type 2019 & 2032
- Table 26: Global UK Energy Drink Industry Volume K Liters Forecast, by Product Type 2019 & 2032
- Table 27: Global UK Energy Drink Industry Revenue Million Forecast, by Distribution Channel 2019 & 2032
- Table 28: Global UK Energy Drink Industry Volume K Liters Forecast, by Distribution Channel 2019 & 2032
- Table 29: Global UK Energy Drink Industry Revenue Million Forecast, by Country 2019 & 2032
- Table 30: Global UK Energy Drink Industry Volume K Liters Forecast, by Country 2019 & 2032
- Table 31: United States UK Energy Drink Industry Revenue (Million) Forecast, by Application 2019 & 2032
- Table 32: United States UK Energy Drink Industry Volume (K Liters) Forecast, by Application 2019 & 2032
- Table 33: Canada UK Energy Drink Industry Revenue (Million) Forecast, by Application 2019 & 2032
- Table 34: Canada UK Energy Drink Industry Volume (K Liters) Forecast, by Application 2019 & 2032
- Table 35: Mexico UK Energy Drink Industry Revenue (Million) Forecast, by Application 2019 & 2032
- Table 36: Mexico UK Energy Drink Industry Volume (K Liters) Forecast, by Application 2019 & 2032
- Table 37: Global UK Energy Drink Industry Revenue Million Forecast, by Packaging Type 2019 & 2032
- Table 38: Global UK Energy Drink Industry Volume K Liters Forecast, by Packaging Type 2019 & 2032
- Table 39: Global UK Energy Drink Industry Revenue Million Forecast, by Product Type 2019 & 2032
- Table 40: Global UK Energy Drink Industry Volume K Liters Forecast, by Product Type 2019 & 2032
- Table 41: Global UK Energy Drink Industry Revenue Million Forecast, by Distribution Channel 2019 & 2032
- Table 42: Global UK Energy Drink Industry Volume K Liters Forecast, by Distribution Channel 2019 & 2032
- Table 43: Global UK Energy Drink Industry Revenue Million Forecast, by Country 2019 & 2032
- Table 44: Global UK Energy Drink Industry Volume K Liters Forecast, by Country 2019 & 2032
- Table 45: Brazil UK Energy Drink Industry Revenue (Million) Forecast, by Application 2019 & 2032
- Table 46: Brazil UK Energy Drink Industry Volume (K Liters) Forecast, by Application 2019 & 2032
- Table 47: Argentina UK Energy Drink Industry Revenue (Million) Forecast, by Application 2019 & 2032
- Table 48: Argentina UK Energy Drink Industry Volume (K Liters) Forecast, by Application 2019 & 2032
- Table 49: Rest of South America UK Energy Drink Industry Revenue (Million) Forecast, by Application 2019 & 2032
- Table 50: Rest of South America UK Energy Drink Industry Volume (K Liters) Forecast, by Application 2019 & 2032
- Table 51: Global UK Energy Drink Industry Revenue Million Forecast, by Packaging Type 2019 & 2032
- Table 52: Global UK Energy Drink Industry Volume K Liters Forecast, by Packaging Type 2019 & 2032
- Table 53: Global UK Energy Drink Industry Revenue Million Forecast, by Product Type 2019 & 2032
- Table 54: Global UK Energy Drink Industry Volume K Liters Forecast, by Product Type 2019 & 2032
- Table 55: Global UK Energy Drink Industry Revenue Million Forecast, by Distribution Channel 2019 & 2032
- Table 56: Global UK Energy Drink Industry Volume K Liters Forecast, by Distribution Channel 2019 & 2032
- Table 57: Global UK Energy Drink Industry Revenue Million Forecast, by Country 2019 & 2032
- Table 58: Global UK Energy Drink Industry Volume K Liters Forecast, by Country 2019 & 2032
- Table 59: United Kingdom UK Energy Drink Industry Revenue (Million) Forecast, by Application 2019 & 2032
- Table 60: United Kingdom UK Energy Drink Industry Volume (K Liters) Forecast, by Application 2019 & 2032
- Table 61: Germany UK Energy Drink Industry Revenue (Million) Forecast, by Application 2019 & 2032
- Table 62: Germany UK Energy Drink Industry Volume (K Liters) Forecast, by Application 2019 & 2032
- Table 63: France UK Energy Drink Industry Revenue (Million) Forecast, by Application 2019 & 2032
- Table 64: France UK Energy Drink Industry Volume (K Liters) Forecast, by Application 2019 & 2032
- Table 65: Italy UK Energy Drink Industry Revenue (Million) Forecast, by Application 2019 & 2032
- Table 66: Italy UK Energy Drink Industry Volume (K Liters) Forecast, by Application 2019 & 2032
- Table 67: Spain UK Energy Drink Industry Revenue (Million) Forecast, by Application 2019 & 2032
- Table 68: Spain UK Energy Drink Industry Volume (K Liters) Forecast, by Application 2019 & 2032
- Table 69: Russia UK Energy Drink Industry Revenue (Million) Forecast, by Application 2019 & 2032
- Table 70: Russia UK Energy Drink Industry Volume (K Liters) Forecast, by Application 2019 & 2032
- Table 71: Benelux UK Energy Drink Industry Revenue (Million) Forecast, by Application 2019 & 2032
- Table 72: Benelux UK Energy Drink Industry Volume (K Liters) Forecast, by Application 2019 & 2032
- Table 73: Nordics UK Energy Drink Industry Revenue (Million) Forecast, by Application 2019 & 2032
- Table 74: Nordics UK Energy Drink Industry Volume (K Liters) Forecast, by Application 2019 & 2032
- Table 75: Rest of Europe UK Energy Drink Industry Revenue (Million) Forecast, by Application 2019 & 2032
- Table 76: Rest of Europe UK Energy Drink Industry Volume (K Liters) Forecast, by Application 2019 & 2032
- Table 77: Global UK Energy Drink Industry Revenue Million Forecast, by Packaging Type 2019 & 2032
- Table 78: Global UK Energy Drink Industry Volume K Liters Forecast, by Packaging Type 2019 & 2032
- Table 79: Global UK Energy Drink Industry Revenue Million Forecast, by Product Type 2019 & 2032
- Table 80: Global UK Energy Drink Industry Volume K Liters Forecast, by Product Type 2019 & 2032
- Table 81: Global UK Energy Drink Industry Revenue Million Forecast, by Distribution Channel 2019 & 2032
- Table 82: Global UK Energy Drink Industry Volume K Liters Forecast, by Distribution Channel 2019 & 2032
- Table 83: Global UK Energy Drink Industry Revenue Million Forecast, by Country 2019 & 2032
- Table 84: Global UK Energy Drink Industry Volume K Liters Forecast, by Country 2019 & 2032
- Table 85: Turkey UK Energy Drink Industry Revenue (Million) Forecast, by Application 2019 & 2032
- Table 86: Turkey UK Energy Drink Industry Volume (K Liters) Forecast, by Application 2019 & 2032
- Table 87: Israel UK Energy Drink Industry Revenue (Million) Forecast, by Application 2019 & 2032
- Table 88: Israel UK Energy Drink Industry Volume (K Liters) Forecast, by Application 2019 & 2032
- Table 89: GCC UK Energy Drink Industry Revenue (Million) Forecast, by Application 2019 & 2032
- Table 90: GCC UK Energy Drink Industry Volume (K Liters) Forecast, by Application 2019 & 2032
- Table 91: North Africa UK Energy Drink Industry Revenue (Million) Forecast, by Application 2019 & 2032
- Table 92: North Africa UK Energy Drink Industry Volume (K Liters) Forecast, by Application 2019 & 2032
- Table 93: South Africa UK Energy Drink Industry Revenue (Million) Forecast, by Application 2019 & 2032
- Table 94: South Africa UK Energy Drink Industry Volume (K Liters) Forecast, by Application 2019 & 2032
- Table 95: Rest of Middle East & Africa UK Energy Drink Industry Revenue (Million) Forecast, by Application 2019 & 2032
- Table 96: Rest of Middle East & Africa UK Energy Drink Industry Volume (K Liters) Forecast, by Application 2019 & 2032
- Table 97: Global UK Energy Drink Industry Revenue Million Forecast, by Packaging Type 2019 & 2032
- Table 98: Global UK Energy Drink Industry Volume K Liters Forecast, by Packaging Type 2019 & 2032
- Table 99: Global UK Energy Drink Industry Revenue Million Forecast, by Product Type 2019 & 2032
- Table 100: Global UK Energy Drink Industry Volume K Liters Forecast, by Product Type 2019 & 2032
- Table 101: Global UK Energy Drink Industry Revenue Million Forecast, by Distribution Channel 2019 & 2032
- Table 102: Global UK Energy Drink Industry Volume K Liters Forecast, by Distribution Channel 2019 & 2032
- Table 103: Global UK Energy Drink Industry Revenue Million Forecast, by Country 2019 & 2032
- Table 104: Global UK Energy Drink Industry Volume K Liters Forecast, by Country 2019 & 2032
- Table 105: China UK Energy Drink Industry Revenue (Million) Forecast, by Application 2019 & 2032
- Table 106: China UK Energy Drink Industry Volume (K Liters) Forecast, by Application 2019 & 2032
- Table 107: India UK Energy Drink Industry Revenue (Million) Forecast, by Application 2019 & 2032
- Table 108: India UK Energy Drink Industry Volume (K Liters) Forecast, by Application 2019 & 2032
- Table 109: Japan UK Energy Drink Industry Revenue (Million) Forecast, by Application 2019 & 2032
- Table 110: Japan UK Energy Drink Industry Volume (K Liters) Forecast, by Application 2019 & 2032
- Table 111: South Korea UK Energy Drink Industry Revenue (Million) Forecast, by Application 2019 & 2032
- Table 112: South Korea UK Energy Drink Industry Volume (K Liters) Forecast, by Application 2019 & 2032
- Table 113: ASEAN UK Energy Drink Industry Revenue (Million) Forecast, by Application 2019 & 2032
- Table 114: ASEAN UK Energy Drink Industry Volume (K Liters) Forecast, by Application 2019 & 2032
- Table 115: Oceania UK Energy Drink Industry Revenue (Million) Forecast, by Application 2019 & 2032
- Table 116: Oceania UK Energy Drink Industry Volume (K Liters) Forecast, by Application 2019 & 2032
- Table 117: Rest of Asia Pacific UK Energy Drink Industry Revenue (Million) Forecast, by Application 2019 & 2032
- Table 118: Rest of Asia Pacific UK Energy Drink Industry Volume (K Liters) Forecast, by Application 2019 & 2032
Frequently Asked Questions
1. What is the projected Compound Annual Growth Rate (CAGR) of the UK Energy Drink Industry?
The projected CAGR is approximately 4.50%.
2. Which companies are prominent players in the UK Energy Drink Industry?
Key companies in the market include TSI Consumer Goods GmbH, PepsiCo Inc, Max Muscle Nutrition, Suntory Holdings Limited, Red Bull GmbH, The Coca-Cola Company, Nestle SA*List Not Exhaustive, Global Trade Holdings Co Ltd, Monster Energy Company, GlaxoSmithKline PLC.
3. What are the main segments of the UK Energy Drink Industry?
The market segments include Packaging Type, Product Type, Distribution Channel.
4. Can you provide details about the market size?
The market size is estimated to be USD XX Million as of 2022.
5. What are some drivers contributing to market growth?
Rising Health & Wellness Trends; Strategic Initiatives By Key Players.
6. What are the notable trends driving market growth?
The Drinks Segment Dominates the Energy Drink Market.
7. Are there any restraints impacting market growth?
Cost Considerations Coupled With Availability Of Alternatives.
8. Can you provide examples of recent developments in the market?
In September 2022, Virtue Clean Energy, the brand that creates clean alternatives in the energy drink category, launched its newest product, Virtue Clean Energy in the United Kingdom. Virtue Drinks contain zero sugar & zero calories, made with all-natural ingredients. It has 80mg of 100% organic caffeine derived from green coffee beans, plus B vitamins (B3, B6, B7, B12).
9. What pricing options are available for accessing the report?
Pricing options include single-user, multi-user, and enterprise licenses priced at USD 3800, USD 4500, and USD 5800 respectively.
10. Is the market size provided in terms of value or volume?
The market size is provided in terms of value, measured in Million and volume, measured in K Liters.
11. Are there any specific market keywords associated with the report?
Yes, the market keyword associated with the report is "UK Energy Drink Industry," which aids in identifying and referencing the specific market segment covered.
12. How do I determine which pricing option suits my needs best?
The pricing options vary based on user requirements and access needs. Individual users may opt for single-user licenses, while businesses requiring broader access may choose multi-user or enterprise licenses for cost-effective access to the report.
13. Are there any additional resources or data provided in the UK Energy Drink Industry report?
While the report offers comprehensive insights, it's advisable to review the specific contents or supplementary materials provided to ascertain if additional resources or data are available.
14. How can I stay updated on further developments or reports in the UK Energy Drink Industry?
To stay informed about further developments, trends, and reports in the UK Energy Drink Industry, consider subscribing to industry newsletters, following relevant companies and organizations, or regularly checking reputable industry news sources and publications.
Methodology
Step 1 - Identification of Relevant Samples Size from Population Database


Step 2 - Approaches for Defining Global Market Size (Value, Volume* & Price*)

Note*: In applicable scenarios
Step 3 - Data Sources
Primary Research
- Web Analytics
- Survey Reports
- Research Institute
- Latest Research Reports
- Opinion Leaders
Secondary Research
- Annual Reports
- White Paper
- Latest Press Release
- Industry Association
- Paid Database
- Investor Presentations

Step 4 - Data Triangulation
Involves using different sources of information in order to increase the validity of a study
These sources are likely to be stakeholders in a program - participants, other researchers, program staff, other community members, and so on.
Then we put all data in single framework & apply various statistical tools to find out the dynamic on the market.
During the analysis stage, feedback from the stakeholder groups would be compared to determine areas of agreement as well as areas of divergence


