
Key Insights
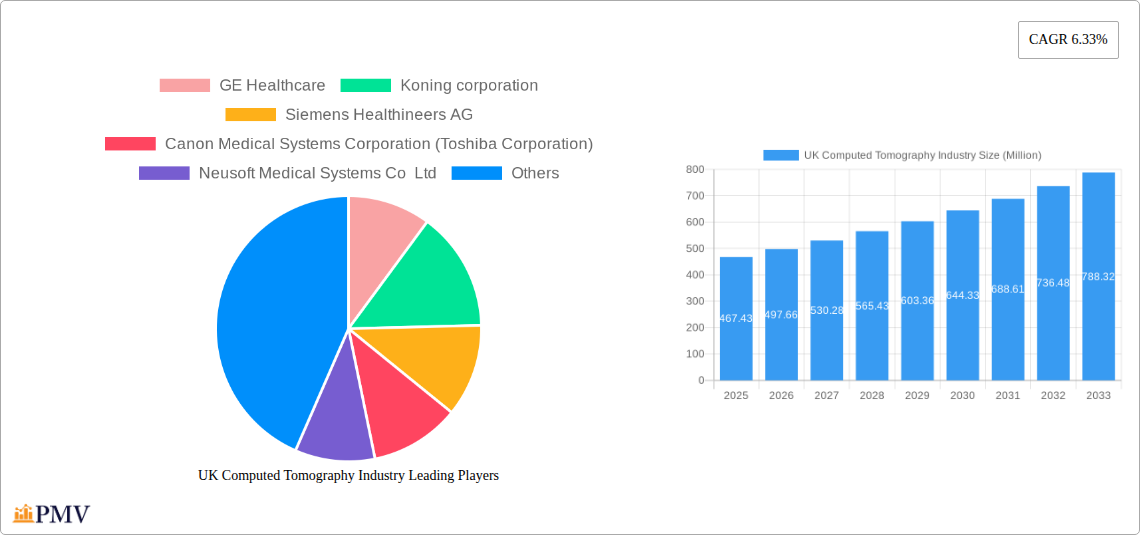
The UK computed tomography (CT) market, valued at £467.43 million in 2025, is projected to experience robust growth, driven by several key factors. Increasing prevalence of chronic diseases like cancer and cardiovascular ailments necessitates advanced diagnostic imaging, fueling demand for CT scans. Technological advancements, such as multi-slice CT scanners offering faster scan times and improved image quality, are further stimulating market expansion. Government initiatives promoting early disease detection and improved healthcare infrastructure contribute positively. The market is segmented by slice count (low, medium, high), application (oncology, neurology, cardiovascular, musculoskeletal, other), and end-user (hospitals, diagnostic centers, others). Hospitals currently dominate the end-user segment, reflecting the concentration of advanced imaging technology in established healthcare settings. However, the rise of specialized diagnostic centers and outpatient imaging services is expected to diversify the end-user landscape in the coming years. Leading players like GE Healthcare, Siemens Healthineers, and Philips are investing heavily in R&D and strategic partnerships to maintain their market share, fostering innovation and competition.
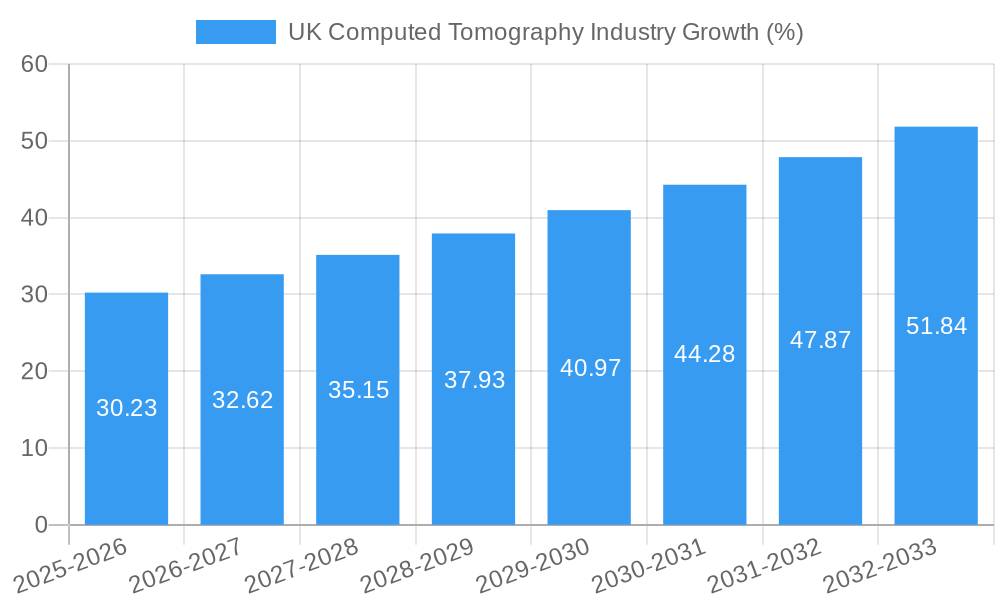
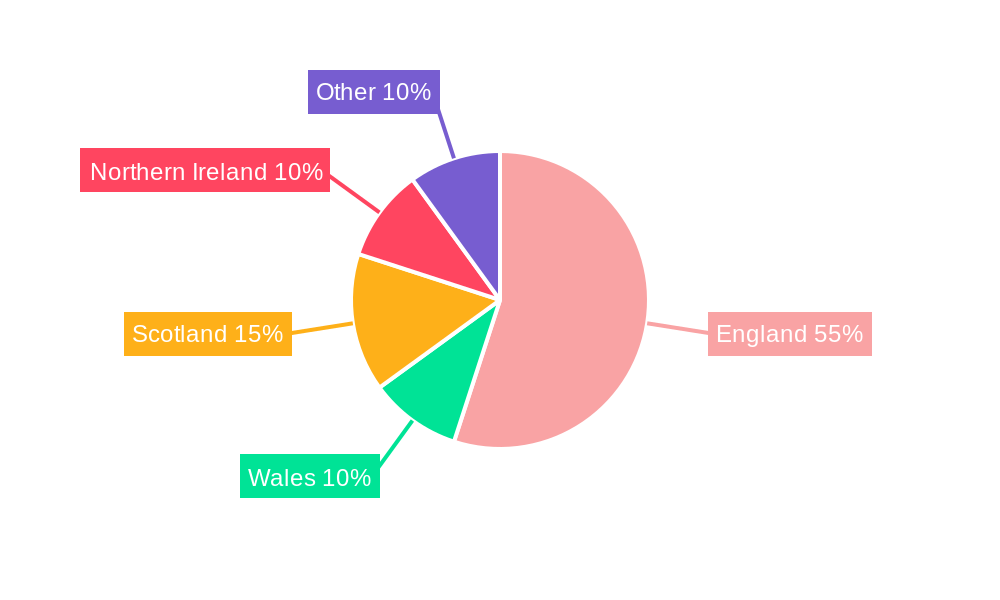
The forecast period (2025-2033) anticipates a compound annual growth rate (CAGR) of 6.33%, indicating a consistently expanding market. While factors such as regulatory hurdles and cost constraints might pose challenges, the overall growth trajectory remains positive. The increasing geriatric population and rising healthcare expenditure in the UK are expected to significantly contribute to market expansion. Furthermore, the growing adoption of AI-powered image analysis tools for improved diagnostic accuracy will drive further growth and technological advancements within the sector. Specific regional variations within the UK (England, Wales, Scotland, Northern Ireland) will likely reflect existing healthcare infrastructure disparities, but the overall market is poised for considerable expansion throughout the forecast period.
UK Computed Tomography (CT) Industry Market Report: 2019-2033
This comprehensive report provides a detailed analysis of the UK Computed Tomography (CT) industry, offering invaluable insights for stakeholders, investors, and industry professionals. The report covers the period 2019-2033, with a focus on the 2025 market and a forecast extending to 2033. The analysis encompasses market size, segmentation, competitive dynamics, and future growth prospects, incorporating key developments and challenges within the UK healthcare landscape.
UK Computed Tomography Industry Market Structure & Competitive Dynamics
The UK CT industry exhibits a moderately concentrated market structure, dominated by a few multinational players. Key competitors such as GE Healthcare, Siemens Healthineers AG, Canon Medical Systems Corporation, and Philips exert significant influence, accounting for approximately xx% of the market share collectively in 2025. Smaller players like Neusoft Medical Systems Co Ltd, Carestream Health, and Fujifilm Holdings Corporation compete primarily on niche applications or specific technological features.
The industry is characterized by a dynamic innovation ecosystem, driven by advancements in image processing, detector technology, and AI-powered diagnostic tools. Stringent regulatory frameworks, primarily governed by the Medicines and Healthcare products Regulatory Agency (MHRA), influence product approvals and market access. Substitutes for CT scans, such as MRI and ultrasound, represent competitive pressure, but CT remains the preferred modality for specific applications due to its speed and versatility.
End-user trends reveal a growing preference for high-slice CT scanners in hospitals and diagnostic centers, driven by demand for enhanced image quality and faster scan times. Mergers and acquisitions (M&A) activity remains moderate, with deal values ranging from xx Million to xx Million in recent years.
UK Computed Tomography Industry Industry Trends & Insights
The UK CT market experienced a compound annual growth rate (CAGR) of xx% during the historical period (2019-2024). This growth is primarily driven by an aging population, increasing prevalence of chronic diseases requiring CT imaging (e.g., cardiovascular diseases, cancer), and rising healthcare expenditure. Technological advancements, such as multi-slice CT scanners with improved resolution and reduced radiation dose, further stimulate market expansion. The market penetration of advanced CT technologies, such as spectral CT, is growing steadily, although adoption rates are influenced by factors such as cost and availability of trained personnel.
Consumer preference leans towards high-speed, low-radiation CT scans that deliver quicker results and minimize patient exposure. The competitive landscape is intensified by continuous product innovation and strategic partnerships aimed at enhancing market share and service offerings.
Dominant Markets & Segments in UK Computed Tomography Industry
Leading Segment: The high-slice CT segment is the dominant market segment, fueled by technological advancements and the preference for superior image quality among healthcare providers. Hospitals remain the largest end-users, representing approximately xx% of the market. The oncology application segment dominates due to the high volume of CT scans required for cancer diagnosis and treatment monitoring.
Key Drivers: Favorable government policies supporting healthcare infrastructure development and increasing investments in advanced medical technologies drive the growth in the UK CT market. Rising incidence of chronic diseases necessitate extensive diagnostic imaging, contributing to the expansion of this segment.
Dominance Analysis: The high-slice CT segment enjoys dominance due to improved diagnostic capabilities, faster scan times, and improved workflow efficiency. However, the medium and low-slice segments maintain their market presence through cost-effectiveness and suitability for specific clinical applications. The oncology segment's dominance reflects the critical role of CT in cancer detection and management. Hospitals maintain their dominant position in the end-user segment due to their comprehensive imaging capabilities.
UK Computed Tomography Industry Product Innovations
Recent product innovations in the UK CT market focus on minimizing radiation exposure, improving image quality, and integrating advanced AI-powered diagnostic tools. Manufacturers are continuously enhancing detector technology and image processing algorithms to produce sharper and more detailed images with reduced scan times. The integration of artificial intelligence (AI) assists radiologists in identifying and analyzing pathologies more accurately and efficiently. The market is witnessing a strong emphasis on efficient workflow solutions designed to streamline processes within radiology departments.
Report Segmentation & Scope
The report segments the UK CT market by Type (Low Slice, Medium Slice, High Slice), Application (Oncology, Neurology, Cardiovascular, Musculoskeletal, Other Applications), and End User (Hospitals, Diagnostic Centers, Other End Users). Each segment’s growth projections, market sizes (in Millions), and competitive dynamics are analyzed. For instance, the high-slice segment shows significant growth potential (xx% CAGR during 2025-2033), while the oncology application segment holds the largest market share. Hospitals remain the primary end-users, driving demand for sophisticated and high-throughput CT systems.
Key Drivers of UK Computed Tomography Industry Growth
Several factors are driving the growth of the UK CT market. These include technological advancements such as AI-assisted diagnostic tools and improved image processing capabilities. Government initiatives supporting investments in healthcare infrastructure and initiatives to reduce waiting lists for scans also play a crucial role. The increasing prevalence of chronic diseases requiring CT imaging further contributes to the market expansion.
Challenges in the UK Computed Tomography Industry Sector
The UK CT market faces challenges including stringent regulatory approvals impacting product launch timelines and potentially increasing costs. Supply chain disruptions can impact the availability of essential components, causing delays and potentially increasing costs. Intense competition among established and emerging players creates pressure on pricing and margins. Furthermore, the high cost of acquiring and maintaining CT scanners represents a barrier for smaller diagnostic centers.
Leading Players in the UK Computed Tomography Industry Market
- GE Healthcare
- Koning corporation
- Siemens Healthineers AG
- Canon Medical Systems Corporation (Toshiba Corporation)
- Neusoft Medical Systems Co Ltd
- Carestream Health
- Koninklijke Philips NV
- Stryker Corporation
- Planmeca Group (Planmed OY)
- Samsung Electronics Co Ltd
- Fujifilm Holdings Corporation
Key Developments in UK Computed Tomography Industry Sector
- April 2022: Installation of a new EUR 1.3 Million CT scanner at North Tyneside Hospital, funded by EUR 350 Million from the DHSC. This signifies increased public investment in healthcare infrastructure.
- October 2021: Installation of two new CT scanners at Surrey and Sussex Healthcare NHS Trust by Canon Medical Systems UK, enhancing outpatient imaging capacity by 1000 scans monthly. This highlights the expansion of outpatient imaging services and increased demand.
Strategic UK Computed Tomography Industry Market Outlook
The UK CT market holds significant growth potential driven by technological innovations, government investments, and an aging population. Strategic opportunities lie in developing AI-powered diagnostic tools, improving workflow efficiency in radiology departments, and expanding service offerings to meet the growing demand for advanced imaging. Focus on cost-effectiveness, reduced radiation exposure, and integration with other healthcare technologies will be crucial for maintaining competitiveness and securing market share.
UK Computed Tomography Industry Segmentation
-
1. Type
- 1.1. Low Slice
- 1.2. Medium Slice
- 1.3. High Slice
-
2. Application
- 2.1. Oncology
- 2.2. Neurology
- 2.3. Cardiovascular
- 2.4. Musculoskeletal
- 2.5. Other Applications
-
3. End User
- 3.1. Hospitals
- 3.2. Diagnostic Centers
- 3.3. Other End Users
UK Computed Tomography Industry Segmentation By Geography
-
1. North America
- 1.1. United States
- 1.2. Canada
- 1.3. Mexico
-
2. South America
- 2.1. Brazil
- 2.2. Argentina
- 2.3. Rest of South America
-
3. Europe
- 3.1. United Kingdom
- 3.2. Germany
- 3.3. France
- 3.4. Italy
- 3.5. Spain
- 3.6. Russia
- 3.7. Benelux
- 3.8. Nordics
- 3.9. Rest of Europe
-
4. Middle East & Africa
- 4.1. Turkey
- 4.2. Israel
- 4.3. GCC
- 4.4. North Africa
- 4.5. South Africa
- 4.6. Rest of Middle East & Africa
-
5. Asia Pacific
- 5.1. China
- 5.2. India
- 5.3. Japan
- 5.4. South Korea
- 5.5. ASEAN
- 5.6. Oceania
- 5.7. Rest of Asia Pacific
UK Computed Tomography Industry REPORT HIGHLIGHTS
| Aspects | Details |
|---|---|
| Study Period | 2019-2033 |
| Base Year | 2024 |
| Estimated Year | 2025 |
| Forecast Period | 2025-2033 |
| Historical Period | 2019-2024 |
| Growth Rate | CAGR of 6.33% from 2019-2033 |
| Segmentation |
|
Table of Contents
- 1. Introduction
- 1.1. Research Scope
- 1.2. Market Segmentation
- 1.3. Research Methodology
- 1.4. Definitions and Assumptions
- 2. Executive Summary
- 2.1. Introduction
- 3. Market Dynamics
- 3.1. Introduction
- 3.2. Market Drivers
- 3.2.1. Increasing Prevalence of Chronic Diseases; Rising Geriatric Population; Increasing Technological Advancements
- 3.3. Market Restrains
- 3.3.1. Lack Of Proper Reimbursement And Stringent Regulatory Approval Procedures; High Cost of Equipment
- 3.4. Market Trends
- 3.4.1. Oncology Segment is Expected to Hold a Significant Market Share Over the Forecast Period
- 4. Market Factor Analysis
- 4.1. Porters Five Forces
- 4.2. Supply/Value Chain
- 4.3. PESTEL analysis
- 4.4. Market Entropy
- 4.5. Patent/Trademark Analysis
- 5. Global UK Computed Tomography Industry Analysis, Insights and Forecast, 2019-2031
- 5.1. Market Analysis, Insights and Forecast - by Type
- 5.1.1. Low Slice
- 5.1.2. Medium Slice
- 5.1.3. High Slice
- 5.2. Market Analysis, Insights and Forecast - by Application
- 5.2.1. Oncology
- 5.2.2. Neurology
- 5.2.3. Cardiovascular
- 5.2.4. Musculoskeletal
- 5.2.5. Other Applications
- 5.3. Market Analysis, Insights and Forecast - by End User
- 5.3.1. Hospitals
- 5.3.2. Diagnostic Centers
- 5.3.3. Other End Users
- 5.4. Market Analysis, Insights and Forecast - by Region
- 5.4.1. North America
- 5.4.2. South America
- 5.4.3. Europe
- 5.4.4. Middle East & Africa
- 5.4.5. Asia Pacific
- 5.1. Market Analysis, Insights and Forecast - by Type
- 6. North America UK Computed Tomography Industry Analysis, Insights and Forecast, 2019-2031
- 6.1. Market Analysis, Insights and Forecast - by Type
- 6.1.1. Low Slice
- 6.1.2. Medium Slice
- 6.1.3. High Slice
- 6.2. Market Analysis, Insights and Forecast - by Application
- 6.2.1. Oncology
- 6.2.2. Neurology
- 6.2.3. Cardiovascular
- 6.2.4. Musculoskeletal
- 6.2.5. Other Applications
- 6.3. Market Analysis, Insights and Forecast - by End User
- 6.3.1. Hospitals
- 6.3.2. Diagnostic Centers
- 6.3.3. Other End Users
- 6.1. Market Analysis, Insights and Forecast - by Type
- 7. South America UK Computed Tomography Industry Analysis, Insights and Forecast, 2019-2031
- 7.1. Market Analysis, Insights and Forecast - by Type
- 7.1.1. Low Slice
- 7.1.2. Medium Slice
- 7.1.3. High Slice
- 7.2. Market Analysis, Insights and Forecast - by Application
- 7.2.1. Oncology
- 7.2.2. Neurology
- 7.2.3. Cardiovascular
- 7.2.4. Musculoskeletal
- 7.2.5. Other Applications
- 7.3. Market Analysis, Insights and Forecast - by End User
- 7.3.1. Hospitals
- 7.3.2. Diagnostic Centers
- 7.3.3. Other End Users
- 7.1. Market Analysis, Insights and Forecast - by Type
- 8. Europe UK Computed Tomography Industry Analysis, Insights and Forecast, 2019-2031
- 8.1. Market Analysis, Insights and Forecast - by Type
- 8.1.1. Low Slice
- 8.1.2. Medium Slice
- 8.1.3. High Slice
- 8.2. Market Analysis, Insights and Forecast - by Application
- 8.2.1. Oncology
- 8.2.2. Neurology
- 8.2.3. Cardiovascular
- 8.2.4. Musculoskeletal
- 8.2.5. Other Applications
- 8.3. Market Analysis, Insights and Forecast - by End User
- 8.3.1. Hospitals
- 8.3.2. Diagnostic Centers
- 8.3.3. Other End Users
- 8.1. Market Analysis, Insights and Forecast - by Type
- 9. Middle East & Africa UK Computed Tomography Industry Analysis, Insights and Forecast, 2019-2031
- 9.1. Market Analysis, Insights and Forecast - by Type
- 9.1.1. Low Slice
- 9.1.2. Medium Slice
- 9.1.3. High Slice
- 9.2. Market Analysis, Insights and Forecast - by Application
- 9.2.1. Oncology
- 9.2.2. Neurology
- 9.2.3. Cardiovascular
- 9.2.4. Musculoskeletal
- 9.2.5. Other Applications
- 9.3. Market Analysis, Insights and Forecast - by End User
- 9.3.1. Hospitals
- 9.3.2. Diagnostic Centers
- 9.3.3. Other End Users
- 9.1. Market Analysis, Insights and Forecast - by Type
- 10. Asia Pacific UK Computed Tomography Industry Analysis, Insights and Forecast, 2019-2031
- 10.1. Market Analysis, Insights and Forecast - by Type
- 10.1.1. Low Slice
- 10.1.2. Medium Slice
- 10.1.3. High Slice
- 10.2. Market Analysis, Insights and Forecast - by Application
- 10.2.1. Oncology
- 10.2.2. Neurology
- 10.2.3. Cardiovascular
- 10.2.4. Musculoskeletal
- 10.2.5. Other Applications
- 10.3. Market Analysis, Insights and Forecast - by End User
- 10.3.1. Hospitals
- 10.3.2. Diagnostic Centers
- 10.3.3. Other End Users
- 10.1. Market Analysis, Insights and Forecast - by Type
- 11. England UK Computed Tomography Industry Analysis, Insights and Forecast, 2019-2031
- 12. Wales UK Computed Tomography Industry Analysis, Insights and Forecast, 2019-2031
- 13. Scotland UK Computed Tomography Industry Analysis, Insights and Forecast, 2019-2031
- 14. Northern UK Computed Tomography Industry Analysis, Insights and Forecast, 2019-2031
- 15. Ireland UK Computed Tomography Industry Analysis, Insights and Forecast, 2019-2031
- 16. Competitive Analysis
- 16.1. Global Market Share Analysis 2024
- 16.2. Company Profiles
- 16.2.1 GE Healthcare
- 16.2.1.1. Overview
- 16.2.1.2. Products
- 16.2.1.3. SWOT Analysis
- 16.2.1.4. Recent Developments
- 16.2.1.5. Financials (Based on Availability)
- 16.2.2 Koning corporation
- 16.2.2.1. Overview
- 16.2.2.2. Products
- 16.2.2.3. SWOT Analysis
- 16.2.2.4. Recent Developments
- 16.2.2.5. Financials (Based on Availability)
- 16.2.3 Siemens Healthineers AG
- 16.2.3.1. Overview
- 16.2.3.2. Products
- 16.2.3.3. SWOT Analysis
- 16.2.3.4. Recent Developments
- 16.2.3.5. Financials (Based on Availability)
- 16.2.4 Canon Medical Systems Corporation (Toshiba Corporation)
- 16.2.4.1. Overview
- 16.2.4.2. Products
- 16.2.4.3. SWOT Analysis
- 16.2.4.4. Recent Developments
- 16.2.4.5. Financials (Based on Availability)
- 16.2.5 Neusoft Medical Systems Co Ltd
- 16.2.5.1. Overview
- 16.2.5.2. Products
- 16.2.5.3. SWOT Analysis
- 16.2.5.4. Recent Developments
- 16.2.5.5. Financials (Based on Availability)
- 16.2.6 Carestream Health
- 16.2.6.1. Overview
- 16.2.6.2. Products
- 16.2.6.3. SWOT Analysis
- 16.2.6.4. Recent Developments
- 16.2.6.5. Financials (Based on Availability)
- 16.2.7 Koninklijke Philips NV
- 16.2.7.1. Overview
- 16.2.7.2. Products
- 16.2.7.3. SWOT Analysis
- 16.2.7.4. Recent Developments
- 16.2.7.5. Financials (Based on Availability)
- 16.2.8 Stryker Corporation
- 16.2.8.1. Overview
- 16.2.8.2. Products
- 16.2.8.3. SWOT Analysis
- 16.2.8.4. Recent Developments
- 16.2.8.5. Financials (Based on Availability)
- 16.2.9 Planmeca Group (Planmed OY)
- 16.2.9.1. Overview
- 16.2.9.2. Products
- 16.2.9.3. SWOT Analysis
- 16.2.9.4. Recent Developments
- 16.2.9.5. Financials (Based on Availability)
- 16.2.10 Samsung Electronics Co Ltd
- 16.2.10.1. Overview
- 16.2.10.2. Products
- 16.2.10.3. SWOT Analysis
- 16.2.10.4. Recent Developments
- 16.2.10.5. Financials (Based on Availability)
- 16.2.11 Fujifilm Holdings Corporation
- 16.2.11.1. Overview
- 16.2.11.2. Products
- 16.2.11.3. SWOT Analysis
- 16.2.11.4. Recent Developments
- 16.2.11.5. Financials (Based on Availability)
- 16.2.1 GE Healthcare
List of Figures
- Figure 1: Global UK Computed Tomography Industry Revenue Breakdown (Million, %) by Region 2024 & 2032
- Figure 2: United kingdom Region UK Computed Tomography Industry Revenue (Million), by Country 2024 & 2032
- Figure 3: United kingdom Region UK Computed Tomography Industry Revenue Share (%), by Country 2024 & 2032
- Figure 4: North America UK Computed Tomography Industry Revenue (Million), by Type 2024 & 2032
- Figure 5: North America UK Computed Tomography Industry Revenue Share (%), by Type 2024 & 2032
- Figure 6: North America UK Computed Tomography Industry Revenue (Million), by Application 2024 & 2032
- Figure 7: North America UK Computed Tomography Industry Revenue Share (%), by Application 2024 & 2032
- Figure 8: North America UK Computed Tomography Industry Revenue (Million), by End User 2024 & 2032
- Figure 9: North America UK Computed Tomography Industry Revenue Share (%), by End User 2024 & 2032
- Figure 10: North America UK Computed Tomography Industry Revenue (Million), by Country 2024 & 2032
- Figure 11: North America UK Computed Tomography Industry Revenue Share (%), by Country 2024 & 2032
- Figure 12: South America UK Computed Tomography Industry Revenue (Million), by Type 2024 & 2032
- Figure 13: South America UK Computed Tomography Industry Revenue Share (%), by Type 2024 & 2032
- Figure 14: South America UK Computed Tomography Industry Revenue (Million), by Application 2024 & 2032
- Figure 15: South America UK Computed Tomography Industry Revenue Share (%), by Application 2024 & 2032
- Figure 16: South America UK Computed Tomography Industry Revenue (Million), by End User 2024 & 2032
- Figure 17: South America UK Computed Tomography Industry Revenue Share (%), by End User 2024 & 2032
- Figure 18: South America UK Computed Tomography Industry Revenue (Million), by Country 2024 & 2032
- Figure 19: South America UK Computed Tomography Industry Revenue Share (%), by Country 2024 & 2032
- Figure 20: Europe UK Computed Tomography Industry Revenue (Million), by Type 2024 & 2032
- Figure 21: Europe UK Computed Tomography Industry Revenue Share (%), by Type 2024 & 2032
- Figure 22: Europe UK Computed Tomography Industry Revenue (Million), by Application 2024 & 2032
- Figure 23: Europe UK Computed Tomography Industry Revenue Share (%), by Application 2024 & 2032
- Figure 24: Europe UK Computed Tomography Industry Revenue (Million), by End User 2024 & 2032
- Figure 25: Europe UK Computed Tomography Industry Revenue Share (%), by End User 2024 & 2032
- Figure 26: Europe UK Computed Tomography Industry Revenue (Million), by Country 2024 & 2032
- Figure 27: Europe UK Computed Tomography Industry Revenue Share (%), by Country 2024 & 2032
- Figure 28: Middle East & Africa UK Computed Tomography Industry Revenue (Million), by Type 2024 & 2032
- Figure 29: Middle East & Africa UK Computed Tomography Industry Revenue Share (%), by Type 2024 & 2032
- Figure 30: Middle East & Africa UK Computed Tomography Industry Revenue (Million), by Application 2024 & 2032
- Figure 31: Middle East & Africa UK Computed Tomography Industry Revenue Share (%), by Application 2024 & 2032
- Figure 32: Middle East & Africa UK Computed Tomography Industry Revenue (Million), by End User 2024 & 2032
- Figure 33: Middle East & Africa UK Computed Tomography Industry Revenue Share (%), by End User 2024 & 2032
- Figure 34: Middle East & Africa UK Computed Tomography Industry Revenue (Million), by Country 2024 & 2032
- Figure 35: Middle East & Africa UK Computed Tomography Industry Revenue Share (%), by Country 2024 & 2032
- Figure 36: Asia Pacific UK Computed Tomography Industry Revenue (Million), by Type 2024 & 2032
- Figure 37: Asia Pacific UK Computed Tomography Industry Revenue Share (%), by Type 2024 & 2032
- Figure 38: Asia Pacific UK Computed Tomography Industry Revenue (Million), by Application 2024 & 2032
- Figure 39: Asia Pacific UK Computed Tomography Industry Revenue Share (%), by Application 2024 & 2032
- Figure 40: Asia Pacific UK Computed Tomography Industry Revenue (Million), by End User 2024 & 2032
- Figure 41: Asia Pacific UK Computed Tomography Industry Revenue Share (%), by End User 2024 & 2032
- Figure 42: Asia Pacific UK Computed Tomography Industry Revenue (Million), by Country 2024 & 2032
- Figure 43: Asia Pacific UK Computed Tomography Industry Revenue Share (%), by Country 2024 & 2032
List of Tables
- Table 1: Global UK Computed Tomography Industry Revenue Million Forecast, by Region 2019 & 2032
- Table 2: Global UK Computed Tomography Industry Revenue Million Forecast, by Type 2019 & 2032
- Table 3: Global UK Computed Tomography Industry Revenue Million Forecast, by Application 2019 & 2032
- Table 4: Global UK Computed Tomography Industry Revenue Million Forecast, by End User 2019 & 2032
- Table 5: Global UK Computed Tomography Industry Revenue Million Forecast, by Region 2019 & 2032
- Table 6: Global UK Computed Tomography Industry Revenue Million Forecast, by Country 2019 & 2032
- Table 7: England UK Computed Tomography Industry Revenue (Million) Forecast, by Application 2019 & 2032
- Table 8: Wales UK Computed Tomography Industry Revenue (Million) Forecast, by Application 2019 & 2032
- Table 9: Scotland UK Computed Tomography Industry Revenue (Million) Forecast, by Application 2019 & 2032
- Table 10: Northern UK Computed Tomography Industry Revenue (Million) Forecast, by Application 2019 & 2032
- Table 11: Ireland UK Computed Tomography Industry Revenue (Million) Forecast, by Application 2019 & 2032
- Table 12: Global UK Computed Tomography Industry Revenue Million Forecast, by Type 2019 & 2032
- Table 13: Global UK Computed Tomography Industry Revenue Million Forecast, by Application 2019 & 2032
- Table 14: Global UK Computed Tomography Industry Revenue Million Forecast, by End User 2019 & 2032
- Table 15: Global UK Computed Tomography Industry Revenue Million Forecast, by Country 2019 & 2032
- Table 16: United States UK Computed Tomography Industry Revenue (Million) Forecast, by Application 2019 & 2032
- Table 17: Canada UK Computed Tomography Industry Revenue (Million) Forecast, by Application 2019 & 2032
- Table 18: Mexico UK Computed Tomography Industry Revenue (Million) Forecast, by Application 2019 & 2032
- Table 19: Global UK Computed Tomography Industry Revenue Million Forecast, by Type 2019 & 2032
- Table 20: Global UK Computed Tomography Industry Revenue Million Forecast, by Application 2019 & 2032
- Table 21: Global UK Computed Tomography Industry Revenue Million Forecast, by End User 2019 & 2032
- Table 22: Global UK Computed Tomography Industry Revenue Million Forecast, by Country 2019 & 2032
- Table 23: Brazil UK Computed Tomography Industry Revenue (Million) Forecast, by Application 2019 & 2032
- Table 24: Argentina UK Computed Tomography Industry Revenue (Million) Forecast, by Application 2019 & 2032
- Table 25: Rest of South America UK Computed Tomography Industry Revenue (Million) Forecast, by Application 2019 & 2032
- Table 26: Global UK Computed Tomography Industry Revenue Million Forecast, by Type 2019 & 2032
- Table 27: Global UK Computed Tomography Industry Revenue Million Forecast, by Application 2019 & 2032
- Table 28: Global UK Computed Tomography Industry Revenue Million Forecast, by End User 2019 & 2032
- Table 29: Global UK Computed Tomography Industry Revenue Million Forecast, by Country 2019 & 2032
- Table 30: United Kingdom UK Computed Tomography Industry Revenue (Million) Forecast, by Application 2019 & 2032
- Table 31: Germany UK Computed Tomography Industry Revenue (Million) Forecast, by Application 2019 & 2032
- Table 32: France UK Computed Tomography Industry Revenue (Million) Forecast, by Application 2019 & 2032
- Table 33: Italy UK Computed Tomography Industry Revenue (Million) Forecast, by Application 2019 & 2032
- Table 34: Spain UK Computed Tomography Industry Revenue (Million) Forecast, by Application 2019 & 2032
- Table 35: Russia UK Computed Tomography Industry Revenue (Million) Forecast, by Application 2019 & 2032
- Table 36: Benelux UK Computed Tomography Industry Revenue (Million) Forecast, by Application 2019 & 2032
- Table 37: Nordics UK Computed Tomography Industry Revenue (Million) Forecast, by Application 2019 & 2032
- Table 38: Rest of Europe UK Computed Tomography Industry Revenue (Million) Forecast, by Application 2019 & 2032
- Table 39: Global UK Computed Tomography Industry Revenue Million Forecast, by Type 2019 & 2032
- Table 40: Global UK Computed Tomography Industry Revenue Million Forecast, by Application 2019 & 2032
- Table 41: Global UK Computed Tomography Industry Revenue Million Forecast, by End User 2019 & 2032
- Table 42: Global UK Computed Tomography Industry Revenue Million Forecast, by Country 2019 & 2032
- Table 43: Turkey UK Computed Tomography Industry Revenue (Million) Forecast, by Application 2019 & 2032
- Table 44: Israel UK Computed Tomography Industry Revenue (Million) Forecast, by Application 2019 & 2032
- Table 45: GCC UK Computed Tomography Industry Revenue (Million) Forecast, by Application 2019 & 2032
- Table 46: North Africa UK Computed Tomography Industry Revenue (Million) Forecast, by Application 2019 & 2032
- Table 47: South Africa UK Computed Tomography Industry Revenue (Million) Forecast, by Application 2019 & 2032
- Table 48: Rest of Middle East & Africa UK Computed Tomography Industry Revenue (Million) Forecast, by Application 2019 & 2032
- Table 49: Global UK Computed Tomography Industry Revenue Million Forecast, by Type 2019 & 2032
- Table 50: Global UK Computed Tomography Industry Revenue Million Forecast, by Application 2019 & 2032
- Table 51: Global UK Computed Tomography Industry Revenue Million Forecast, by End User 2019 & 2032
- Table 52: Global UK Computed Tomography Industry Revenue Million Forecast, by Country 2019 & 2032
- Table 53: China UK Computed Tomography Industry Revenue (Million) Forecast, by Application 2019 & 2032
- Table 54: India UK Computed Tomography Industry Revenue (Million) Forecast, by Application 2019 & 2032
- Table 55: Japan UK Computed Tomography Industry Revenue (Million) Forecast, by Application 2019 & 2032
- Table 56: South Korea UK Computed Tomography Industry Revenue (Million) Forecast, by Application 2019 & 2032
- Table 57: ASEAN UK Computed Tomography Industry Revenue (Million) Forecast, by Application 2019 & 2032
- Table 58: Oceania UK Computed Tomography Industry Revenue (Million) Forecast, by Application 2019 & 2032
- Table 59: Rest of Asia Pacific UK Computed Tomography Industry Revenue (Million) Forecast, by Application 2019 & 2032
Frequently Asked Questions
1. What is the projected Compound Annual Growth Rate (CAGR) of the UK Computed Tomography Industry?
The projected CAGR is approximately 6.33%.
2. Which companies are prominent players in the UK Computed Tomography Industry?
Key companies in the market include GE Healthcare, Koning corporation, Siemens Healthineers AG, Canon Medical Systems Corporation (Toshiba Corporation), Neusoft Medical Systems Co Ltd, Carestream Health, Koninklijke Philips NV, Stryker Corporation, Planmeca Group (Planmed OY), Samsung Electronics Co Ltd, Fujifilm Holdings Corporation.
3. What are the main segments of the UK Computed Tomography Industry?
The market segments include Type, Application, End User.
4. Can you provide details about the market size?
The market size is estimated to be USD 467.43 Million as of 2022.
5. What are some drivers contributing to market growth?
Increasing Prevalence of Chronic Diseases; Rising Geriatric Population; Increasing Technological Advancements.
6. What are the notable trends driving market growth?
Oncology Segment is Expected to Hold a Significant Market Share Over the Forecast Period.
7. Are there any restraints impacting market growth?
Lack Of Proper Reimbursement And Stringent Regulatory Approval Procedures; High Cost of Equipment.
8. Can you provide examples of recent developments in the market?
In April 2022, a new EUR 1.3m CT scanner was installed at North Tyneside Hospital with the funding of EUR 350 million from the Department of Health and Social Care (DHSC).
9. What pricing options are available for accessing the report?
Pricing options include single-user, multi-user, and enterprise licenses priced at USD 3800, USD 4500, and USD 5800 respectively.
10. Is the market size provided in terms of value or volume?
The market size is provided in terms of value, measured in Million.
11. Are there any specific market keywords associated with the report?
Yes, the market keyword associated with the report is "UK Computed Tomography Industry," which aids in identifying and referencing the specific market segment covered.
12. How do I determine which pricing option suits my needs best?
The pricing options vary based on user requirements and access needs. Individual users may opt for single-user licenses, while businesses requiring broader access may choose multi-user or enterprise licenses for cost-effective access to the report.
13. Are there any additional resources or data provided in the UK Computed Tomography Industry report?
While the report offers comprehensive insights, it's advisable to review the specific contents or supplementary materials provided to ascertain if additional resources or data are available.
14. How can I stay updated on further developments or reports in the UK Computed Tomography Industry?
To stay informed about further developments, trends, and reports in the UK Computed Tomography Industry, consider subscribing to industry newsletters, following relevant companies and organizations, or regularly checking reputable industry news sources and publications.
Methodology
Step 1 - Identification of Relevant Samples Size from Population Database


Step 2 - Approaches for Defining Global Market Size (Value, Volume* & Price*)

Note*: In applicable scenarios
Step 3 - Data Sources
Primary Research
- Web Analytics
- Survey Reports
- Research Institute
- Latest Research Reports
- Opinion Leaders
Secondary Research
- Annual Reports
- White Paper
- Latest Press Release
- Industry Association
- Paid Database
- Investor Presentations

Step 4 - Data Triangulation
Involves using different sources of information in order to increase the validity of a study
These sources are likely to be stakeholders in a program - participants, other researchers, program staff, other community members, and so on.
Then we put all data in single framework & apply various statistical tools to find out the dynamic on the market.
During the analysis stage, feedback from the stakeholder groups would be compared to determine areas of agreement as well as areas of divergence


