
Key Insights
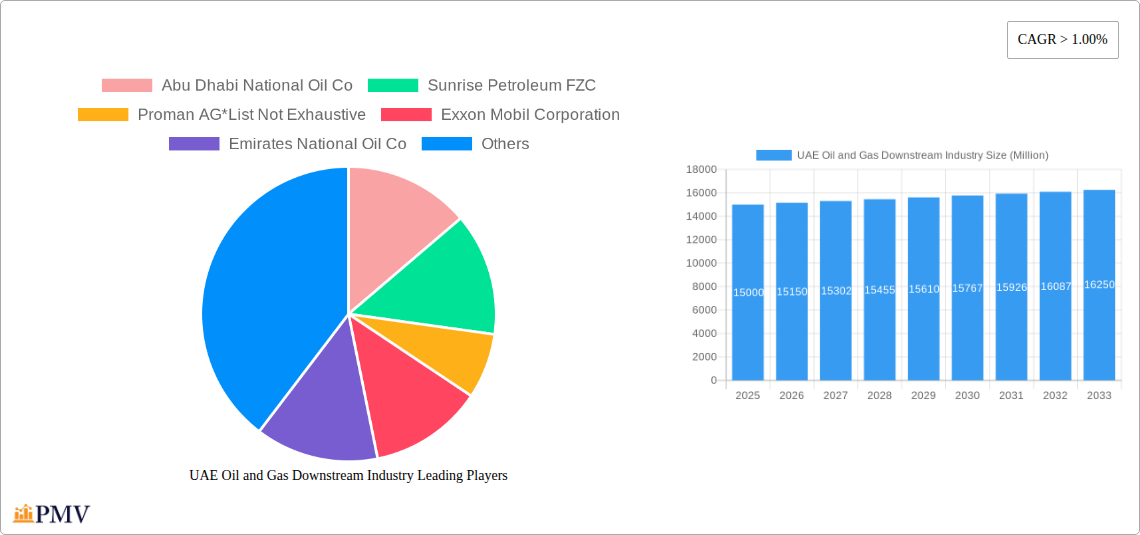
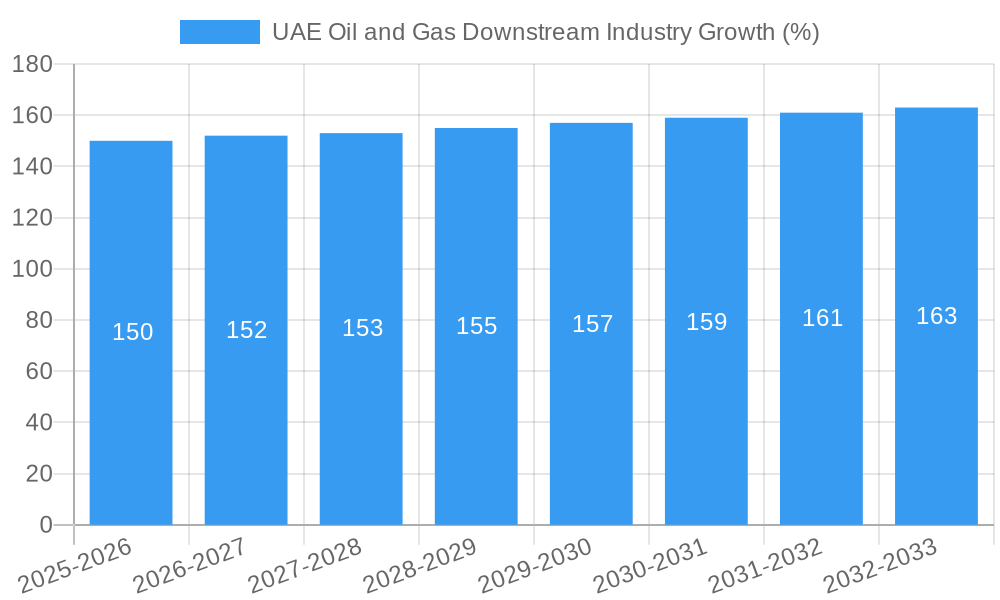
The UAE oil and gas downstream industry, encompassing refining, petrochemicals, and marketing, is experiencing robust growth, driven by increasing domestic demand and strategic investments in infrastructure development. The industry's considerable size, estimated at several billion USD in 2025, is projected to expand significantly over the forecast period (2025-2033), propelled by a CAGR exceeding 1%. This growth is fueled by several factors, including the UAE's commitment to diversifying its economy beyond oil, expanding its petrochemical sector, and strategic partnerships for new projects within the downstream industry. The government's initiatives to enhance energy efficiency and promote sustainable practices also contribute to the industry's transformation, although these efforts may present certain challenges in the short term. Significant investments in refining capacity upgrades and the development of advanced petrochemical complexes are expected to solidify the UAE's position as a regional leader in oil and gas downstream activities. The ongoing expansion of downstream infrastructure, alongside strategic alliances with international energy giants, signals a positive trajectory for future growth. The market segments – encompassing upstream, midstream and downstream activities, and applications in both onshore and offshore operations – present diverse opportunities for investment and expansion. The key players, including ADNOC, Emirates National Oil Co., and international players like TotalEnergies and Shell, are actively shaping the industry's future through expansion plans and technological innovations.
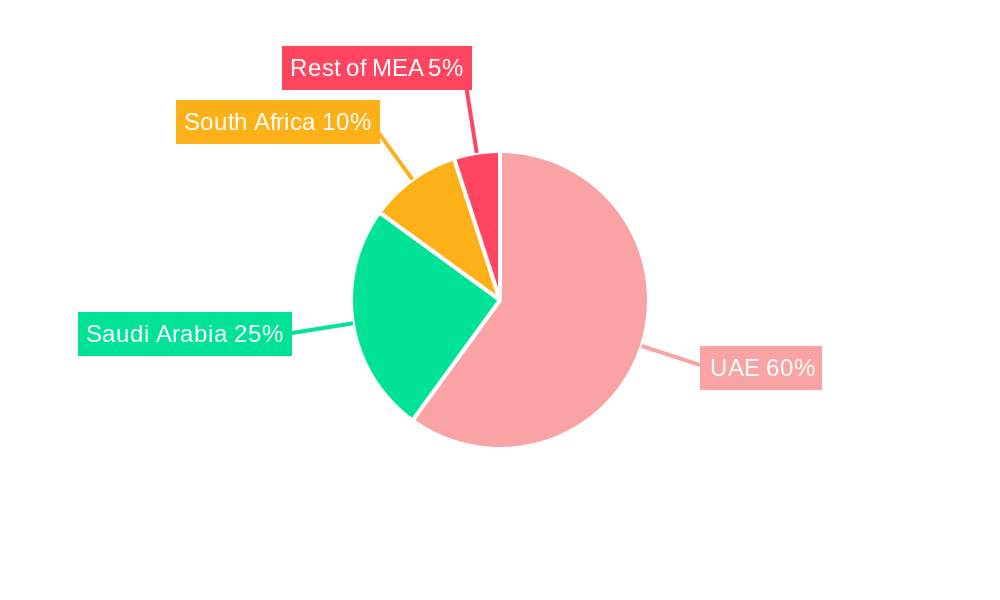
The competitive landscape is characterized by both established national oil companies and international players, reflecting the industry's strategic importance. The Middle East and Africa region, particularly the UAE, Saudi Arabia, and South Africa, represent significant markets for downstream products, with the UAE holding a considerable share due to its strategic location and robust infrastructure. While geopolitical factors and global economic conditions can introduce uncertainty, the long-term outlook for the UAE's oil and gas downstream industry remains positive, driven by sustainable growth strategies and significant investments in infrastructure and technological advancements. Continued focus on operational efficiency, environmental sustainability, and strategic partnerships will be crucial to maintaining this growth trajectory.
UAE Oil and Gas Downstream Industry: A Comprehensive Market Report (2019-2033)
This detailed report provides a comprehensive analysis of the UAE oil and gas downstream industry, offering invaluable insights for investors, industry professionals, and strategic planners. Covering the period from 2019 to 2033, with a base year of 2025, this study examines market structure, competitive dynamics, dominant segments, technological innovations, and key growth drivers, offering a robust forecast for the period 2025-2033. The report leverages extensive data analysis to present actionable intelligence on the UAE's dynamic downstream sector.
UAE Oil and Gas Downstream Industry Market Structure & Competitive Dynamics
This section analyzes the UAE's downstream oil and gas market, focusing on market concentration, innovation, regulatory frameworks, substitution threats, end-user trends, and mergers and acquisitions (M&A) activity. The highly concentrated nature of the market is explored, examining the market share held by key players like ADNOC, Emirates National Oil Co., and international giants such as ExxonMobil and TotalEnergies. The report assesses the impact of government regulations on industry players, focusing on their influence on investment decisions and technological adoption. Further, the report analyzes the evolving landscape of product substitution, including the increasing adoption of renewable energy sources and their impact on the demand for traditional oil and gas products. Finally, it delves into recent M&A activity, providing insights into deal values and their implications for market consolidation. Key metrics such as market share and M&A deal values (in Millions) are presented, providing a quantified picture of the competitive landscape. For example, xx Million was invested in M&A activities in 2024.
UAE Oil and Gas Downstream Industry Industry Trends & Insights
This section provides a detailed examination of the UAE oil and gas downstream industry's growth trajectory, analyzing market growth drivers, technological disruptions, consumer preferences, and competitive dynamics. The report explores the impact of factors such as rising energy demand, government initiatives promoting diversification, and technological advancements in refining and petrochemical production. The compound annual growth rate (CAGR) for key segments is presented, with a focus on the market penetration of new technologies and the changing preferences of end-users. The report also analyzes the impact of geopolitical factors and global energy prices on market growth, while highlighting the competitive strategies employed by major players in this space. The anticipated CAGR for the forecast period is projected at xx%.
Dominant Markets & Segments in UAE Oil and Gas Downstream Industry
This section identifies the leading regions, countries, and segments within the UAE's oil and gas downstream sector across Upstream, Midstream, and Downstream operations, encompassing both Onshore and Offshore applications. The analysis will focus on the key drivers behind the dominance of specific segments, including economic policies, infrastructural development, and government incentives. The report details the dominant segment and factors influencing its leadership, along with a detailed analysis of market size and growth potential.
- Key Drivers for the Dominant Segment:
- Favorable Government Policies: Specific examples of supportive regulations and incentives will be cited.
- Robust Infrastructure: Analysis of existing infrastructure and its impact on market share.
- Strategic Location: Advantages offered by geographical position.
- Technological advancements: Technological factors propelling growth.
UAE Oil and Gas Downstream Industry Product Innovations
This section summarizes recent product developments, highlighting their applications and competitive advantages. The focus is on technological advancements, particularly those enhancing efficiency, reducing emissions, and expanding product applications. The report will analyze the market fit of these innovations, focusing on factors such as consumer demand, regulatory compliance, and cost-effectiveness.
Report Segmentation & Scope
This report provides a granular segmentation of the UAE oil and gas downstream market, covering Upstream, Midstream, and Downstream segments, further categorized by Onshore and Offshore applications. Each segment's growth projection, market size (in Millions), and competitive landscape is detailed.
- Upstream: This segment's analysis includes exploration, drilling, and production, projecting xx Million market size by 2033.
- Midstream: This covers transportation, storage, and processing, with a projected market size of xx Million by 2033.
- Downstream: This focuses on refining, petrochemicals, and marketing, with a projected market size of xx Million by 2033.
- Onshore: This segment covers land-based operations, with a projected market size of xx Million by 2033.
- Offshore: This segment covers sea-based operations, with a projected market size of xx Million by 2033.
Key Drivers of UAE Oil and Gas Downstream Industry Growth
This section identifies and analyzes the key factors driving the growth of the UAE oil and gas downstream industry. These include:
- Technological advancements: Improved refining techniques, enhanced petrochemical production methods, and the integration of advanced technologies.
- Economic growth: Rising energy consumption linked to expanding industries and population growth.
- Government policies: Supportive regulations, investment incentives, and strategic initiatives promoting industry development. Examples include specific government initiatives and their projected impact.
Challenges in the UAE Oil and Gas Downstream Industry Sector
This section examines the challenges faced by the UAE's oil and gas downstream industry. These include:
- Regulatory hurdles: Potential complexities in obtaining permits and licenses, impacting project timelines and investment.
- Supply chain disruptions: Potential vulnerabilities in the supply chain, leading to production delays and increased costs.
- Competitive pressures: Competition from both domestic and international players, impacting profitability and market share. The quantifiable impact of these challenges on market growth will be discussed.
Leading Players in the UAE Oil and Gas Downstream Industry Market
- Abu Dhabi National Oil Co
- Sunrise Petroleum FZC
- Proman AG
- Exxon Mobil Corporation
- Emirates National Oil Co
- TotalEnergies SA
- Royal Dutch Shell PLC
- Abu Dhabi Polymers Company Ltd
Key Developments in UAE Oil and Gas Downstream Industry Sector
- March 2022: Proman and ADNOC agree to build the UAE's first world-scale methanol production facility (1.8 Million tons annual capacity) at TA'ZIZ. This significantly expands the country's downstream petrochemical capacity.
- December 2021: Technip Energies and TARGET Engineering win a contract from Abu Dhabi Polymers Co. Ltd to build a new Ethane Cracker Unit (over 1,500 KTA capacity) at the Borouge 4 complex. This demonstrates ongoing investment in expanding petrochemical production.
Strategic UAE Oil and Gas Downstream Industry Market Outlook
The UAE's oil and gas downstream sector presents significant opportunities for growth in the coming years. Government initiatives aimed at diversification and sustainability, coupled with strategic investments in new technologies and infrastructure, will drive market expansion. The sector is poised for continued growth, particularly in the petrochemicals and refining segments. The report identifies key strategic opportunities for market players, including focusing on high-value-added products, leveraging digital technologies, and prioritizing sustainable practices. The continued focus on attracting foreign direct investment and fostering collaboration will further enhance market growth.
UAE Oil and Gas Downstream Industry Segmentation
- 1. Refining
- 2. Petrochemicals
UAE Oil and Gas Downstream Industry Segmentation By Geography
-
1. North America
- 1.1. United States
- 1.2. Canada
- 1.3. Mexico
-
2. South America
- 2.1. Brazil
- 2.2. Argentina
- 2.3. Rest of South America
-
3. Europe
- 3.1. United Kingdom
- 3.2. Germany
- 3.3. France
- 3.4. Italy
- 3.5. Spain
- 3.6. Russia
- 3.7. Benelux
- 3.8. Nordics
- 3.9. Rest of Europe
-
4. Middle East & Africa
- 4.1. Turkey
- 4.2. Israel
- 4.3. GCC
- 4.4. North Africa
- 4.5. South Africa
- 4.6. Rest of Middle East & Africa
-
5. Asia Pacific
- 5.1. China
- 5.2. India
- 5.3. Japan
- 5.4. South Korea
- 5.5. ASEAN
- 5.6. Oceania
- 5.7. Rest of Asia Pacific
UAE Oil and Gas Downstream Industry REPORT HIGHLIGHTS
| Aspects | Details |
|---|---|
| Study Period | 2019-2033 |
| Base Year | 2024 |
| Estimated Year | 2025 |
| Forecast Period | 2025-2033 |
| Historical Period | 2019-2024 |
| Growth Rate | CAGR of > 1.00% from 2019-2033 |
| Segmentation |
|
Table of Contents
- 1. Introduction
- 1.1. Research Scope
- 1.2. Market Segmentation
- 1.3. Research Methodology
- 1.4. Definitions and Assumptions
- 2. Executive Summary
- 2.1. Introduction
- 3. Market Dynamics
- 3.1. Introduction
- 3.2. Market Drivers
- 3.2.1. 4.; Increasing Renewables Capacity in Thailand4.; Rising Modernization of Existing Transmission and Distribution Infrastructure
- 3.3. Market Restrains
- 3.3.1. 4.; Huge Capital Expenditure Required for Carrying out Modernization of Existing Facilities
- 3.4. Market Trends
- 3.4.1. Refining Sector to Witness Significant Growth
- 4. Market Factor Analysis
- 4.1. Porters Five Forces
- 4.2. Supply/Value Chain
- 4.3. PESTEL analysis
- 4.4. Market Entropy
- 4.5. Patent/Trademark Analysis
- 5. Global UAE Oil and Gas Downstream Industry Analysis, Insights and Forecast, 2019-2031
- 5.1. Market Analysis, Insights and Forecast - by Refining
- 5.2. Market Analysis, Insights and Forecast - by Petrochemicals
- 5.3. Market Analysis, Insights and Forecast - by Region
- 5.3.1. North America
- 5.3.2. South America
- 5.3.3. Europe
- 5.3.4. Middle East & Africa
- 5.3.5. Asia Pacific
- 5.1. Market Analysis, Insights and Forecast - by Refining
- 6. North America UAE Oil and Gas Downstream Industry Analysis, Insights and Forecast, 2019-2031
- 6.1. Market Analysis, Insights and Forecast - by Refining
- 6.2. Market Analysis, Insights and Forecast - by Petrochemicals
- 6.1. Market Analysis, Insights and Forecast - by Refining
- 7. South America UAE Oil and Gas Downstream Industry Analysis, Insights and Forecast, 2019-2031
- 7.1. Market Analysis, Insights and Forecast - by Refining
- 7.2. Market Analysis, Insights and Forecast - by Petrochemicals
- 7.1. Market Analysis, Insights and Forecast - by Refining
- 8. Europe UAE Oil and Gas Downstream Industry Analysis, Insights and Forecast, 2019-2031
- 8.1. Market Analysis, Insights and Forecast - by Refining
- 8.2. Market Analysis, Insights and Forecast - by Petrochemicals
- 8.1. Market Analysis, Insights and Forecast - by Refining
- 9. Middle East & Africa UAE Oil and Gas Downstream Industry Analysis, Insights and Forecast, 2019-2031
- 9.1. Market Analysis, Insights and Forecast - by Refining
- 9.2. Market Analysis, Insights and Forecast - by Petrochemicals
- 9.1. Market Analysis, Insights and Forecast - by Refining
- 10. Asia Pacific UAE Oil and Gas Downstream Industry Analysis, Insights and Forecast, 2019-2031
- 10.1. Market Analysis, Insights and Forecast - by Refining
- 10.2. Market Analysis, Insights and Forecast - by Petrochemicals
- 10.1. Market Analysis, Insights and Forecast - by Refining
- 11. UAE UAE Oil and Gas Downstream Industry Analysis, Insights and Forecast, 2019-2031
- 12. South Africa UAE Oil and Gas Downstream Industry Analysis, Insights and Forecast, 2019-2031
- 13. Saudi Arabia UAE Oil and Gas Downstream Industry Analysis, Insights and Forecast, 2019-2031
- 14. Rest of MEA UAE Oil and Gas Downstream Industry Analysis, Insights and Forecast, 2019-2031
- 15. Competitive Analysis
- 15.1. Global Market Share Analysis 2024
- 15.2. Company Profiles
- 15.2.1 Abu Dhabi National Oil Co
- 15.2.1.1. Overview
- 15.2.1.2. Products
- 15.2.1.3. SWOT Analysis
- 15.2.1.4. Recent Developments
- 15.2.1.5. Financials (Based on Availability)
- 15.2.2 Sunrise Petroleum FZC
- 15.2.2.1. Overview
- 15.2.2.2. Products
- 15.2.2.3. SWOT Analysis
- 15.2.2.4. Recent Developments
- 15.2.2.5. Financials (Based on Availability)
- 15.2.3 Proman AG*List Not Exhaustive
- 15.2.3.1. Overview
- 15.2.3.2. Products
- 15.2.3.3. SWOT Analysis
- 15.2.3.4. Recent Developments
- 15.2.3.5. Financials (Based on Availability)
- 15.2.4 Exxon Mobil Corporation
- 15.2.4.1. Overview
- 15.2.4.2. Products
- 15.2.4.3. SWOT Analysis
- 15.2.4.4. Recent Developments
- 15.2.4.5. Financials (Based on Availability)
- 15.2.5 Emirates National Oil Co
- 15.2.5.1. Overview
- 15.2.5.2. Products
- 15.2.5.3. SWOT Analysis
- 15.2.5.4. Recent Developments
- 15.2.5.5. Financials (Based on Availability)
- 15.2.6 TotalEnergies SA
- 15.2.6.1. Overview
- 15.2.6.2. Products
- 15.2.6.3. SWOT Analysis
- 15.2.6.4. Recent Developments
- 15.2.6.5. Financials (Based on Availability)
- 15.2.7 Royal Dutch Shell PLC
- 15.2.7.1. Overview
- 15.2.7.2. Products
- 15.2.7.3. SWOT Analysis
- 15.2.7.4. Recent Developments
- 15.2.7.5. Financials (Based on Availability)
- 15.2.8 Abu Dhabi Polymers Company Ltd
- 15.2.8.1. Overview
- 15.2.8.2. Products
- 15.2.8.3. SWOT Analysis
- 15.2.8.4. Recent Developments
- 15.2.8.5. Financials (Based on Availability)
- 15.2.1 Abu Dhabi National Oil Co
List of Figures
- Figure 1: Global UAE Oil and Gas Downstream Industry Revenue Breakdown (Million, %) by Region 2024 & 2032
- Figure 2: Global UAE Oil and Gas Downstream Industry Volume Breakdown (Tonnes, %) by Region 2024 & 2032
- Figure 3: Middle East & Africa UAE Oil and Gas Downstream Industry Revenue (Million), by Country 2024 & 2032
- Figure 4: Middle East & Africa UAE Oil and Gas Downstream Industry Volume (Tonnes), by Country 2024 & 2032
- Figure 5: Middle East & Africa UAE Oil and Gas Downstream Industry Revenue Share (%), by Country 2024 & 2032
- Figure 6: Middle East & Africa UAE Oil and Gas Downstream Industry Volume Share (%), by Country 2024 & 2032
- Figure 7: North America UAE Oil and Gas Downstream Industry Revenue (Million), by Refining 2024 & 2032
- Figure 8: North America UAE Oil and Gas Downstream Industry Volume (Tonnes), by Refining 2024 & 2032
- Figure 9: North America UAE Oil and Gas Downstream Industry Revenue Share (%), by Refining 2024 & 2032
- Figure 10: North America UAE Oil and Gas Downstream Industry Volume Share (%), by Refining 2024 & 2032
- Figure 11: North America UAE Oil and Gas Downstream Industry Revenue (Million), by Petrochemicals 2024 & 2032
- Figure 12: North America UAE Oil and Gas Downstream Industry Volume (Tonnes), by Petrochemicals 2024 & 2032
- Figure 13: North America UAE Oil and Gas Downstream Industry Revenue Share (%), by Petrochemicals 2024 & 2032
- Figure 14: North America UAE Oil and Gas Downstream Industry Volume Share (%), by Petrochemicals 2024 & 2032
- Figure 15: North America UAE Oil and Gas Downstream Industry Revenue (Million), by Country 2024 & 2032
- Figure 16: North America UAE Oil and Gas Downstream Industry Volume (Tonnes), by Country 2024 & 2032
- Figure 17: North America UAE Oil and Gas Downstream Industry Revenue Share (%), by Country 2024 & 2032
- Figure 18: North America UAE Oil and Gas Downstream Industry Volume Share (%), by Country 2024 & 2032
- Figure 19: South America UAE Oil and Gas Downstream Industry Revenue (Million), by Refining 2024 & 2032
- Figure 20: South America UAE Oil and Gas Downstream Industry Volume (Tonnes), by Refining 2024 & 2032
- Figure 21: South America UAE Oil and Gas Downstream Industry Revenue Share (%), by Refining 2024 & 2032
- Figure 22: South America UAE Oil and Gas Downstream Industry Volume Share (%), by Refining 2024 & 2032
- Figure 23: South America UAE Oil and Gas Downstream Industry Revenue (Million), by Petrochemicals 2024 & 2032
- Figure 24: South America UAE Oil and Gas Downstream Industry Volume (Tonnes), by Petrochemicals 2024 & 2032
- Figure 25: South America UAE Oil and Gas Downstream Industry Revenue Share (%), by Petrochemicals 2024 & 2032
- Figure 26: South America UAE Oil and Gas Downstream Industry Volume Share (%), by Petrochemicals 2024 & 2032
- Figure 27: South America UAE Oil and Gas Downstream Industry Revenue (Million), by Country 2024 & 2032
- Figure 28: South America UAE Oil and Gas Downstream Industry Volume (Tonnes), by Country 2024 & 2032
- Figure 29: South America UAE Oil and Gas Downstream Industry Revenue Share (%), by Country 2024 & 2032
- Figure 30: South America UAE Oil and Gas Downstream Industry Volume Share (%), by Country 2024 & 2032
- Figure 31: Europe UAE Oil and Gas Downstream Industry Revenue (Million), by Refining 2024 & 2032
- Figure 32: Europe UAE Oil and Gas Downstream Industry Volume (Tonnes), by Refining 2024 & 2032
- Figure 33: Europe UAE Oil and Gas Downstream Industry Revenue Share (%), by Refining 2024 & 2032
- Figure 34: Europe UAE Oil and Gas Downstream Industry Volume Share (%), by Refining 2024 & 2032
- Figure 35: Europe UAE Oil and Gas Downstream Industry Revenue (Million), by Petrochemicals 2024 & 2032
- Figure 36: Europe UAE Oil and Gas Downstream Industry Volume (Tonnes), by Petrochemicals 2024 & 2032
- Figure 37: Europe UAE Oil and Gas Downstream Industry Revenue Share (%), by Petrochemicals 2024 & 2032
- Figure 38: Europe UAE Oil and Gas Downstream Industry Volume Share (%), by Petrochemicals 2024 & 2032
- Figure 39: Europe UAE Oil and Gas Downstream Industry Revenue (Million), by Country 2024 & 2032
- Figure 40: Europe UAE Oil and Gas Downstream Industry Volume (Tonnes), by Country 2024 & 2032
- Figure 41: Europe UAE Oil and Gas Downstream Industry Revenue Share (%), by Country 2024 & 2032
- Figure 42: Europe UAE Oil and Gas Downstream Industry Volume Share (%), by Country 2024 & 2032
- Figure 43: Middle East & Africa UAE Oil and Gas Downstream Industry Revenue (Million), by Refining 2024 & 2032
- Figure 44: Middle East & Africa UAE Oil and Gas Downstream Industry Volume (Tonnes), by Refining 2024 & 2032
- Figure 45: Middle East & Africa UAE Oil and Gas Downstream Industry Revenue Share (%), by Refining 2024 & 2032
- Figure 46: Middle East & Africa UAE Oil and Gas Downstream Industry Volume Share (%), by Refining 2024 & 2032
- Figure 47: Middle East & Africa UAE Oil and Gas Downstream Industry Revenue (Million), by Petrochemicals 2024 & 2032
- Figure 48: Middle East & Africa UAE Oil and Gas Downstream Industry Volume (Tonnes), by Petrochemicals 2024 & 2032
- Figure 49: Middle East & Africa UAE Oil and Gas Downstream Industry Revenue Share (%), by Petrochemicals 2024 & 2032
- Figure 50: Middle East & Africa UAE Oil and Gas Downstream Industry Volume Share (%), by Petrochemicals 2024 & 2032
- Figure 51: Middle East & Africa UAE Oil and Gas Downstream Industry Revenue (Million), by Country 2024 & 2032
- Figure 52: Middle East & Africa UAE Oil and Gas Downstream Industry Volume (Tonnes), by Country 2024 & 2032
- Figure 53: Middle East & Africa UAE Oil and Gas Downstream Industry Revenue Share (%), by Country 2024 & 2032
- Figure 54: Middle East & Africa UAE Oil and Gas Downstream Industry Volume Share (%), by Country 2024 & 2032
- Figure 55: Asia Pacific UAE Oil and Gas Downstream Industry Revenue (Million), by Refining 2024 & 2032
- Figure 56: Asia Pacific UAE Oil and Gas Downstream Industry Volume (Tonnes), by Refining 2024 & 2032
- Figure 57: Asia Pacific UAE Oil and Gas Downstream Industry Revenue Share (%), by Refining 2024 & 2032
- Figure 58: Asia Pacific UAE Oil and Gas Downstream Industry Volume Share (%), by Refining 2024 & 2032
- Figure 59: Asia Pacific UAE Oil and Gas Downstream Industry Revenue (Million), by Petrochemicals 2024 & 2032
- Figure 60: Asia Pacific UAE Oil and Gas Downstream Industry Volume (Tonnes), by Petrochemicals 2024 & 2032
- Figure 61: Asia Pacific UAE Oil and Gas Downstream Industry Revenue Share (%), by Petrochemicals 2024 & 2032
- Figure 62: Asia Pacific UAE Oil and Gas Downstream Industry Volume Share (%), by Petrochemicals 2024 & 2032
- Figure 63: Asia Pacific UAE Oil and Gas Downstream Industry Revenue (Million), by Country 2024 & 2032
- Figure 64: Asia Pacific UAE Oil and Gas Downstream Industry Volume (Tonnes), by Country 2024 & 2032
- Figure 65: Asia Pacific UAE Oil and Gas Downstream Industry Revenue Share (%), by Country 2024 & 2032
- Figure 66: Asia Pacific UAE Oil and Gas Downstream Industry Volume Share (%), by Country 2024 & 2032
List of Tables
- Table 1: Global UAE Oil and Gas Downstream Industry Revenue Million Forecast, by Region 2019 & 2032
- Table 2: Global UAE Oil and Gas Downstream Industry Volume Tonnes Forecast, by Region 2019 & 2032
- Table 3: Global UAE Oil and Gas Downstream Industry Revenue Million Forecast, by Refining 2019 & 2032
- Table 4: Global UAE Oil and Gas Downstream Industry Volume Tonnes Forecast, by Refining 2019 & 2032
- Table 5: Global UAE Oil and Gas Downstream Industry Revenue Million Forecast, by Petrochemicals 2019 & 2032
- Table 6: Global UAE Oil and Gas Downstream Industry Volume Tonnes Forecast, by Petrochemicals 2019 & 2032
- Table 7: Global UAE Oil and Gas Downstream Industry Revenue Million Forecast, by Region 2019 & 2032
- Table 8: Global UAE Oil and Gas Downstream Industry Volume Tonnes Forecast, by Region 2019 & 2032
- Table 9: Global UAE Oil and Gas Downstream Industry Revenue Million Forecast, by Country 2019 & 2032
- Table 10: Global UAE Oil and Gas Downstream Industry Volume Tonnes Forecast, by Country 2019 & 2032
- Table 11: UAE UAE Oil and Gas Downstream Industry Revenue (Million) Forecast, by Application 2019 & 2032
- Table 12: UAE UAE Oil and Gas Downstream Industry Volume (Tonnes) Forecast, by Application 2019 & 2032
- Table 13: South Africa UAE Oil and Gas Downstream Industry Revenue (Million) Forecast, by Application 2019 & 2032
- Table 14: South Africa UAE Oil and Gas Downstream Industry Volume (Tonnes) Forecast, by Application 2019 & 2032
- Table 15: Saudi Arabia UAE Oil and Gas Downstream Industry Revenue (Million) Forecast, by Application 2019 & 2032
- Table 16: Saudi Arabia UAE Oil and Gas Downstream Industry Volume (Tonnes) Forecast, by Application 2019 & 2032
- Table 17: Rest of MEA UAE Oil and Gas Downstream Industry Revenue (Million) Forecast, by Application 2019 & 2032
- Table 18: Rest of MEA UAE Oil and Gas Downstream Industry Volume (Tonnes) Forecast, by Application 2019 & 2032
- Table 19: Global UAE Oil and Gas Downstream Industry Revenue Million Forecast, by Refining 2019 & 2032
- Table 20: Global UAE Oil and Gas Downstream Industry Volume Tonnes Forecast, by Refining 2019 & 2032
- Table 21: Global UAE Oil and Gas Downstream Industry Revenue Million Forecast, by Petrochemicals 2019 & 2032
- Table 22: Global UAE Oil and Gas Downstream Industry Volume Tonnes Forecast, by Petrochemicals 2019 & 2032
- Table 23: Global UAE Oil and Gas Downstream Industry Revenue Million Forecast, by Country 2019 & 2032
- Table 24: Global UAE Oil and Gas Downstream Industry Volume Tonnes Forecast, by Country 2019 & 2032
- Table 25: United States UAE Oil and Gas Downstream Industry Revenue (Million) Forecast, by Application 2019 & 2032
- Table 26: United States UAE Oil and Gas Downstream Industry Volume (Tonnes) Forecast, by Application 2019 & 2032
- Table 27: Canada UAE Oil and Gas Downstream Industry Revenue (Million) Forecast, by Application 2019 & 2032
- Table 28: Canada UAE Oil and Gas Downstream Industry Volume (Tonnes) Forecast, by Application 2019 & 2032
- Table 29: Mexico UAE Oil and Gas Downstream Industry Revenue (Million) Forecast, by Application 2019 & 2032
- Table 30: Mexico UAE Oil and Gas Downstream Industry Volume (Tonnes) Forecast, by Application 2019 & 2032
- Table 31: Global UAE Oil and Gas Downstream Industry Revenue Million Forecast, by Refining 2019 & 2032
- Table 32: Global UAE Oil and Gas Downstream Industry Volume Tonnes Forecast, by Refining 2019 & 2032
- Table 33: Global UAE Oil and Gas Downstream Industry Revenue Million Forecast, by Petrochemicals 2019 & 2032
- Table 34: Global UAE Oil and Gas Downstream Industry Volume Tonnes Forecast, by Petrochemicals 2019 & 2032
- Table 35: Global UAE Oil and Gas Downstream Industry Revenue Million Forecast, by Country 2019 & 2032
- Table 36: Global UAE Oil and Gas Downstream Industry Volume Tonnes Forecast, by Country 2019 & 2032
- Table 37: Brazil UAE Oil and Gas Downstream Industry Revenue (Million) Forecast, by Application 2019 & 2032
- Table 38: Brazil UAE Oil and Gas Downstream Industry Volume (Tonnes) Forecast, by Application 2019 & 2032
- Table 39: Argentina UAE Oil and Gas Downstream Industry Revenue (Million) Forecast, by Application 2019 & 2032
- Table 40: Argentina UAE Oil and Gas Downstream Industry Volume (Tonnes) Forecast, by Application 2019 & 2032
- Table 41: Rest of South America UAE Oil and Gas Downstream Industry Revenue (Million) Forecast, by Application 2019 & 2032
- Table 42: Rest of South America UAE Oil and Gas Downstream Industry Volume (Tonnes) Forecast, by Application 2019 & 2032
- Table 43: Global UAE Oil and Gas Downstream Industry Revenue Million Forecast, by Refining 2019 & 2032
- Table 44: Global UAE Oil and Gas Downstream Industry Volume Tonnes Forecast, by Refining 2019 & 2032
- Table 45: Global UAE Oil and Gas Downstream Industry Revenue Million Forecast, by Petrochemicals 2019 & 2032
- Table 46: Global UAE Oil and Gas Downstream Industry Volume Tonnes Forecast, by Petrochemicals 2019 & 2032
- Table 47: Global UAE Oil and Gas Downstream Industry Revenue Million Forecast, by Country 2019 & 2032
- Table 48: Global UAE Oil and Gas Downstream Industry Volume Tonnes Forecast, by Country 2019 & 2032
- Table 49: United Kingdom UAE Oil and Gas Downstream Industry Revenue (Million) Forecast, by Application 2019 & 2032
- Table 50: United Kingdom UAE Oil and Gas Downstream Industry Volume (Tonnes) Forecast, by Application 2019 & 2032
- Table 51: Germany UAE Oil and Gas Downstream Industry Revenue (Million) Forecast, by Application 2019 & 2032
- Table 52: Germany UAE Oil and Gas Downstream Industry Volume (Tonnes) Forecast, by Application 2019 & 2032
- Table 53: France UAE Oil and Gas Downstream Industry Revenue (Million) Forecast, by Application 2019 & 2032
- Table 54: France UAE Oil and Gas Downstream Industry Volume (Tonnes) Forecast, by Application 2019 & 2032
- Table 55: Italy UAE Oil and Gas Downstream Industry Revenue (Million) Forecast, by Application 2019 & 2032
- Table 56: Italy UAE Oil and Gas Downstream Industry Volume (Tonnes) Forecast, by Application 2019 & 2032
- Table 57: Spain UAE Oil and Gas Downstream Industry Revenue (Million) Forecast, by Application 2019 & 2032
- Table 58: Spain UAE Oil and Gas Downstream Industry Volume (Tonnes) Forecast, by Application 2019 & 2032
- Table 59: Russia UAE Oil and Gas Downstream Industry Revenue (Million) Forecast, by Application 2019 & 2032
- Table 60: Russia UAE Oil and Gas Downstream Industry Volume (Tonnes) Forecast, by Application 2019 & 2032
- Table 61: Benelux UAE Oil and Gas Downstream Industry Revenue (Million) Forecast, by Application 2019 & 2032
- Table 62: Benelux UAE Oil and Gas Downstream Industry Volume (Tonnes) Forecast, by Application 2019 & 2032
- Table 63: Nordics UAE Oil and Gas Downstream Industry Revenue (Million) Forecast, by Application 2019 & 2032
- Table 64: Nordics UAE Oil and Gas Downstream Industry Volume (Tonnes) Forecast, by Application 2019 & 2032
- Table 65: Rest of Europe UAE Oil and Gas Downstream Industry Revenue (Million) Forecast, by Application 2019 & 2032
- Table 66: Rest of Europe UAE Oil and Gas Downstream Industry Volume (Tonnes) Forecast, by Application 2019 & 2032
- Table 67: Global UAE Oil and Gas Downstream Industry Revenue Million Forecast, by Refining 2019 & 2032
- Table 68: Global UAE Oil and Gas Downstream Industry Volume Tonnes Forecast, by Refining 2019 & 2032
- Table 69: Global UAE Oil and Gas Downstream Industry Revenue Million Forecast, by Petrochemicals 2019 & 2032
- Table 70: Global UAE Oil and Gas Downstream Industry Volume Tonnes Forecast, by Petrochemicals 2019 & 2032
- Table 71: Global UAE Oil and Gas Downstream Industry Revenue Million Forecast, by Country 2019 & 2032
- Table 72: Global UAE Oil and Gas Downstream Industry Volume Tonnes Forecast, by Country 2019 & 2032
- Table 73: Turkey UAE Oil and Gas Downstream Industry Revenue (Million) Forecast, by Application 2019 & 2032
- Table 74: Turkey UAE Oil and Gas Downstream Industry Volume (Tonnes) Forecast, by Application 2019 & 2032
- Table 75: Israel UAE Oil and Gas Downstream Industry Revenue (Million) Forecast, by Application 2019 & 2032
- Table 76: Israel UAE Oil and Gas Downstream Industry Volume (Tonnes) Forecast, by Application 2019 & 2032
- Table 77: GCC UAE Oil and Gas Downstream Industry Revenue (Million) Forecast, by Application 2019 & 2032
- Table 78: GCC UAE Oil and Gas Downstream Industry Volume (Tonnes) Forecast, by Application 2019 & 2032
- Table 79: North Africa UAE Oil and Gas Downstream Industry Revenue (Million) Forecast, by Application 2019 & 2032
- Table 80: North Africa UAE Oil and Gas Downstream Industry Volume (Tonnes) Forecast, by Application 2019 & 2032
- Table 81: South Africa UAE Oil and Gas Downstream Industry Revenue (Million) Forecast, by Application 2019 & 2032
- Table 82: South Africa UAE Oil and Gas Downstream Industry Volume (Tonnes) Forecast, by Application 2019 & 2032
- Table 83: Rest of Middle East & Africa UAE Oil and Gas Downstream Industry Revenue (Million) Forecast, by Application 2019 & 2032
- Table 84: Rest of Middle East & Africa UAE Oil and Gas Downstream Industry Volume (Tonnes) Forecast, by Application 2019 & 2032
- Table 85: Global UAE Oil and Gas Downstream Industry Revenue Million Forecast, by Refining 2019 & 2032
- Table 86: Global UAE Oil and Gas Downstream Industry Volume Tonnes Forecast, by Refining 2019 & 2032
- Table 87: Global UAE Oil and Gas Downstream Industry Revenue Million Forecast, by Petrochemicals 2019 & 2032
- Table 88: Global UAE Oil and Gas Downstream Industry Volume Tonnes Forecast, by Petrochemicals 2019 & 2032
- Table 89: Global UAE Oil and Gas Downstream Industry Revenue Million Forecast, by Country 2019 & 2032
- Table 90: Global UAE Oil and Gas Downstream Industry Volume Tonnes Forecast, by Country 2019 & 2032
- Table 91: China UAE Oil and Gas Downstream Industry Revenue (Million) Forecast, by Application 2019 & 2032
- Table 92: China UAE Oil and Gas Downstream Industry Volume (Tonnes) Forecast, by Application 2019 & 2032
- Table 93: India UAE Oil and Gas Downstream Industry Revenue (Million) Forecast, by Application 2019 & 2032
- Table 94: India UAE Oil and Gas Downstream Industry Volume (Tonnes) Forecast, by Application 2019 & 2032
- Table 95: Japan UAE Oil and Gas Downstream Industry Revenue (Million) Forecast, by Application 2019 & 2032
- Table 96: Japan UAE Oil and Gas Downstream Industry Volume (Tonnes) Forecast, by Application 2019 & 2032
- Table 97: South Korea UAE Oil and Gas Downstream Industry Revenue (Million) Forecast, by Application 2019 & 2032
- Table 98: South Korea UAE Oil and Gas Downstream Industry Volume (Tonnes) Forecast, by Application 2019 & 2032
- Table 99: ASEAN UAE Oil and Gas Downstream Industry Revenue (Million) Forecast, by Application 2019 & 2032
- Table 100: ASEAN UAE Oil and Gas Downstream Industry Volume (Tonnes) Forecast, by Application 2019 & 2032
- Table 101: Oceania UAE Oil and Gas Downstream Industry Revenue (Million) Forecast, by Application 2019 & 2032
- Table 102: Oceania UAE Oil and Gas Downstream Industry Volume (Tonnes) Forecast, by Application 2019 & 2032
- Table 103: Rest of Asia Pacific UAE Oil and Gas Downstream Industry Revenue (Million) Forecast, by Application 2019 & 2032
- Table 104: Rest of Asia Pacific UAE Oil and Gas Downstream Industry Volume (Tonnes) Forecast, by Application 2019 & 2032
Frequently Asked Questions
1. What is the projected Compound Annual Growth Rate (CAGR) of the UAE Oil and Gas Downstream Industry?
The projected CAGR is approximately > 1.00%.
2. Which companies are prominent players in the UAE Oil and Gas Downstream Industry?
Key companies in the market include Abu Dhabi National Oil Co, Sunrise Petroleum FZC, Proman AG*List Not Exhaustive, Exxon Mobil Corporation, Emirates National Oil Co, TotalEnergies SA, Royal Dutch Shell PLC, Abu Dhabi Polymers Company Ltd.
3. What are the main segments of the UAE Oil and Gas Downstream Industry?
The market segments include Refining, Petrochemicals.
4. Can you provide details about the market size?
The market size is estimated to be USD XX Million as of 2022.
5. What are some drivers contributing to market growth?
4.; Increasing Renewables Capacity in Thailand4.; Rising Modernization of Existing Transmission and Distribution Infrastructure.
6. What are the notable trends driving market growth?
Refining Sector to Witness Significant Growth.
7. Are there any restraints impacting market growth?
4.; Huge Capital Expenditure Required for Carrying out Modernization of Existing Facilities.
8. Can you provide examples of recent developments in the market?
In March 2022, Proman signed an agreement with Abu Dhabi National Oil Company ('ADNOC') to construct the UAE's first world-scale methanol production facility at the TA'ZIZ Industrial Chemicals Zone in Ruwais, Abu Dhabi. This agreement is under the terms of Abu Dhabi Chemicals Derivatives Company RSC Ltd. In collaboration with Proman, TA'ZIZ will construct a facility to convert natural gas into methanol with an anticipated annual capacity of up to 1.8 million ton.
9. What pricing options are available for accessing the report?
Pricing options include single-user, multi-user, and enterprise licenses priced at USD 3800, USD 4500, and USD 5800 respectively.
10. Is the market size provided in terms of value or volume?
The market size is provided in terms of value, measured in Million and volume, measured in Tonnes.
11. Are there any specific market keywords associated with the report?
Yes, the market keyword associated with the report is "UAE Oil and Gas Downstream Industry," which aids in identifying and referencing the specific market segment covered.
12. How do I determine which pricing option suits my needs best?
The pricing options vary based on user requirements and access needs. Individual users may opt for single-user licenses, while businesses requiring broader access may choose multi-user or enterprise licenses for cost-effective access to the report.
13. Are there any additional resources or data provided in the UAE Oil and Gas Downstream Industry report?
While the report offers comprehensive insights, it's advisable to review the specific contents or supplementary materials provided to ascertain if additional resources or data are available.
14. How can I stay updated on further developments or reports in the UAE Oil and Gas Downstream Industry?
To stay informed about further developments, trends, and reports in the UAE Oil and Gas Downstream Industry, consider subscribing to industry newsletters, following relevant companies and organizations, or regularly checking reputable industry news sources and publications.
Methodology
Step 1 - Identification of Relevant Samples Size from Population Database


Step 2 - Approaches for Defining Global Market Size (Value, Volume* & Price*)

Note*: In applicable scenarios
Step 3 - Data Sources
Primary Research
- Web Analytics
- Survey Reports
- Research Institute
- Latest Research Reports
- Opinion Leaders
Secondary Research
- Annual Reports
- White Paper
- Latest Press Release
- Industry Association
- Paid Database
- Investor Presentations

Step 4 - Data Triangulation
Involves using different sources of information in order to increase the validity of a study
These sources are likely to be stakeholders in a program - participants, other researchers, program staff, other community members, and so on.
Then we put all data in single framework & apply various statistical tools to find out the dynamic on the market.
During the analysis stage, feedback from the stakeholder groups would be compared to determine areas of agreement as well as areas of divergence


