
Key Insights
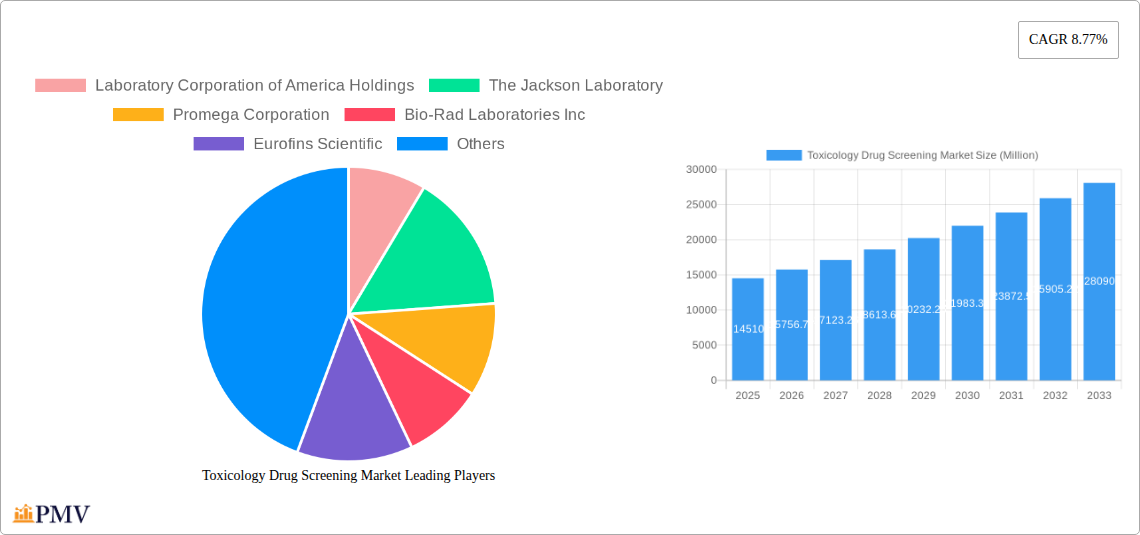
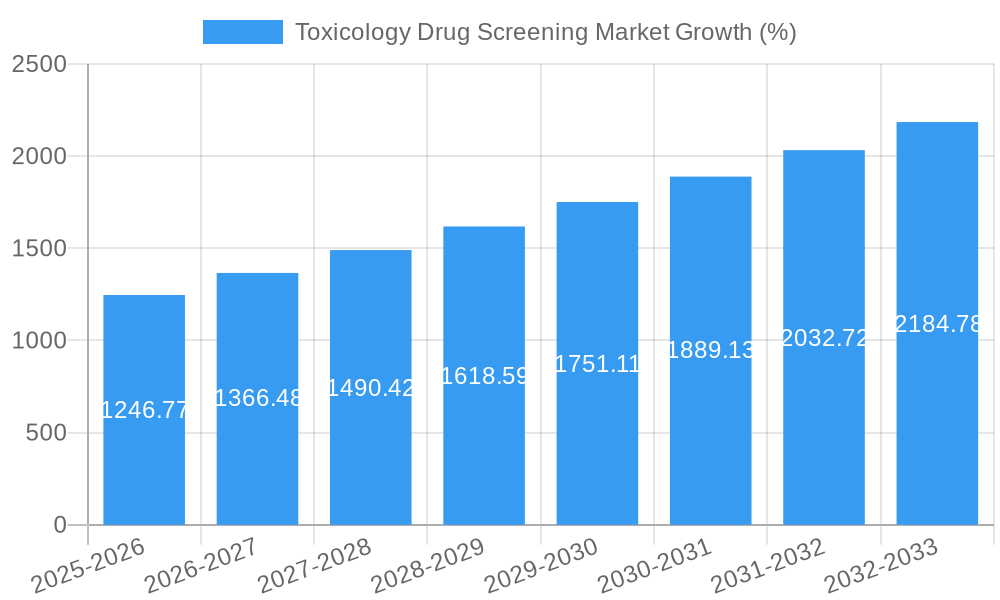
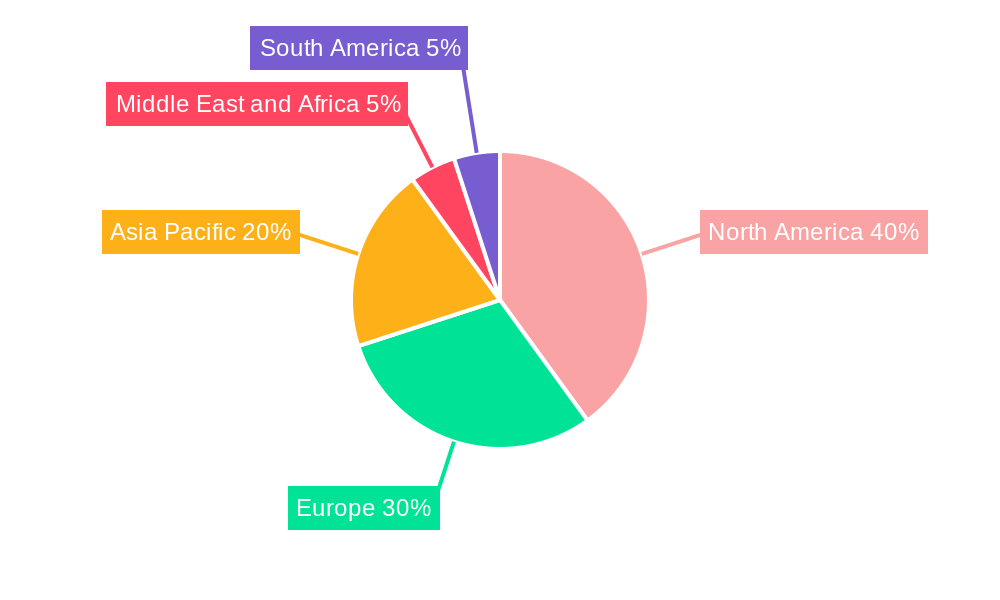
The toxicology drug screening market, valued at $14.51 billion in 2025, is projected to experience robust growth, driven by the increasing need for rigorous drug safety assessments before clinical trials and market launch. The market's Compound Annual Growth Rate (CAGR) of 8.77% from 2025 to 2033 reflects a significant expansion, fueled by several key factors. Advances in in-vitro, in-vivo, and in-silico testing methods offer enhanced accuracy, reduced reliance on animal models, and faster testing cycles, leading to increased adoption across the pharmaceutical and biotechnology sectors. Growing awareness of potential drug-induced toxicities, coupled with stringent regulatory requirements for drug approval, further bolster market expansion. The increasing prevalence of chronic diseases globally necessitates a higher volume of drug development, thus increasing the demand for toxicology drug screening services. Segmentation reveals a strong emphasis on in-vitro testing, given its cost-effectiveness and efficiency. Instruments, reagents, and consumables represent a significant portion of the product segment, reflecting the technical nature of the testing procedures. Immunotoxicity, systemic toxicity, and developmental and reproductive toxicity (DART) assessments constitute major application areas. Geographically, North America and Europe currently hold substantial market shares due to well-established research infrastructure and stringent regulatory frameworks, while Asia-Pacific is expected to witness the fastest growth owing to expanding pharmaceutical industries and increasing investment in research and development.
Key players like Laboratory Corporation of America Holdings, Charles River Laboratories, and Thermo Fisher Scientific are driving innovation and market penetration through strategic partnerships, acquisitions, and the development of advanced technologies. While the market faces challenges such as high testing costs and ethical concerns surrounding animal testing, the overall outlook remains positive, with consistent growth driven by the aforementioned factors. The market is poised for further expansion as technological advancements continue to enhance the efficiency and accuracy of toxicology drug screening. The shift towards personalized medicine will also further stimulate market demand for tailored toxicological evaluations.
Toxicology Drug Screening Market: A Comprehensive Report (2019-2033)
This comprehensive report provides an in-depth analysis of the global Toxicology Drug Screening Market, offering valuable insights for stakeholders across the pharmaceutical, biotechnology, and healthcare industries. With a detailed examination of market dynamics, competitive landscape, and future projections, this report is an essential resource for strategic decision-making. The study period covers 2019-2033, with 2025 as the base and estimated year. The forecast period spans 2025-2033, and the historical period encompasses 2019-2024. The market is expected to reach xx Million by 2033, exhibiting a CAGR of xx% during the forecast period.
Toxicology Drug Screening Market Market Structure & Competitive Dynamics
The Toxicology Drug Screening Market is characterized by a moderately concentrated landscape with several key players vying for market share. Market concentration is influenced by factors such as technological advancements, regulatory compliance, and the emergence of new players. The market displays a robust innovation ecosystem, driven by continuous research and development in analytical techniques, software solutions, and animal models. Stringent regulatory frameworks, particularly concerning data privacy and safety protocols, significantly impact market dynamics. The existence of substitute technologies, such as advanced imaging techniques, also influences market competitiveness. End-user trends, including a growing emphasis on personalized medicine and predictive toxicology, are shaping market demands. Significant M&A activities have been observed, with deal values ranging from xx Million to xx Million, primarily focused on expanding product portfolios and geographical reach. Key players such as Laboratory Corporation of America Holdings and Thermo Fisher Scientific hold significant market shares, while emerging players are increasingly disrupting the market with innovative offerings.
- Market Share: Top 5 players collectively hold approximately xx% of the market share.
- M&A Activity: Significant M&A activity observed in the last 5 years, driven by consolidation and technological expansion. Average deal value: xx Million.
- Innovation Ecosystem: Active investments in R&D focusing on advanced analytical techniques and software solutions.
- Regulatory Landscape: Stringent regulations concerning data privacy, safety protocols, and ethical considerations.
Toxicology Drug Screening Market Industry Trends & Insights
The Toxicology Drug Screening Market is experiencing robust growth, driven by several key factors. Increasing demand for drug safety assessments, expanding clinical trials, and the rising prevalence of chronic diseases are significant growth drivers. Technological disruptions, particularly in the areas of genomics, proteomics, and advanced analytical techniques, are revolutionizing toxicology testing methods. This leads to improved accuracy, speed, and cost-effectiveness. Consumer preferences are shifting towards non-animal testing methods, fostering demand for in silico and in vitro techniques. Competitive dynamics involve strategic partnerships, product innovations, and the emergence of new players, especially in the field of computational toxicology. Market penetration of advanced technologies, such as LC-MS, is expected to increase substantially, driven by their ability to identify and quantify a broader range of drugs and metabolites.
Dominant Markets & Segments in Toxicology Drug Screening Market
North America currently dominates the Toxicology Drug Screening Market, driven by a robust healthcare infrastructure, stringent regulatory standards, and high R&D investments. The In Vitro testing type holds a significant share, owing to its cost-effectiveness and relatively faster turnaround time compared to In Vivo methods. Instruments and Reagents and Consumables dominate the product segment, fueled by the demand for advanced analytical tools and consumables. Systemic toxicity is the leading application segment, reflecting the focus on evaluating the overall effects of drugs on the organism.
- Key Drivers for North American Dominance:
- Advanced healthcare infrastructure
- Stringent regulatory environment
- High pharmaceutical and biotechnology R&D spending
- In Vitro Testing Type: Driven by cost-effectiveness, speed, and ethical concerns.
- Instruments and Reagents and Consumables: High demand for sophisticated equipment and consumables for precise analyses.
- Systemic Toxicity Application: Critical for comprehensive evaluation of drug effects on the body.
Toxicology Drug Screening Market Product Innovations
Recent product innovations in the toxicology drug screening market focus on enhancing speed, accuracy, and efficiency. Advanced mass spectrometry (MS) systems, such as those recently launched by Thermo Fisher, enable more precise and faster detection of various compounds. Software solutions like Instem's Computational Toxicology Software Suite offer faster, more accurate predictions, reducing reliance on animal testing and speeding up drug development timelines. These innovations address market needs for higher throughput, reduced costs, and improved regulatory compliance.
Report Segmentation & Scope
The report segments the Toxicology Drug Screening Market based on Testing Type (In Vitro, In Vivo, In Silico), Product (Instruments, Reagents and Consumables, Animal Models, Software, Other Products), and Application (Immunotoxicity, Systemic toxicity, Developmental and Reproductive Toxicity (DART), Endocrine Disruption, Other Applications). Each segment's growth projections, market size, and competitive dynamics are analyzed in detail. The In Vitro segment showcases significant growth due to its cost-effectiveness and ethical considerations, while the software segment experiences substantial growth due to the increasing adoption of computational toxicology tools.
Key Drivers of Toxicology Drug Screening Market Growth
Several factors drive the growth of the Toxicology Drug Screening Market:
- Technological Advancements: Development of high-throughput screening techniques, advanced mass spectrometry, and sophisticated software solutions.
- Stringent Regulatory Compliance: Growing regulatory pressure for thorough drug safety assessments.
- Rising Prevalence of Chronic Diseases: Increased demand for drug development and testing for various chronic conditions.
Challenges in the Toxicology Drug Screening Market Sector
The Toxicology Drug Screening Market faces challenges, including:
- High Costs: High development and testing costs associated with sophisticated equipment and regulatory compliance.
- Ethical Concerns: Concerns related to animal testing and the need for alternative testing methods.
- Regulatory Hurdles: Complex and evolving regulatory landscapes affecting testing procedures and approvals.
Leading Players in the Toxicology Drug Screening Market Market
- Laboratory Corporation of America Holdings
- The Jackson Laboratory
- Promega Corporation
- Bio-Rad Laboratories Inc
- Eurofins Scientific
- Charles River Laboratories International Inc
- Thermo Fisher Scientific Inc
- Agilent Technologies Inc
- Enzo Life Sciences Inc
- BioReliance Inc (Merck)
- Danaher
- Wuxi AppTec
Key Developments in Toxicology Drug Screening Market Sector
- June 2022: Thermo Fisher Scientific launched a new liquid chromatography-mass spectrometry (LC-MS) system for forensic toxicology, enhancing drug detection capabilities.
- November 2022: Instem updated its Computational Toxicology Software Suite, providing access to over 600,000 toxicology studies, accelerating drug development and regulatory compliance.
Strategic Toxicology Drug Screening Market Market Outlook
The Toxicology Drug Screening Market presents significant growth opportunities. Continued advancements in analytical techniques, computational toxicology, and automation will drive market expansion. Focus on developing cost-effective, ethically sound, and high-throughput testing methods will further enhance market potential. Strategic partnerships and collaborations between companies will shape the future competitive landscape. The growing demand for personalized medicine and predictive toxicology will create significant market opportunities in the coming years.
Toxicology Drug Screening Market Segmentation
-
1. Testing Type
- 1.1. In Vitro
- 1.2. In Vivo
- 1.3. In Silico
-
2. Product
- 2.1. Instruments
- 2.2. Reagents and Consumables
- 2.3. Animal Models
- 2.4. Software
- 2.5. Other Products
-
3. Application
- 3.1. Immunotoxicity
- 3.2. Systemictoxicity
- 3.3. Developmental and Reproductive Toxicity (DART)
- 3.4. Endocrine Disruption
- 3.5. Other Applications
Toxicology Drug Screening Market Segmentation By Geography
-
1. North America
- 1.1. United States
- 1.2. Canada
- 1.3. Mexico
-
2. Europe
- 2.1. Germany
- 2.2. United Kingdom
- 2.3. France
- 2.4. Italy
- 2.5. Spain
- 2.6. Rest of Europe
-
3. Asia Pacific
- 3.1. China
- 3.2. Japan
- 3.3. India
- 3.4. Australia
- 3.5. South Korea
- 3.6. Rest of Asia Pacific
-
4. Middle East and Africa
- 4.1. GCC
- 4.2. South Africa
- 4.3. Rest of Middle East and Africa
-
5. South America
- 5.1. Brazil
- 5.2. Argentina
- 5.3. Rest of South America
Toxicology Drug Screening Market REPORT HIGHLIGHTS
| Aspects | Details |
|---|---|
| Study Period | 2019-2033 |
| Base Year | 2024 |
| Estimated Year | 2025 |
| Forecast Period | 2025-2033 |
| Historical Period | 2019-2024 |
| Growth Rate | CAGR of 8.77% from 2019-2033 |
| Segmentation |
|
Table of Contents
- 1. Introduction
- 1.1. Research Scope
- 1.2. Market Segmentation
- 1.3. Research Methodology
- 1.4. Definitions and Assumptions
- 2. Executive Summary
- 2.1. Introduction
- 3. Market Dynamics
- 3.1. Introduction
- 3.2. Market Drivers
- 3.2.1. Increasing R&D Activities; Technological Advancements in Toxicology Drug Screening; Rise in Demand for Toxicology Drug Screening in Pharmaceuticals and Biotechnology
- 3.3. Market Restrains
- 3.3.1. Longer Time for Sample Testing; Regulatory Issues Regarding Approval of Healthcare Molecule
- 3.4. Market Trends
- 3.4.1. In Silico Segment is Expected to Witness Significant Growth Over the Forecast Period
- 4. Market Factor Analysis
- 4.1. Porters Five Forces
- 4.2. Supply/Value Chain
- 4.3. PESTEL analysis
- 4.4. Market Entropy
- 4.5. Patent/Trademark Analysis
- 5. Global Toxicology Drug Screening Market Analysis, Insights and Forecast, 2019-2031
- 5.1. Market Analysis, Insights and Forecast - by Testing Type
- 5.1.1. In Vitro
- 5.1.2. In Vivo
- 5.1.3. In Silico
- 5.2. Market Analysis, Insights and Forecast - by Product
- 5.2.1. Instruments
- 5.2.2. Reagents and Consumables
- 5.2.3. Animal Models
- 5.2.4. Software
- 5.2.5. Other Products
- 5.3. Market Analysis, Insights and Forecast - by Application
- 5.3.1. Immunotoxicity
- 5.3.2. Systemictoxicity
- 5.3.3. Developmental and Reproductive Toxicity (DART)
- 5.3.4. Endocrine Disruption
- 5.3.5. Other Applications
- 5.4. Market Analysis, Insights and Forecast - by Region
- 5.4.1. North America
- 5.4.2. Europe
- 5.4.3. Asia Pacific
- 5.4.4. Middle East and Africa
- 5.4.5. South America
- 5.1. Market Analysis, Insights and Forecast - by Testing Type
- 6. North America Toxicology Drug Screening Market Analysis, Insights and Forecast, 2019-2031
- 6.1. Market Analysis, Insights and Forecast - by Testing Type
- 6.1.1. In Vitro
- 6.1.2. In Vivo
- 6.1.3. In Silico
- 6.2. Market Analysis, Insights and Forecast - by Product
- 6.2.1. Instruments
- 6.2.2. Reagents and Consumables
- 6.2.3. Animal Models
- 6.2.4. Software
- 6.2.5. Other Products
- 6.3. Market Analysis, Insights and Forecast - by Application
- 6.3.1. Immunotoxicity
- 6.3.2. Systemictoxicity
- 6.3.3. Developmental and Reproductive Toxicity (DART)
- 6.3.4. Endocrine Disruption
- 6.3.5. Other Applications
- 6.1. Market Analysis, Insights and Forecast - by Testing Type
- 7. Europe Toxicology Drug Screening Market Analysis, Insights and Forecast, 2019-2031
- 7.1. Market Analysis, Insights and Forecast - by Testing Type
- 7.1.1. In Vitro
- 7.1.2. In Vivo
- 7.1.3. In Silico
- 7.2. Market Analysis, Insights and Forecast - by Product
- 7.2.1. Instruments
- 7.2.2. Reagents and Consumables
- 7.2.3. Animal Models
- 7.2.4. Software
- 7.2.5. Other Products
- 7.3. Market Analysis, Insights and Forecast - by Application
- 7.3.1. Immunotoxicity
- 7.3.2. Systemictoxicity
- 7.3.3. Developmental and Reproductive Toxicity (DART)
- 7.3.4. Endocrine Disruption
- 7.3.5. Other Applications
- 7.1. Market Analysis, Insights and Forecast - by Testing Type
- 8. Asia Pacific Toxicology Drug Screening Market Analysis, Insights and Forecast, 2019-2031
- 8.1. Market Analysis, Insights and Forecast - by Testing Type
- 8.1.1. In Vitro
- 8.1.2. In Vivo
- 8.1.3. In Silico
- 8.2. Market Analysis, Insights and Forecast - by Product
- 8.2.1. Instruments
- 8.2.2. Reagents and Consumables
- 8.2.3. Animal Models
- 8.2.4. Software
- 8.2.5. Other Products
- 8.3. Market Analysis, Insights and Forecast - by Application
- 8.3.1. Immunotoxicity
- 8.3.2. Systemictoxicity
- 8.3.3. Developmental and Reproductive Toxicity (DART)
- 8.3.4. Endocrine Disruption
- 8.3.5. Other Applications
- 8.1. Market Analysis, Insights and Forecast - by Testing Type
- 9. Middle East and Africa Toxicology Drug Screening Market Analysis, Insights and Forecast, 2019-2031
- 9.1. Market Analysis, Insights and Forecast - by Testing Type
- 9.1.1. In Vitro
- 9.1.2. In Vivo
- 9.1.3. In Silico
- 9.2. Market Analysis, Insights and Forecast - by Product
- 9.2.1. Instruments
- 9.2.2. Reagents and Consumables
- 9.2.3. Animal Models
- 9.2.4. Software
- 9.2.5. Other Products
- 9.3. Market Analysis, Insights and Forecast - by Application
- 9.3.1. Immunotoxicity
- 9.3.2. Systemictoxicity
- 9.3.3. Developmental and Reproductive Toxicity (DART)
- 9.3.4. Endocrine Disruption
- 9.3.5. Other Applications
- 9.1. Market Analysis, Insights and Forecast - by Testing Type
- 10. South America Toxicology Drug Screening Market Analysis, Insights and Forecast, 2019-2031
- 10.1. Market Analysis, Insights and Forecast - by Testing Type
- 10.1.1. In Vitro
- 10.1.2. In Vivo
- 10.1.3. In Silico
- 10.2. Market Analysis, Insights and Forecast - by Product
- 10.2.1. Instruments
- 10.2.2. Reagents and Consumables
- 10.2.3. Animal Models
- 10.2.4. Software
- 10.2.5. Other Products
- 10.3. Market Analysis, Insights and Forecast - by Application
- 10.3.1. Immunotoxicity
- 10.3.2. Systemictoxicity
- 10.3.3. Developmental and Reproductive Toxicity (DART)
- 10.3.4. Endocrine Disruption
- 10.3.5. Other Applications
- 10.1. Market Analysis, Insights and Forecast - by Testing Type
- 11. North America Toxicology Drug Screening Market Analysis, Insights and Forecast, 2019-2031
- 11.1. Market Analysis, Insights and Forecast - By Country/Sub-region
- 11.1.1 United States
- 11.1.2 Canada
- 11.1.3 Mexico
- 12. Europe Toxicology Drug Screening Market Analysis, Insights and Forecast, 2019-2031
- 12.1. Market Analysis, Insights and Forecast - By Country/Sub-region
- 12.1.1 Germany
- 12.1.2 United Kingdom
- 12.1.3 France
- 12.1.4 Italy
- 12.1.5 Spain
- 12.1.6 Rest of Europe
- 13. Asia Pacific Toxicology Drug Screening Market Analysis, Insights and Forecast, 2019-2031
- 13.1. Market Analysis, Insights and Forecast - By Country/Sub-region
- 13.1.1 China
- 13.1.2 Japan
- 13.1.3 India
- 13.1.4 Australia
- 13.1.5 South Korea
- 13.1.6 Rest of Asia Pacific
- 14. Middle East and Africa Toxicology Drug Screening Market Analysis, Insights and Forecast, 2019-2031
- 14.1. Market Analysis, Insights and Forecast - By Country/Sub-region
- 14.1.1 GCC
- 14.1.2 South Africa
- 14.1.3 Rest of Middle East and Africa
- 15. South America Toxicology Drug Screening Market Analysis, Insights and Forecast, 2019-2031
- 15.1. Market Analysis, Insights and Forecast - By Country/Sub-region
- 15.1.1 Brazil
- 15.1.2 Argentina
- 15.1.3 Rest of South America
- 16. Competitive Analysis
- 16.1. Global Market Share Analysis 2024
- 16.2. Company Profiles
- 16.2.1 Laboratory Corporation of America Holdings
- 16.2.1.1. Overview
- 16.2.1.2. Products
- 16.2.1.3. SWOT Analysis
- 16.2.1.4. Recent Developments
- 16.2.1.5. Financials (Based on Availability)
- 16.2.2 The Jackson Laboratory
- 16.2.2.1. Overview
- 16.2.2.2. Products
- 16.2.2.3. SWOT Analysis
- 16.2.2.4. Recent Developments
- 16.2.2.5. Financials (Based on Availability)
- 16.2.3 Promega Corporation
- 16.2.3.1. Overview
- 16.2.3.2. Products
- 16.2.3.3. SWOT Analysis
- 16.2.3.4. Recent Developments
- 16.2.3.5. Financials (Based on Availability)
- 16.2.4 Bio-Rad Laboratories Inc
- 16.2.4.1. Overview
- 16.2.4.2. Products
- 16.2.4.3. SWOT Analysis
- 16.2.4.4. Recent Developments
- 16.2.4.5. Financials (Based on Availability)
- 16.2.5 Eurofins Scientific
- 16.2.5.1. Overview
- 16.2.5.2. Products
- 16.2.5.3. SWOT Analysis
- 16.2.5.4. Recent Developments
- 16.2.5.5. Financials (Based on Availability)
- 16.2.6 Charles River Laboratories International Inc
- 16.2.6.1. Overview
- 16.2.6.2. Products
- 16.2.6.3. SWOT Analysis
- 16.2.6.4. Recent Developments
- 16.2.6.5. Financials (Based on Availability)
- 16.2.7 Thermo Fisher Scientific Inc
- 16.2.7.1. Overview
- 16.2.7.2. Products
- 16.2.7.3. SWOT Analysis
- 16.2.7.4. Recent Developments
- 16.2.7.5. Financials (Based on Availability)
- 16.2.8 Agilent Technologies Inc
- 16.2.8.1. Overview
- 16.2.8.2. Products
- 16.2.8.3. SWOT Analysis
- 16.2.8.4. Recent Developments
- 16.2.8.5. Financials (Based on Availability)
- 16.2.9 Enzo Life Sciences Inc
- 16.2.9.1. Overview
- 16.2.9.2. Products
- 16.2.9.3. SWOT Analysis
- 16.2.9.4. Recent Developments
- 16.2.9.5. Financials (Based on Availability)
- 16.2.10 BioReliance Inc (Merck)
- 16.2.10.1. Overview
- 16.2.10.2. Products
- 16.2.10.3. SWOT Analysis
- 16.2.10.4. Recent Developments
- 16.2.10.5. Financials (Based on Availability)
- 16.2.11 Danaher
- 16.2.11.1. Overview
- 16.2.11.2. Products
- 16.2.11.3. SWOT Analysis
- 16.2.11.4. Recent Developments
- 16.2.11.5. Financials (Based on Availability)
- 16.2.12 Wuxi AppTec
- 16.2.12.1. Overview
- 16.2.12.2. Products
- 16.2.12.3. SWOT Analysis
- 16.2.12.4. Recent Developments
- 16.2.12.5. Financials (Based on Availability)
- 16.2.1 Laboratory Corporation of America Holdings
List of Figures
- Figure 1: Global Toxicology Drug Screening Market Revenue Breakdown (Million, %) by Region 2024 & 2032
- Figure 2: Global Toxicology Drug Screening Market Volume Breakdown (K Unit, %) by Region 2024 & 2032
- Figure 3: North America Toxicology Drug Screening Market Revenue (Million), by Country 2024 & 2032
- Figure 4: North America Toxicology Drug Screening Market Volume (K Unit), by Country 2024 & 2032
- Figure 5: North America Toxicology Drug Screening Market Revenue Share (%), by Country 2024 & 2032
- Figure 6: North America Toxicology Drug Screening Market Volume Share (%), by Country 2024 & 2032
- Figure 7: Europe Toxicology Drug Screening Market Revenue (Million), by Country 2024 & 2032
- Figure 8: Europe Toxicology Drug Screening Market Volume (K Unit), by Country 2024 & 2032
- Figure 9: Europe Toxicology Drug Screening Market Revenue Share (%), by Country 2024 & 2032
- Figure 10: Europe Toxicology Drug Screening Market Volume Share (%), by Country 2024 & 2032
- Figure 11: Asia Pacific Toxicology Drug Screening Market Revenue (Million), by Country 2024 & 2032
- Figure 12: Asia Pacific Toxicology Drug Screening Market Volume (K Unit), by Country 2024 & 2032
- Figure 13: Asia Pacific Toxicology Drug Screening Market Revenue Share (%), by Country 2024 & 2032
- Figure 14: Asia Pacific Toxicology Drug Screening Market Volume Share (%), by Country 2024 & 2032
- Figure 15: Middle East and Africa Toxicology Drug Screening Market Revenue (Million), by Country 2024 & 2032
- Figure 16: Middle East and Africa Toxicology Drug Screening Market Volume (K Unit), by Country 2024 & 2032
- Figure 17: Middle East and Africa Toxicology Drug Screening Market Revenue Share (%), by Country 2024 & 2032
- Figure 18: Middle East and Africa Toxicology Drug Screening Market Volume Share (%), by Country 2024 & 2032
- Figure 19: South America Toxicology Drug Screening Market Revenue (Million), by Country 2024 & 2032
- Figure 20: South America Toxicology Drug Screening Market Volume (K Unit), by Country 2024 & 2032
- Figure 21: South America Toxicology Drug Screening Market Revenue Share (%), by Country 2024 & 2032
- Figure 22: South America Toxicology Drug Screening Market Volume Share (%), by Country 2024 & 2032
- Figure 23: North America Toxicology Drug Screening Market Revenue (Million), by Testing Type 2024 & 2032
- Figure 24: North America Toxicology Drug Screening Market Volume (K Unit), by Testing Type 2024 & 2032
- Figure 25: North America Toxicology Drug Screening Market Revenue Share (%), by Testing Type 2024 & 2032
- Figure 26: North America Toxicology Drug Screening Market Volume Share (%), by Testing Type 2024 & 2032
- Figure 27: North America Toxicology Drug Screening Market Revenue (Million), by Product 2024 & 2032
- Figure 28: North America Toxicology Drug Screening Market Volume (K Unit), by Product 2024 & 2032
- Figure 29: North America Toxicology Drug Screening Market Revenue Share (%), by Product 2024 & 2032
- Figure 30: North America Toxicology Drug Screening Market Volume Share (%), by Product 2024 & 2032
- Figure 31: North America Toxicology Drug Screening Market Revenue (Million), by Application 2024 & 2032
- Figure 32: North America Toxicology Drug Screening Market Volume (K Unit), by Application 2024 & 2032
- Figure 33: North America Toxicology Drug Screening Market Revenue Share (%), by Application 2024 & 2032
- Figure 34: North America Toxicology Drug Screening Market Volume Share (%), by Application 2024 & 2032
- Figure 35: North America Toxicology Drug Screening Market Revenue (Million), by Country 2024 & 2032
- Figure 36: North America Toxicology Drug Screening Market Volume (K Unit), by Country 2024 & 2032
- Figure 37: North America Toxicology Drug Screening Market Revenue Share (%), by Country 2024 & 2032
- Figure 38: North America Toxicology Drug Screening Market Volume Share (%), by Country 2024 & 2032
- Figure 39: Europe Toxicology Drug Screening Market Revenue (Million), by Testing Type 2024 & 2032
- Figure 40: Europe Toxicology Drug Screening Market Volume (K Unit), by Testing Type 2024 & 2032
- Figure 41: Europe Toxicology Drug Screening Market Revenue Share (%), by Testing Type 2024 & 2032
- Figure 42: Europe Toxicology Drug Screening Market Volume Share (%), by Testing Type 2024 & 2032
- Figure 43: Europe Toxicology Drug Screening Market Revenue (Million), by Product 2024 & 2032
- Figure 44: Europe Toxicology Drug Screening Market Volume (K Unit), by Product 2024 & 2032
- Figure 45: Europe Toxicology Drug Screening Market Revenue Share (%), by Product 2024 & 2032
- Figure 46: Europe Toxicology Drug Screening Market Volume Share (%), by Product 2024 & 2032
- Figure 47: Europe Toxicology Drug Screening Market Revenue (Million), by Application 2024 & 2032
- Figure 48: Europe Toxicology Drug Screening Market Volume (K Unit), by Application 2024 & 2032
- Figure 49: Europe Toxicology Drug Screening Market Revenue Share (%), by Application 2024 & 2032
- Figure 50: Europe Toxicology Drug Screening Market Volume Share (%), by Application 2024 & 2032
- Figure 51: Europe Toxicology Drug Screening Market Revenue (Million), by Country 2024 & 2032
- Figure 52: Europe Toxicology Drug Screening Market Volume (K Unit), by Country 2024 & 2032
- Figure 53: Europe Toxicology Drug Screening Market Revenue Share (%), by Country 2024 & 2032
- Figure 54: Europe Toxicology Drug Screening Market Volume Share (%), by Country 2024 & 2032
- Figure 55: Asia Pacific Toxicology Drug Screening Market Revenue (Million), by Testing Type 2024 & 2032
- Figure 56: Asia Pacific Toxicology Drug Screening Market Volume (K Unit), by Testing Type 2024 & 2032
- Figure 57: Asia Pacific Toxicology Drug Screening Market Revenue Share (%), by Testing Type 2024 & 2032
- Figure 58: Asia Pacific Toxicology Drug Screening Market Volume Share (%), by Testing Type 2024 & 2032
- Figure 59: Asia Pacific Toxicology Drug Screening Market Revenue (Million), by Product 2024 & 2032
- Figure 60: Asia Pacific Toxicology Drug Screening Market Volume (K Unit), by Product 2024 & 2032
- Figure 61: Asia Pacific Toxicology Drug Screening Market Revenue Share (%), by Product 2024 & 2032
- Figure 62: Asia Pacific Toxicology Drug Screening Market Volume Share (%), by Product 2024 & 2032
- Figure 63: Asia Pacific Toxicology Drug Screening Market Revenue (Million), by Application 2024 & 2032
- Figure 64: Asia Pacific Toxicology Drug Screening Market Volume (K Unit), by Application 2024 & 2032
- Figure 65: Asia Pacific Toxicology Drug Screening Market Revenue Share (%), by Application 2024 & 2032
- Figure 66: Asia Pacific Toxicology Drug Screening Market Volume Share (%), by Application 2024 & 2032
- Figure 67: Asia Pacific Toxicology Drug Screening Market Revenue (Million), by Country 2024 & 2032
- Figure 68: Asia Pacific Toxicology Drug Screening Market Volume (K Unit), by Country 2024 & 2032
- Figure 69: Asia Pacific Toxicology Drug Screening Market Revenue Share (%), by Country 2024 & 2032
- Figure 70: Asia Pacific Toxicology Drug Screening Market Volume Share (%), by Country 2024 & 2032
- Figure 71: Middle East and Africa Toxicology Drug Screening Market Revenue (Million), by Testing Type 2024 & 2032
- Figure 72: Middle East and Africa Toxicology Drug Screening Market Volume (K Unit), by Testing Type 2024 & 2032
- Figure 73: Middle East and Africa Toxicology Drug Screening Market Revenue Share (%), by Testing Type 2024 & 2032
- Figure 74: Middle East and Africa Toxicology Drug Screening Market Volume Share (%), by Testing Type 2024 & 2032
- Figure 75: Middle East and Africa Toxicology Drug Screening Market Revenue (Million), by Product 2024 & 2032
- Figure 76: Middle East and Africa Toxicology Drug Screening Market Volume (K Unit), by Product 2024 & 2032
- Figure 77: Middle East and Africa Toxicology Drug Screening Market Revenue Share (%), by Product 2024 & 2032
- Figure 78: Middle East and Africa Toxicology Drug Screening Market Volume Share (%), by Product 2024 & 2032
- Figure 79: Middle East and Africa Toxicology Drug Screening Market Revenue (Million), by Application 2024 & 2032
- Figure 80: Middle East and Africa Toxicology Drug Screening Market Volume (K Unit), by Application 2024 & 2032
- Figure 81: Middle East and Africa Toxicology Drug Screening Market Revenue Share (%), by Application 2024 & 2032
- Figure 82: Middle East and Africa Toxicology Drug Screening Market Volume Share (%), by Application 2024 & 2032
- Figure 83: Middle East and Africa Toxicology Drug Screening Market Revenue (Million), by Country 2024 & 2032
- Figure 84: Middle East and Africa Toxicology Drug Screening Market Volume (K Unit), by Country 2024 & 2032
- Figure 85: Middle East and Africa Toxicology Drug Screening Market Revenue Share (%), by Country 2024 & 2032
- Figure 86: Middle East and Africa Toxicology Drug Screening Market Volume Share (%), by Country 2024 & 2032
- Figure 87: South America Toxicology Drug Screening Market Revenue (Million), by Testing Type 2024 & 2032
- Figure 88: South America Toxicology Drug Screening Market Volume (K Unit), by Testing Type 2024 & 2032
- Figure 89: South America Toxicology Drug Screening Market Revenue Share (%), by Testing Type 2024 & 2032
- Figure 90: South America Toxicology Drug Screening Market Volume Share (%), by Testing Type 2024 & 2032
- Figure 91: South America Toxicology Drug Screening Market Revenue (Million), by Product 2024 & 2032
- Figure 92: South America Toxicology Drug Screening Market Volume (K Unit), by Product 2024 & 2032
- Figure 93: South America Toxicology Drug Screening Market Revenue Share (%), by Product 2024 & 2032
- Figure 94: South America Toxicology Drug Screening Market Volume Share (%), by Product 2024 & 2032
- Figure 95: South America Toxicology Drug Screening Market Revenue (Million), by Application 2024 & 2032
- Figure 96: South America Toxicology Drug Screening Market Volume (K Unit), by Application 2024 & 2032
- Figure 97: South America Toxicology Drug Screening Market Revenue Share (%), by Application 2024 & 2032
- Figure 98: South America Toxicology Drug Screening Market Volume Share (%), by Application 2024 & 2032
- Figure 99: South America Toxicology Drug Screening Market Revenue (Million), by Country 2024 & 2032
- Figure 100: South America Toxicology Drug Screening Market Volume (K Unit), by Country 2024 & 2032
- Figure 101: South America Toxicology Drug Screening Market Revenue Share (%), by Country 2024 & 2032
- Figure 102: South America Toxicology Drug Screening Market Volume Share (%), by Country 2024 & 2032
List of Tables
- Table 1: Global Toxicology Drug Screening Market Revenue Million Forecast, by Region 2019 & 2032
- Table 2: Global Toxicology Drug Screening Market Volume K Unit Forecast, by Region 2019 & 2032
- Table 3: Global Toxicology Drug Screening Market Revenue Million Forecast, by Testing Type 2019 & 2032
- Table 4: Global Toxicology Drug Screening Market Volume K Unit Forecast, by Testing Type 2019 & 2032
- Table 5: Global Toxicology Drug Screening Market Revenue Million Forecast, by Product 2019 & 2032
- Table 6: Global Toxicology Drug Screening Market Volume K Unit Forecast, by Product 2019 & 2032
- Table 7: Global Toxicology Drug Screening Market Revenue Million Forecast, by Application 2019 & 2032
- Table 8: Global Toxicology Drug Screening Market Volume K Unit Forecast, by Application 2019 & 2032
- Table 9: Global Toxicology Drug Screening Market Revenue Million Forecast, by Region 2019 & 2032
- Table 10: Global Toxicology Drug Screening Market Volume K Unit Forecast, by Region 2019 & 2032
- Table 11: Global Toxicology Drug Screening Market Revenue Million Forecast, by Country 2019 & 2032
- Table 12: Global Toxicology Drug Screening Market Volume K Unit Forecast, by Country 2019 & 2032
- Table 13: United States Toxicology Drug Screening Market Revenue (Million) Forecast, by Application 2019 & 2032
- Table 14: United States Toxicology Drug Screening Market Volume (K Unit) Forecast, by Application 2019 & 2032
- Table 15: Canada Toxicology Drug Screening Market Revenue (Million) Forecast, by Application 2019 & 2032
- Table 16: Canada Toxicology Drug Screening Market Volume (K Unit) Forecast, by Application 2019 & 2032
- Table 17: Mexico Toxicology Drug Screening Market Revenue (Million) Forecast, by Application 2019 & 2032
- Table 18: Mexico Toxicology Drug Screening Market Volume (K Unit) Forecast, by Application 2019 & 2032
- Table 19: Global Toxicology Drug Screening Market Revenue Million Forecast, by Country 2019 & 2032
- Table 20: Global Toxicology Drug Screening Market Volume K Unit Forecast, by Country 2019 & 2032
- Table 21: Germany Toxicology Drug Screening Market Revenue (Million) Forecast, by Application 2019 & 2032
- Table 22: Germany Toxicology Drug Screening Market Volume (K Unit) Forecast, by Application 2019 & 2032
- Table 23: United Kingdom Toxicology Drug Screening Market Revenue (Million) Forecast, by Application 2019 & 2032
- Table 24: United Kingdom Toxicology Drug Screening Market Volume (K Unit) Forecast, by Application 2019 & 2032
- Table 25: France Toxicology Drug Screening Market Revenue (Million) Forecast, by Application 2019 & 2032
- Table 26: France Toxicology Drug Screening Market Volume (K Unit) Forecast, by Application 2019 & 2032
- Table 27: Italy Toxicology Drug Screening Market Revenue (Million) Forecast, by Application 2019 & 2032
- Table 28: Italy Toxicology Drug Screening Market Volume (K Unit) Forecast, by Application 2019 & 2032
- Table 29: Spain Toxicology Drug Screening Market Revenue (Million) Forecast, by Application 2019 & 2032
- Table 30: Spain Toxicology Drug Screening Market Volume (K Unit) Forecast, by Application 2019 & 2032
- Table 31: Rest of Europe Toxicology Drug Screening Market Revenue (Million) Forecast, by Application 2019 & 2032
- Table 32: Rest of Europe Toxicology Drug Screening Market Volume (K Unit) Forecast, by Application 2019 & 2032
- Table 33: Global Toxicology Drug Screening Market Revenue Million Forecast, by Country 2019 & 2032
- Table 34: Global Toxicology Drug Screening Market Volume K Unit Forecast, by Country 2019 & 2032
- Table 35: China Toxicology Drug Screening Market Revenue (Million) Forecast, by Application 2019 & 2032
- Table 36: China Toxicology Drug Screening Market Volume (K Unit) Forecast, by Application 2019 & 2032
- Table 37: Japan Toxicology Drug Screening Market Revenue (Million) Forecast, by Application 2019 & 2032
- Table 38: Japan Toxicology Drug Screening Market Volume (K Unit) Forecast, by Application 2019 & 2032
- Table 39: India Toxicology Drug Screening Market Revenue (Million) Forecast, by Application 2019 & 2032
- Table 40: India Toxicology Drug Screening Market Volume (K Unit) Forecast, by Application 2019 & 2032
- Table 41: Australia Toxicology Drug Screening Market Revenue (Million) Forecast, by Application 2019 & 2032
- Table 42: Australia Toxicology Drug Screening Market Volume (K Unit) Forecast, by Application 2019 & 2032
- Table 43: South Korea Toxicology Drug Screening Market Revenue (Million) Forecast, by Application 2019 & 2032
- Table 44: South Korea Toxicology Drug Screening Market Volume (K Unit) Forecast, by Application 2019 & 2032
- Table 45: Rest of Asia Pacific Toxicology Drug Screening Market Revenue (Million) Forecast, by Application 2019 & 2032
- Table 46: Rest of Asia Pacific Toxicology Drug Screening Market Volume (K Unit) Forecast, by Application 2019 & 2032
- Table 47: Global Toxicology Drug Screening Market Revenue Million Forecast, by Country 2019 & 2032
- Table 48: Global Toxicology Drug Screening Market Volume K Unit Forecast, by Country 2019 & 2032
- Table 49: GCC Toxicology Drug Screening Market Revenue (Million) Forecast, by Application 2019 & 2032
- Table 50: GCC Toxicology Drug Screening Market Volume (K Unit) Forecast, by Application 2019 & 2032
- Table 51: South Africa Toxicology Drug Screening Market Revenue (Million) Forecast, by Application 2019 & 2032
- Table 52: South Africa Toxicology Drug Screening Market Volume (K Unit) Forecast, by Application 2019 & 2032
- Table 53: Rest of Middle East and Africa Toxicology Drug Screening Market Revenue (Million) Forecast, by Application 2019 & 2032
- Table 54: Rest of Middle East and Africa Toxicology Drug Screening Market Volume (K Unit) Forecast, by Application 2019 & 2032
- Table 55: Global Toxicology Drug Screening Market Revenue Million Forecast, by Country 2019 & 2032
- Table 56: Global Toxicology Drug Screening Market Volume K Unit Forecast, by Country 2019 & 2032
- Table 57: Brazil Toxicology Drug Screening Market Revenue (Million) Forecast, by Application 2019 & 2032
- Table 58: Brazil Toxicology Drug Screening Market Volume (K Unit) Forecast, by Application 2019 & 2032
- Table 59: Argentina Toxicology Drug Screening Market Revenue (Million) Forecast, by Application 2019 & 2032
- Table 60: Argentina Toxicology Drug Screening Market Volume (K Unit) Forecast, by Application 2019 & 2032
- Table 61: Rest of South America Toxicology Drug Screening Market Revenue (Million) Forecast, by Application 2019 & 2032
- Table 62: Rest of South America Toxicology Drug Screening Market Volume (K Unit) Forecast, by Application 2019 & 2032
- Table 63: Global Toxicology Drug Screening Market Revenue Million Forecast, by Testing Type 2019 & 2032
- Table 64: Global Toxicology Drug Screening Market Volume K Unit Forecast, by Testing Type 2019 & 2032
- Table 65: Global Toxicology Drug Screening Market Revenue Million Forecast, by Product 2019 & 2032
- Table 66: Global Toxicology Drug Screening Market Volume K Unit Forecast, by Product 2019 & 2032
- Table 67: Global Toxicology Drug Screening Market Revenue Million Forecast, by Application 2019 & 2032
- Table 68: Global Toxicology Drug Screening Market Volume K Unit Forecast, by Application 2019 & 2032
- Table 69: Global Toxicology Drug Screening Market Revenue Million Forecast, by Country 2019 & 2032
- Table 70: Global Toxicology Drug Screening Market Volume K Unit Forecast, by Country 2019 & 2032
- Table 71: United States Toxicology Drug Screening Market Revenue (Million) Forecast, by Application 2019 & 2032
- Table 72: United States Toxicology Drug Screening Market Volume (K Unit) Forecast, by Application 2019 & 2032
- Table 73: Canada Toxicology Drug Screening Market Revenue (Million) Forecast, by Application 2019 & 2032
- Table 74: Canada Toxicology Drug Screening Market Volume (K Unit) Forecast, by Application 2019 & 2032
- Table 75: Mexico Toxicology Drug Screening Market Revenue (Million) Forecast, by Application 2019 & 2032
- Table 76: Mexico Toxicology Drug Screening Market Volume (K Unit) Forecast, by Application 2019 & 2032
- Table 77: Global Toxicology Drug Screening Market Revenue Million Forecast, by Testing Type 2019 & 2032
- Table 78: Global Toxicology Drug Screening Market Volume K Unit Forecast, by Testing Type 2019 & 2032
- Table 79: Global Toxicology Drug Screening Market Revenue Million Forecast, by Product 2019 & 2032
- Table 80: Global Toxicology Drug Screening Market Volume K Unit Forecast, by Product 2019 & 2032
- Table 81: Global Toxicology Drug Screening Market Revenue Million Forecast, by Application 2019 & 2032
- Table 82: Global Toxicology Drug Screening Market Volume K Unit Forecast, by Application 2019 & 2032
- Table 83: Global Toxicology Drug Screening Market Revenue Million Forecast, by Country 2019 & 2032
- Table 84: Global Toxicology Drug Screening Market Volume K Unit Forecast, by Country 2019 & 2032
- Table 85: Germany Toxicology Drug Screening Market Revenue (Million) Forecast, by Application 2019 & 2032
- Table 86: Germany Toxicology Drug Screening Market Volume (K Unit) Forecast, by Application 2019 & 2032
- Table 87: United Kingdom Toxicology Drug Screening Market Revenue (Million) Forecast, by Application 2019 & 2032
- Table 88: United Kingdom Toxicology Drug Screening Market Volume (K Unit) Forecast, by Application 2019 & 2032
- Table 89: France Toxicology Drug Screening Market Revenue (Million) Forecast, by Application 2019 & 2032
- Table 90: France Toxicology Drug Screening Market Volume (K Unit) Forecast, by Application 2019 & 2032
- Table 91: Italy Toxicology Drug Screening Market Revenue (Million) Forecast, by Application 2019 & 2032
- Table 92: Italy Toxicology Drug Screening Market Volume (K Unit) Forecast, by Application 2019 & 2032
- Table 93: Spain Toxicology Drug Screening Market Revenue (Million) Forecast, by Application 2019 & 2032
- Table 94: Spain Toxicology Drug Screening Market Volume (K Unit) Forecast, by Application 2019 & 2032
- Table 95: Rest of Europe Toxicology Drug Screening Market Revenue (Million) Forecast, by Application 2019 & 2032
- Table 96: Rest of Europe Toxicology Drug Screening Market Volume (K Unit) Forecast, by Application 2019 & 2032
- Table 97: Global Toxicology Drug Screening Market Revenue Million Forecast, by Testing Type 2019 & 2032
- Table 98: Global Toxicology Drug Screening Market Volume K Unit Forecast, by Testing Type 2019 & 2032
- Table 99: Global Toxicology Drug Screening Market Revenue Million Forecast, by Product 2019 & 2032
- Table 100: Global Toxicology Drug Screening Market Volume K Unit Forecast, by Product 2019 & 2032
- Table 101: Global Toxicology Drug Screening Market Revenue Million Forecast, by Application 2019 & 2032
- Table 102: Global Toxicology Drug Screening Market Volume K Unit Forecast, by Application 2019 & 2032
- Table 103: Global Toxicology Drug Screening Market Revenue Million Forecast, by Country 2019 & 2032
- Table 104: Global Toxicology Drug Screening Market Volume K Unit Forecast, by Country 2019 & 2032
- Table 105: China Toxicology Drug Screening Market Revenue (Million) Forecast, by Application 2019 & 2032
- Table 106: China Toxicology Drug Screening Market Volume (K Unit) Forecast, by Application 2019 & 2032
- Table 107: Japan Toxicology Drug Screening Market Revenue (Million) Forecast, by Application 2019 & 2032
- Table 108: Japan Toxicology Drug Screening Market Volume (K Unit) Forecast, by Application 2019 & 2032
- Table 109: India Toxicology Drug Screening Market Revenue (Million) Forecast, by Application 2019 & 2032
- Table 110: India Toxicology Drug Screening Market Volume (K Unit) Forecast, by Application 2019 & 2032
- Table 111: Australia Toxicology Drug Screening Market Revenue (Million) Forecast, by Application 2019 & 2032
- Table 112: Australia Toxicology Drug Screening Market Volume (K Unit) Forecast, by Application 2019 & 2032
- Table 113: South Korea Toxicology Drug Screening Market Revenue (Million) Forecast, by Application 2019 & 2032
- Table 114: South Korea Toxicology Drug Screening Market Volume (K Unit) Forecast, by Application 2019 & 2032
- Table 115: Rest of Asia Pacific Toxicology Drug Screening Market Revenue (Million) Forecast, by Application 2019 & 2032
- Table 116: Rest of Asia Pacific Toxicology Drug Screening Market Volume (K Unit) Forecast, by Application 2019 & 2032
- Table 117: Global Toxicology Drug Screening Market Revenue Million Forecast, by Testing Type 2019 & 2032
- Table 118: Global Toxicology Drug Screening Market Volume K Unit Forecast, by Testing Type 2019 & 2032
- Table 119: Global Toxicology Drug Screening Market Revenue Million Forecast, by Product 2019 & 2032
- Table 120: Global Toxicology Drug Screening Market Volume K Unit Forecast, by Product 2019 & 2032
- Table 121: Global Toxicology Drug Screening Market Revenue Million Forecast, by Application 2019 & 2032
- Table 122: Global Toxicology Drug Screening Market Volume K Unit Forecast, by Application 2019 & 2032
- Table 123: Global Toxicology Drug Screening Market Revenue Million Forecast, by Country 2019 & 2032
- Table 124: Global Toxicology Drug Screening Market Volume K Unit Forecast, by Country 2019 & 2032
- Table 125: GCC Toxicology Drug Screening Market Revenue (Million) Forecast, by Application 2019 & 2032
- Table 126: GCC Toxicology Drug Screening Market Volume (K Unit) Forecast, by Application 2019 & 2032
- Table 127: South Africa Toxicology Drug Screening Market Revenue (Million) Forecast, by Application 2019 & 2032
- Table 128: South Africa Toxicology Drug Screening Market Volume (K Unit) Forecast, by Application 2019 & 2032
- Table 129: Rest of Middle East and Africa Toxicology Drug Screening Market Revenue (Million) Forecast, by Application 2019 & 2032
- Table 130: Rest of Middle East and Africa Toxicology Drug Screening Market Volume (K Unit) Forecast, by Application 2019 & 2032
- Table 131: Global Toxicology Drug Screening Market Revenue Million Forecast, by Testing Type 2019 & 2032
- Table 132: Global Toxicology Drug Screening Market Volume K Unit Forecast, by Testing Type 2019 & 2032
- Table 133: Global Toxicology Drug Screening Market Revenue Million Forecast, by Product 2019 & 2032
- Table 134: Global Toxicology Drug Screening Market Volume K Unit Forecast, by Product 2019 & 2032
- Table 135: Global Toxicology Drug Screening Market Revenue Million Forecast, by Application 2019 & 2032
- Table 136: Global Toxicology Drug Screening Market Volume K Unit Forecast, by Application 2019 & 2032
- Table 137: Global Toxicology Drug Screening Market Revenue Million Forecast, by Country 2019 & 2032
- Table 138: Global Toxicology Drug Screening Market Volume K Unit Forecast, by Country 2019 & 2032
- Table 139: Brazil Toxicology Drug Screening Market Revenue (Million) Forecast, by Application 2019 & 2032
- Table 140: Brazil Toxicology Drug Screening Market Volume (K Unit) Forecast, by Application 2019 & 2032
- Table 141: Argentina Toxicology Drug Screening Market Revenue (Million) Forecast, by Application 2019 & 2032
- Table 142: Argentina Toxicology Drug Screening Market Volume (K Unit) Forecast, by Application 2019 & 2032
- Table 143: Rest of South America Toxicology Drug Screening Market Revenue (Million) Forecast, by Application 2019 & 2032
- Table 144: Rest of South America Toxicology Drug Screening Market Volume (K Unit) Forecast, by Application 2019 & 2032
Frequently Asked Questions
1. What is the projected Compound Annual Growth Rate (CAGR) of the Toxicology Drug Screening Market?
The projected CAGR is approximately 8.77%.
2. Which companies are prominent players in the Toxicology Drug Screening Market?
Key companies in the market include Laboratory Corporation of America Holdings, The Jackson Laboratory, Promega Corporation, Bio-Rad Laboratories Inc, Eurofins Scientific, Charles River Laboratories International Inc, Thermo Fisher Scientific Inc, Agilent Technologies Inc, Enzo Life Sciences Inc, BioReliance Inc (Merck), Danaher, Wuxi AppTec.
3. What are the main segments of the Toxicology Drug Screening Market?
The market segments include Testing Type, Product, Application.
4. Can you provide details about the market size?
The market size is estimated to be USD 14.51 Million as of 2022.
5. What are some drivers contributing to market growth?
Increasing R&D Activities; Technological Advancements in Toxicology Drug Screening; Rise in Demand for Toxicology Drug Screening in Pharmaceuticals and Biotechnology.
6. What are the notable trends driving market growth?
In Silico Segment is Expected to Witness Significant Growth Over the Forecast Period.
7. Are there any restraints impacting market growth?
Longer Time for Sample Testing; Regulatory Issues Regarding Approval of Healthcare Molecule.
8. Can you provide examples of recent developments in the market?
November 2022: Instem, a provider of information and technology (IT) solutions and services to the global life sciences market, updated its Computational Toxicology Software Suite solution. The 2022 software update allows its clients to access more than 600,000 toxicology studies for more than 200,000 chemicals, enabling fast, accurate, defendable, and regulatory-accepted predictions.
9. What pricing options are available for accessing the report?
Pricing options include single-user, multi-user, and enterprise licenses priced at USD 4750, USD 5250, and USD 8750 respectively.
10. Is the market size provided in terms of value or volume?
The market size is provided in terms of value, measured in Million and volume, measured in K Unit.
11. Are there any specific market keywords associated with the report?
Yes, the market keyword associated with the report is "Toxicology Drug Screening Market," which aids in identifying and referencing the specific market segment covered.
12. How do I determine which pricing option suits my needs best?
The pricing options vary based on user requirements and access needs. Individual users may opt for single-user licenses, while businesses requiring broader access may choose multi-user or enterprise licenses for cost-effective access to the report.
13. Are there any additional resources or data provided in the Toxicology Drug Screening Market report?
While the report offers comprehensive insights, it's advisable to review the specific contents or supplementary materials provided to ascertain if additional resources or data are available.
14. How can I stay updated on further developments or reports in the Toxicology Drug Screening Market?
To stay informed about further developments, trends, and reports in the Toxicology Drug Screening Market, consider subscribing to industry newsletters, following relevant companies and organizations, or regularly checking reputable industry news sources and publications.
Methodology
Step 1 - Identification of Relevant Samples Size from Population Database


Step 2 - Approaches for Defining Global Market Size (Value, Volume* & Price*)

Note*: In applicable scenarios
Step 3 - Data Sources
Primary Research
- Web Analytics
- Survey Reports
- Research Institute
- Latest Research Reports
- Opinion Leaders
Secondary Research
- Annual Reports
- White Paper
- Latest Press Release
- Industry Association
- Paid Database
- Investor Presentations

Step 4 - Data Triangulation
Involves using different sources of information in order to increase the validity of a study
These sources are likely to be stakeholders in a program - participants, other researchers, program staff, other community members, and so on.
Then we put all data in single framework & apply various statistical tools to find out the dynamic on the market.
During the analysis stage, feedback from the stakeholder groups would be compared to determine areas of agreement as well as areas of divergence


