
Key Insights
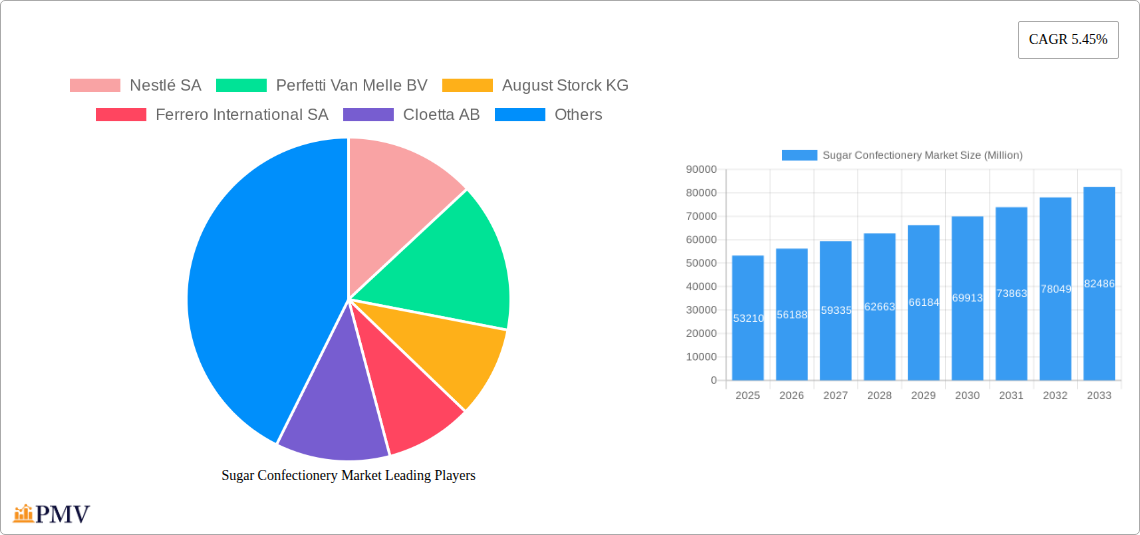
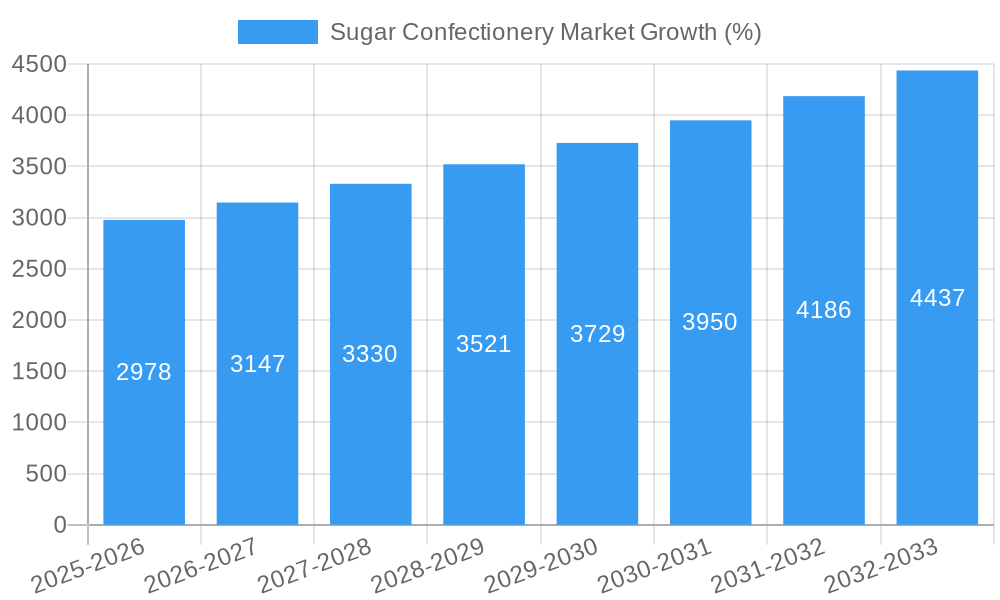
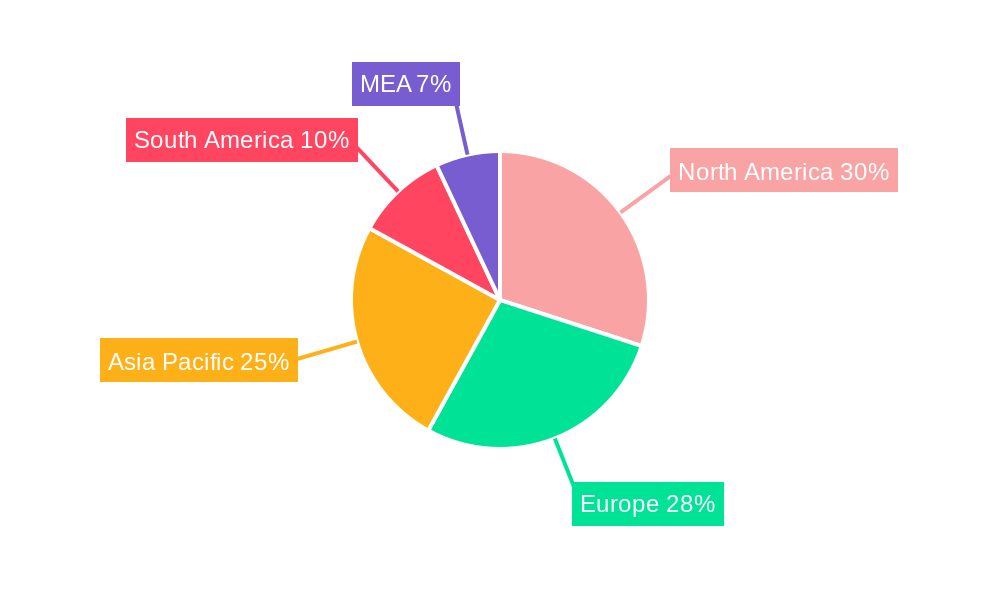
The global sugar confectionery market, valued at $53.21 billion in 2025, is projected to experience robust growth, driven by increasing consumer demand for convenient and indulgent treats. A compound annual growth rate (CAGR) of 5.45% from 2025 to 2033 indicates a significant market expansion, reaching an estimated value exceeding $85 billion by 2033. This growth is fueled by several key factors. The rising disposable incomes in developing economies are leading to increased spending on discretionary items like confectionery. Furthermore, innovative product launches, such as healthier sugar alternatives and unique flavor profiles, are attracting a broader consumer base. The convenience store distribution channel continues to dominate, offering immediate gratification to consumers. However, the online retail segment is experiencing rapid growth, leveraging e-commerce platforms for broader reach and targeted marketing. Regional variations exist, with North America and Europe currently holding significant market shares, but Asia-Pacific is anticipated to show substantial growth potential in the coming years due to its burgeoning population and rising middle class. Challenges include fluctuating sugar prices, increasing health consciousness leading to demand for sugar-reduced options, and stringent regulations on sugar content in various regions. Nevertheless, the sugar confectionery market is poised for continued expansion, driven by product innovation and evolving consumer preferences.
The market segmentation highlights the dominance of specific confectionery variants. Hard candies and lollipops continue to be popular choices, but gummies and jellies are experiencing significant growth, particularly among younger consumers. Key players like Nestlé, Perfetti Van Melle, and Mars Incorporated are employing strategies focused on brand building, product diversification, and strategic acquisitions to maintain their market leadership. Understanding regional nuances is crucial for successful market penetration. While North America and Europe remain significant markets, the Asia-Pacific region presents a lucrative opportunity for future growth given its vast population and increasing consumer spending power. Therefore, companies are adapting their strategies to cater to specific regional tastes and preferences, leading to localized product development and marketing campaigns. The competitive landscape is characterized by both established global players and regional brands, resulting in intense competition and a constant drive for innovation.
Sugar Confectionery Market: A Comprehensive Market Analysis (2019-2033)
This in-depth report provides a comprehensive analysis of the global Sugar Confectionery Market, offering invaluable insights for industry stakeholders, investors, and strategic decision-makers. Covering the period 2019-2033, with a focus on 2025, this report meticulously examines market dynamics, competitive landscapes, and future growth trajectories. The study encompasses detailed segmentation by distribution channel (Convenience Store, Online Retail Store, Supermarket/Hypermarket, Others) and confectionery variant (Hard Candy, Lollipops, Mints, Pastilles, Gummies and Jellies, Toffees and Nougats, Others), providing a granular understanding of market performance across diverse segments. Key players like Nestlé SA, Perfetti Van Melle BV, August Storck KG, Ferrero International SA, and Mondelēz International Inc. are analyzed for their market share, strategies, and recent innovations.
Sugar Confectionery Market Market Structure & Competitive Dynamics
The global sugar confectionery market exhibits a moderately concentrated structure, dominated by a few multinational giants alongside a multitude of regional and niche players. Market share is heavily influenced by brand recognition, distribution network strength, and product innovation. Nestlé SA, Mars Incorporated, and Mondelēz International Inc. hold significant market shares, employing robust marketing strategies and extensive distribution networks. The innovation ecosystem is dynamic, with continuous development in flavors, textures, and healthier alternatives. Regulatory frameworks, particularly concerning sugar content and labeling, significantly impact market dynamics, driving innovation in low-sugar and healthier confectionery options. Product substitutes, including fruit snacks and other less-processed sweets, exert competitive pressure. End-user trends, such as growing health consciousness and demand for premium products, influence market segmentation and product development. M&A activity in the sector remains significant, with larger companies acquiring smaller players to expand their product portfolios and market reach. For example, xx Million in M&A deals were recorded in 2024, representing a xx% increase compared to 2023.
- Market Concentration: High, with top 5 players holding xx% market share (Estimated 2025).
- Innovation Ecosystems: Highly active, focused on healthier options and novel flavors.
- Regulatory Frameworks: Increasingly stringent regarding sugar content and labeling.
- M&A Activity: Significant, driven by expansion and diversification strategies. Deal values in 2024: xx Million.
Sugar Confectionery Market Industry Trends & Insights
The sugar confectionery market is projected to experience a CAGR of xx% during the forecast period (2025-2033), driven by factors such as rising disposable incomes in emerging economies, evolving consumer preferences toward premium and specialized confectionery products, and strategic marketing initiatives by major players. Technological advancements, such as improved manufacturing processes and packaging solutions, are enhancing production efficiency and product shelf life. However, growing health consciousness and concerns about sugar consumption are creating significant challenges, leading to increased demand for healthier alternatives, including sugar-free and low-sugar options. Competitive dynamics are shaped by intense branding efforts, new product launches, and strategic partnerships aimed at securing shelf space and gaining market share. Market penetration of premium confectionery products is growing at a rate of xx% annually, further driving market expansion.
Dominant Markets & Segments in Sugar Confectionery Market
The North American market currently dominates the global sugar confectionery market, driven by high per capita consumption and strong consumer demand for diverse confectionery products. Within the segments:
Distribution Channel: Supermarket/hypermarkets maintain the largest market share, benefiting from wide product visibility and established distribution networks. However, the online retail segment is experiencing the fastest growth, fueled by e-commerce expansion and convenience.
Confectionery Variant: Gummies and jellies represent a significant and rapidly growing segment, owing to their versatility, appealing textures, and suitability for various age groups. The Hard Candy segment maintains a steady market share, benefiting from its long-standing appeal and relatively lower price point.
Key Drivers for North America:
- Strong consumer spending power and disposable income.
- Established retail infrastructure and widespread distribution networks.
- High preference for diverse flavors and innovative product offerings.
The dominance of North America reflects high per capita consumption, robust retail infrastructure, and strong marketing efforts by key players.
Sugar Confectionery Market Product Innovations
Recent innovations in the sugar confectionery market emphasize healthier alternatives, functional ingredients, and unique flavor combinations. Companies are actively developing low-sugar, sugar-free, and organic options to cater to growing health consciousness. The use of natural ingredients and sustainable packaging is also gaining traction. These innovations aim to capture a broader customer base and to address concerns over sugar intake and environmental impact. Technological advancements in manufacturing processes allow for increased efficiency and customization of product offerings, enhancing competitiveness and market appeal.
Report Segmentation & Scope
This report segments the sugar confectionery market by distribution channel (Convenience Stores, Online Retail Stores, Supermarket/Hypermarkets, Others) and confectionery variant (Hard Candy, Lollipops, Mints, Pastilles, Gummies and Jellies, Toffees and Nougats, Others). Each segment is analyzed in terms of market size, growth projections, and competitive dynamics, providing a granular understanding of market performance across different channels and product categories. The growth of online retail channels is projected to outpace traditional channels in the coming years. The Gummies and Jellies segment is expected to demonstrate the highest growth rate driven by demand for innovative flavors and textures.
Key Drivers of Sugar Confectionery Market Growth
Several factors contribute to the sugar confectionery market's growth. Rising disposable incomes, particularly in developing countries, are increasing consumer spending on discretionary items like confectionery. The introduction of innovative flavors, healthier alternatives, and unique product formats caters to evolving consumer preferences and expands market appeal. Furthermore, effective marketing and branding strategies employed by leading players enhance product visibility and drive consumer demand.
Challenges in the Sugar Confectionery Market Sector
The sugar confectionery market faces significant challenges, including increasing health concerns related to high sugar consumption. Government regulations restricting sugar content and imposing stricter labeling requirements impact production costs and product formulations. Fluctuations in raw material prices, particularly sugar and dairy products, can disrupt production and profitability. Intense competition among established players and the emergence of new entrants pose significant pressure on profit margins and market share.
Leading Players in the Sugar Confectionery Market Market
- Nestlé SA (Nestlé SA)
- Perfetti Van Melle BV
- August Storck KG
- Ferrero International SA (Ferrero International SA)
- Cloetta AB
- Oy Karl Fazer Ab
- Mars Incorporated (Mars Incorporated)
- Arcor S A I C
- Mount Franklin Foods LLC
- HARIBO Holding GmbH & Co KG (HARIBO Holding GmbH & Co KG)
- The Hershey Company (The Hershey Company)
- Mondelēz International Inc. (Mondelēz International Inc.)
- Meiji Holdings Company Ltd
Key Developments in Sugar Confectionery Market Sector
- July 2023: HARIBO® opened its first North American manufacturing facility, boosting US gummi production.
- June 2023: Tic Tac launched a new spearmint flavor variant in India, targeting diverse consumption occasions.
- May 2023: Mondelēz International Inc. invested nearly USD 50 Million in a new Global R&D Innovation Center, signifying a focus on confectionery innovation.
Strategic Sugar Confectionery Market Market Outlook
The future of the sugar confectionery market hinges on adapting to evolving consumer preferences and addressing health concerns. Continued innovation in healthier options, such as low-sugar and organic products, will be crucial. Strategic partnerships and acquisitions will play a key role in expanding market reach and consolidating market share. Companies that successfully integrate sustainable practices into their operations and adopt agile strategies to respond to changing market demands will be best positioned for long-term growth.
Sugar Confectionery Market Segmentation
-
1. Confectionery Variant
- 1.1. Hard Candy
- 1.2. Lollipops
- 1.3. Mints
- 1.4. Pastilles, Gummies, and Jellies
- 1.5. Toffees and Nougats
- 1.6. Others
-
2. Distribution Channel
- 2.1. Convenience Store
- 2.2. Online Retail Store
- 2.3. Supermarket/Hypermarket
- 2.4. Others
Sugar Confectionery Market Segmentation By Geography
-
1. North America
- 1.1. United States
- 1.2. Canada
- 1.3. Mexico
-
2. South America
- 2.1. Brazil
- 2.2. Argentina
- 2.3. Rest of South America
-
3. Europe
- 3.1. United Kingdom
- 3.2. Germany
- 3.3. France
- 3.4. Italy
- 3.5. Spain
- 3.6. Russia
- 3.7. Benelux
- 3.8. Nordics
- 3.9. Rest of Europe
-
4. Middle East & Africa
- 4.1. Turkey
- 4.2. Israel
- 4.3. GCC
- 4.4. North Africa
- 4.5. South Africa
- 4.6. Rest of Middle East & Africa
-
5. Asia Pacific
- 5.1. China
- 5.2. India
- 5.3. Japan
- 5.4. South Korea
- 5.5. ASEAN
- 5.6. Oceania
- 5.7. Rest of Asia Pacific
Sugar Confectionery Market REPORT HIGHLIGHTS
| Aspects | Details |
|---|---|
| Study Period | 2019-2033 |
| Base Year | 2024 |
| Estimated Year | 2025 |
| Forecast Period | 2025-2033 |
| Historical Period | 2019-2024 |
| Growth Rate | CAGR of 5.45% from 2019-2033 |
| Segmentation |
|
Table of Contents
- 1. Introduction
- 1.1. Research Scope
- 1.2. Market Segmentation
- 1.3. Research Methodology
- 1.4. Definitions and Assumptions
- 2. Executive Summary
- 2.1. Introduction
- 3. Market Dynamics
- 3.1. Introduction
- 3.2. Market Drivers
- 3.2.1. Increasing demand for meat alternatives
- 3.3. Market Restrains
- 3.3.1. Presence of numerous alternatives in the plant proteins
- 3.4. Market Trends
- 3.4.1. OTHER KEY INDUSTRY TRENDS COVERED IN THE REPORT
- 4. Market Factor Analysis
- 4.1. Porters Five Forces
- 4.2. Supply/Value Chain
- 4.3. PESTEL analysis
- 4.4. Market Entropy
- 4.5. Patent/Trademark Analysis
- 5. Global Sugar Confectionery Market Analysis, Insights and Forecast, 2019-2031
- 5.1. Market Analysis, Insights and Forecast - by Confectionery Variant
- 5.1.1. Hard Candy
- 5.1.2. Lollipops
- 5.1.3. Mints
- 5.1.4. Pastilles, Gummies, and Jellies
- 5.1.5. Toffees and Nougats
- 5.1.6. Others
- 5.2. Market Analysis, Insights and Forecast - by Distribution Channel
- 5.2.1. Convenience Store
- 5.2.2. Online Retail Store
- 5.2.3. Supermarket/Hypermarket
- 5.2.4. Others
- 5.3. Market Analysis, Insights and Forecast - by Region
- 5.3.1. North America
- 5.3.2. South America
- 5.3.3. Europe
- 5.3.4. Middle East & Africa
- 5.3.5. Asia Pacific
- 5.1. Market Analysis, Insights and Forecast - by Confectionery Variant
- 6. North America Sugar Confectionery Market Analysis, Insights and Forecast, 2019-2031
- 6.1. Market Analysis, Insights and Forecast - by Confectionery Variant
- 6.1.1. Hard Candy
- 6.1.2. Lollipops
- 6.1.3. Mints
- 6.1.4. Pastilles, Gummies, and Jellies
- 6.1.5. Toffees and Nougats
- 6.1.6. Others
- 6.2. Market Analysis, Insights and Forecast - by Distribution Channel
- 6.2.1. Convenience Store
- 6.2.2. Online Retail Store
- 6.2.3. Supermarket/Hypermarket
- 6.2.4. Others
- 6.1. Market Analysis, Insights and Forecast - by Confectionery Variant
- 7. South America Sugar Confectionery Market Analysis, Insights and Forecast, 2019-2031
- 7.1. Market Analysis, Insights and Forecast - by Confectionery Variant
- 7.1.1. Hard Candy
- 7.1.2. Lollipops
- 7.1.3. Mints
- 7.1.4. Pastilles, Gummies, and Jellies
- 7.1.5. Toffees and Nougats
- 7.1.6. Others
- 7.2. Market Analysis, Insights and Forecast - by Distribution Channel
- 7.2.1. Convenience Store
- 7.2.2. Online Retail Store
- 7.2.3. Supermarket/Hypermarket
- 7.2.4. Others
- 7.1. Market Analysis, Insights and Forecast - by Confectionery Variant
- 8. Europe Sugar Confectionery Market Analysis, Insights and Forecast, 2019-2031
- 8.1. Market Analysis, Insights and Forecast - by Confectionery Variant
- 8.1.1. Hard Candy
- 8.1.2. Lollipops
- 8.1.3. Mints
- 8.1.4. Pastilles, Gummies, and Jellies
- 8.1.5. Toffees and Nougats
- 8.1.6. Others
- 8.2. Market Analysis, Insights and Forecast - by Distribution Channel
- 8.2.1. Convenience Store
- 8.2.2. Online Retail Store
- 8.2.3. Supermarket/Hypermarket
- 8.2.4. Others
- 8.1. Market Analysis, Insights and Forecast - by Confectionery Variant
- 9. Middle East & Africa Sugar Confectionery Market Analysis, Insights and Forecast, 2019-2031
- 9.1. Market Analysis, Insights and Forecast - by Confectionery Variant
- 9.1.1. Hard Candy
- 9.1.2. Lollipops
- 9.1.3. Mints
- 9.1.4. Pastilles, Gummies, and Jellies
- 9.1.5. Toffees and Nougats
- 9.1.6. Others
- 9.2. Market Analysis, Insights and Forecast - by Distribution Channel
- 9.2.1. Convenience Store
- 9.2.2. Online Retail Store
- 9.2.3. Supermarket/Hypermarket
- 9.2.4. Others
- 9.1. Market Analysis, Insights and Forecast - by Confectionery Variant
- 10. Asia Pacific Sugar Confectionery Market Analysis, Insights and Forecast, 2019-2031
- 10.1. Market Analysis, Insights and Forecast - by Confectionery Variant
- 10.1.1. Hard Candy
- 10.1.2. Lollipops
- 10.1.3. Mints
- 10.1.4. Pastilles, Gummies, and Jellies
- 10.1.5. Toffees and Nougats
- 10.1.6. Others
- 10.2. Market Analysis, Insights and Forecast - by Distribution Channel
- 10.2.1. Convenience Store
- 10.2.2. Online Retail Store
- 10.2.3. Supermarket/Hypermarket
- 10.2.4. Others
- 10.1. Market Analysis, Insights and Forecast - by Confectionery Variant
- 11. MEA Sugar Confectionery Market Analysis, Insights and Forecast, 2019-2031
- 11.1. Market Analysis, Insights and Forecast - By Country/Sub-region
- 11.1.1 Middle East
- 11.1.2 Africa
- 12. South America Sugar Confectionery Market Analysis, Insights and Forecast, 2019-2031
- 12.1. Market Analysis, Insights and Forecast - By Country/Sub-region
- 12.1.1 Brazil
- 12.1.2 Argentina
- 12.1.3 Rest of South America
- 13. Europe Sugar Confectionery Market Analysis, Insights and Forecast, 2019-2031
- 13.1. Market Analysis, Insights and Forecast - By Country/Sub-region
- 13.1.1. Germany
- 14. Asia Pacific Sugar Confectionery Market Analysis, Insights and Forecast, 2019-2031
- 14.1. Market Analysis, Insights and Forecast - By Country/Sub-region
- 14.1.1 China
- 14.1.2 Japan
- 14.1.3 India
- 14.1.4 South Korea
- 14.1.5 Taiwan
- 14.1.6 Australia
- 14.1.7 Rest of Asia-Pacific
- 15. North America Sugar Confectionery Market Analysis, Insights and Forecast, 2019-2031
- 15.1. Market Analysis, Insights and Forecast - By Country/Sub-region
- 15.1.1. United States Canada Mexico
- 16. Competitive Analysis
- 16.1. Global Market Share Analysis 2024
- 16.2. Company Profiles
- 16.2.1 Nestlé SA
- 16.2.1.1. Overview
- 16.2.1.2. Products
- 16.2.1.3. SWOT Analysis
- 16.2.1.4. Recent Developments
- 16.2.1.5. Financials (Based on Availability)
- 16.2.2 Perfetti Van Melle BV
- 16.2.2.1. Overview
- 16.2.2.2. Products
- 16.2.2.3. SWOT Analysis
- 16.2.2.4. Recent Developments
- 16.2.2.5. Financials (Based on Availability)
- 16.2.3 August Storck KG
- 16.2.3.1. Overview
- 16.2.3.2. Products
- 16.2.3.3. SWOT Analysis
- 16.2.3.4. Recent Developments
- 16.2.3.5. Financials (Based on Availability)
- 16.2.4 Ferrero International SA
- 16.2.4.1. Overview
- 16.2.4.2. Products
- 16.2.4.3. SWOT Analysis
- 16.2.4.4. Recent Developments
- 16.2.4.5. Financials (Based on Availability)
- 16.2.5 Cloetta AB
- 16.2.5.1. Overview
- 16.2.5.2. Products
- 16.2.5.3. SWOT Analysis
- 16.2.5.4. Recent Developments
- 16.2.5.5. Financials (Based on Availability)
- 16.2.6 Oy Karl Fazer Ab
- 16.2.6.1. Overview
- 16.2.6.2. Products
- 16.2.6.3. SWOT Analysis
- 16.2.6.4. Recent Developments
- 16.2.6.5. Financials (Based on Availability)
- 16.2.7 Mars Incorporated
- 16.2.7.1. Overview
- 16.2.7.2. Products
- 16.2.7.3. SWOT Analysis
- 16.2.7.4. Recent Developments
- 16.2.7.5. Financials (Based on Availability)
- 16.2.8 Arcor S A I C
- 16.2.8.1. Overview
- 16.2.8.2. Products
- 16.2.8.3. SWOT Analysis
- 16.2.8.4. Recent Developments
- 16.2.8.5. Financials (Based on Availability)
- 16.2.9 Mount Franklin Foods LLC
- 16.2.9.1. Overview
- 16.2.9.2. Products
- 16.2.9.3. SWOT Analysis
- 16.2.9.4. Recent Developments
- 16.2.9.5. Financials (Based on Availability)
- 16.2.10 HARIBO Holding GmbH & Co KG
- 16.2.10.1. Overview
- 16.2.10.2. Products
- 16.2.10.3. SWOT Analysis
- 16.2.10.4. Recent Developments
- 16.2.10.5. Financials (Based on Availability)
- 16.2.11 The Hershey Compan
- 16.2.11.1. Overview
- 16.2.11.2. Products
- 16.2.11.3. SWOT Analysis
- 16.2.11.4. Recent Developments
- 16.2.11.5. Financials (Based on Availability)
- 16.2.12 Mondelēz International Inc
- 16.2.12.1. Overview
- 16.2.12.2. Products
- 16.2.12.3. SWOT Analysis
- 16.2.12.4. Recent Developments
- 16.2.12.5. Financials (Based on Availability)
- 16.2.13 Meiji Holdings Company Ltd
- 16.2.13.1. Overview
- 16.2.13.2. Products
- 16.2.13.3. SWOT Analysis
- 16.2.13.4. Recent Developments
- 16.2.13.5. Financials (Based on Availability)
- 16.2.1 Nestlé SA
List of Figures
- Figure 1: Global Sugar Confectionery Market Revenue Breakdown (Million, %) by Region 2024 & 2032
- Figure 2: Global Sugar Confectionery Market Volume Breakdown (K Tons, %) by Region 2024 & 2032
- Figure 3: MEA Sugar Confectionery Market Revenue (Million), by Country 2024 & 2032
- Figure 4: MEA Sugar Confectionery Market Volume (K Tons), by Country 2024 & 2032
- Figure 5: MEA Sugar Confectionery Market Revenue Share (%), by Country 2024 & 2032
- Figure 6: MEA Sugar Confectionery Market Volume Share (%), by Country 2024 & 2032
- Figure 7: South America Sugar Confectionery Market Revenue (Million), by Country 2024 & 2032
- Figure 8: South America Sugar Confectionery Market Volume (K Tons), by Country 2024 & 2032
- Figure 9: South America Sugar Confectionery Market Revenue Share (%), by Country 2024 & 2032
- Figure 10: South America Sugar Confectionery Market Volume Share (%), by Country 2024 & 2032
- Figure 11: Europe Sugar Confectionery Market Revenue (Million), by Country 2024 & 2032
- Figure 12: Europe Sugar Confectionery Market Volume (K Tons), by Country 2024 & 2032
- Figure 13: Europe Sugar Confectionery Market Revenue Share (%), by Country 2024 & 2032
- Figure 14: Europe Sugar Confectionery Market Volume Share (%), by Country 2024 & 2032
- Figure 15: Asia Pacific Sugar Confectionery Market Revenue (Million), by Country 2024 & 2032
- Figure 16: Asia Pacific Sugar Confectionery Market Volume (K Tons), by Country 2024 & 2032
- Figure 17: Asia Pacific Sugar Confectionery Market Revenue Share (%), by Country 2024 & 2032
- Figure 18: Asia Pacific Sugar Confectionery Market Volume Share (%), by Country 2024 & 2032
- Figure 19: North America Sugar Confectionery Market Revenue (Million), by Country 2024 & 2032
- Figure 20: North America Sugar Confectionery Market Volume (K Tons), by Country 2024 & 2032
- Figure 21: North America Sugar Confectionery Market Revenue Share (%), by Country 2024 & 2032
- Figure 22: North America Sugar Confectionery Market Volume Share (%), by Country 2024 & 2032
- Figure 23: North America Sugar Confectionery Market Revenue (Million), by Confectionery Variant 2024 & 2032
- Figure 24: North America Sugar Confectionery Market Volume (K Tons), by Confectionery Variant 2024 & 2032
- Figure 25: North America Sugar Confectionery Market Revenue Share (%), by Confectionery Variant 2024 & 2032
- Figure 26: North America Sugar Confectionery Market Volume Share (%), by Confectionery Variant 2024 & 2032
- Figure 27: North America Sugar Confectionery Market Revenue (Million), by Distribution Channel 2024 & 2032
- Figure 28: North America Sugar Confectionery Market Volume (K Tons), by Distribution Channel 2024 & 2032
- Figure 29: North America Sugar Confectionery Market Revenue Share (%), by Distribution Channel 2024 & 2032
- Figure 30: North America Sugar Confectionery Market Volume Share (%), by Distribution Channel 2024 & 2032
- Figure 31: North America Sugar Confectionery Market Revenue (Million), by Country 2024 & 2032
- Figure 32: North America Sugar Confectionery Market Volume (K Tons), by Country 2024 & 2032
- Figure 33: North America Sugar Confectionery Market Revenue Share (%), by Country 2024 & 2032
- Figure 34: North America Sugar Confectionery Market Volume Share (%), by Country 2024 & 2032
- Figure 35: South America Sugar Confectionery Market Revenue (Million), by Confectionery Variant 2024 & 2032
- Figure 36: South America Sugar Confectionery Market Volume (K Tons), by Confectionery Variant 2024 & 2032
- Figure 37: South America Sugar Confectionery Market Revenue Share (%), by Confectionery Variant 2024 & 2032
- Figure 38: South America Sugar Confectionery Market Volume Share (%), by Confectionery Variant 2024 & 2032
- Figure 39: South America Sugar Confectionery Market Revenue (Million), by Distribution Channel 2024 & 2032
- Figure 40: South America Sugar Confectionery Market Volume (K Tons), by Distribution Channel 2024 & 2032
- Figure 41: South America Sugar Confectionery Market Revenue Share (%), by Distribution Channel 2024 & 2032
- Figure 42: South America Sugar Confectionery Market Volume Share (%), by Distribution Channel 2024 & 2032
- Figure 43: South America Sugar Confectionery Market Revenue (Million), by Country 2024 & 2032
- Figure 44: South America Sugar Confectionery Market Volume (K Tons), by Country 2024 & 2032
- Figure 45: South America Sugar Confectionery Market Revenue Share (%), by Country 2024 & 2032
- Figure 46: South America Sugar Confectionery Market Volume Share (%), by Country 2024 & 2032
- Figure 47: Europe Sugar Confectionery Market Revenue (Million), by Confectionery Variant 2024 & 2032
- Figure 48: Europe Sugar Confectionery Market Volume (K Tons), by Confectionery Variant 2024 & 2032
- Figure 49: Europe Sugar Confectionery Market Revenue Share (%), by Confectionery Variant 2024 & 2032
- Figure 50: Europe Sugar Confectionery Market Volume Share (%), by Confectionery Variant 2024 & 2032
- Figure 51: Europe Sugar Confectionery Market Revenue (Million), by Distribution Channel 2024 & 2032
- Figure 52: Europe Sugar Confectionery Market Volume (K Tons), by Distribution Channel 2024 & 2032
- Figure 53: Europe Sugar Confectionery Market Revenue Share (%), by Distribution Channel 2024 & 2032
- Figure 54: Europe Sugar Confectionery Market Volume Share (%), by Distribution Channel 2024 & 2032
- Figure 55: Europe Sugar Confectionery Market Revenue (Million), by Country 2024 & 2032
- Figure 56: Europe Sugar Confectionery Market Volume (K Tons), by Country 2024 & 2032
- Figure 57: Europe Sugar Confectionery Market Revenue Share (%), by Country 2024 & 2032
- Figure 58: Europe Sugar Confectionery Market Volume Share (%), by Country 2024 & 2032
- Figure 59: Middle East & Africa Sugar Confectionery Market Revenue (Million), by Confectionery Variant 2024 & 2032
- Figure 60: Middle East & Africa Sugar Confectionery Market Volume (K Tons), by Confectionery Variant 2024 & 2032
- Figure 61: Middle East & Africa Sugar Confectionery Market Revenue Share (%), by Confectionery Variant 2024 & 2032
- Figure 62: Middle East & Africa Sugar Confectionery Market Volume Share (%), by Confectionery Variant 2024 & 2032
- Figure 63: Middle East & Africa Sugar Confectionery Market Revenue (Million), by Distribution Channel 2024 & 2032
- Figure 64: Middle East & Africa Sugar Confectionery Market Volume (K Tons), by Distribution Channel 2024 & 2032
- Figure 65: Middle East & Africa Sugar Confectionery Market Revenue Share (%), by Distribution Channel 2024 & 2032
- Figure 66: Middle East & Africa Sugar Confectionery Market Volume Share (%), by Distribution Channel 2024 & 2032
- Figure 67: Middle East & Africa Sugar Confectionery Market Revenue (Million), by Country 2024 & 2032
- Figure 68: Middle East & Africa Sugar Confectionery Market Volume (K Tons), by Country 2024 & 2032
- Figure 69: Middle East & Africa Sugar Confectionery Market Revenue Share (%), by Country 2024 & 2032
- Figure 70: Middle East & Africa Sugar Confectionery Market Volume Share (%), by Country 2024 & 2032
- Figure 71: Asia Pacific Sugar Confectionery Market Revenue (Million), by Confectionery Variant 2024 & 2032
- Figure 72: Asia Pacific Sugar Confectionery Market Volume (K Tons), by Confectionery Variant 2024 & 2032
- Figure 73: Asia Pacific Sugar Confectionery Market Revenue Share (%), by Confectionery Variant 2024 & 2032
- Figure 74: Asia Pacific Sugar Confectionery Market Volume Share (%), by Confectionery Variant 2024 & 2032
- Figure 75: Asia Pacific Sugar Confectionery Market Revenue (Million), by Distribution Channel 2024 & 2032
- Figure 76: Asia Pacific Sugar Confectionery Market Volume (K Tons), by Distribution Channel 2024 & 2032
- Figure 77: Asia Pacific Sugar Confectionery Market Revenue Share (%), by Distribution Channel 2024 & 2032
- Figure 78: Asia Pacific Sugar Confectionery Market Volume Share (%), by Distribution Channel 2024 & 2032
- Figure 79: Asia Pacific Sugar Confectionery Market Revenue (Million), by Country 2024 & 2032
- Figure 80: Asia Pacific Sugar Confectionery Market Volume (K Tons), by Country 2024 & 2032
- Figure 81: Asia Pacific Sugar Confectionery Market Revenue Share (%), by Country 2024 & 2032
- Figure 82: Asia Pacific Sugar Confectionery Market Volume Share (%), by Country 2024 & 2032
List of Tables
- Table 1: Global Sugar Confectionery Market Revenue Million Forecast, by Region 2019 & 2032
- Table 2: Global Sugar Confectionery Market Volume K Tons Forecast, by Region 2019 & 2032
- Table 3: Global Sugar Confectionery Market Revenue Million Forecast, by Confectionery Variant 2019 & 2032
- Table 4: Global Sugar Confectionery Market Volume K Tons Forecast, by Confectionery Variant 2019 & 2032
- Table 5: Global Sugar Confectionery Market Revenue Million Forecast, by Distribution Channel 2019 & 2032
- Table 6: Global Sugar Confectionery Market Volume K Tons Forecast, by Distribution Channel 2019 & 2032
- Table 7: Global Sugar Confectionery Market Revenue Million Forecast, by Region 2019 & 2032
- Table 8: Global Sugar Confectionery Market Volume K Tons Forecast, by Region 2019 & 2032
- Table 9: Global Sugar Confectionery Market Revenue Million Forecast, by Country 2019 & 2032
- Table 10: Global Sugar Confectionery Market Volume K Tons Forecast, by Country 2019 & 2032
- Table 11: Middle East Sugar Confectionery Market Revenue (Million) Forecast, by Application 2019 & 2032
- Table 12: Middle East Sugar Confectionery Market Volume (K Tons) Forecast, by Application 2019 & 2032
- Table 13: Africa Sugar Confectionery Market Revenue (Million) Forecast, by Application 2019 & 2032
- Table 14: Africa Sugar Confectionery Market Volume (K Tons) Forecast, by Application 2019 & 2032
- Table 15: Global Sugar Confectionery Market Revenue Million Forecast, by Country 2019 & 2032
- Table 16: Global Sugar Confectionery Market Volume K Tons Forecast, by Country 2019 & 2032
- Table 17: Brazil Sugar Confectionery Market Revenue (Million) Forecast, by Application 2019 & 2032
- Table 18: Brazil Sugar Confectionery Market Volume (K Tons) Forecast, by Application 2019 & 2032
- Table 19: Argentina Sugar Confectionery Market Revenue (Million) Forecast, by Application 2019 & 2032
- Table 20: Argentina Sugar Confectionery Market Volume (K Tons) Forecast, by Application 2019 & 2032
- Table 21: Rest of South America Sugar Confectionery Market Revenue (Million) Forecast, by Application 2019 & 2032
- Table 22: Rest of South America Sugar Confectionery Market Volume (K Tons) Forecast, by Application 2019 & 2032
- Table 23: Global Sugar Confectionery Market Revenue Million Forecast, by Country 2019 & 2032
- Table 24: Global Sugar Confectionery Market Volume K Tons Forecast, by Country 2019 & 2032
- Table 25: Germany Sugar Confectionery Market Revenue (Million) Forecast, by Application 2019 & 2032
- Table 26: Germany Sugar Confectionery Market Volume (K Tons) Forecast, by Application 2019 & 2032
- Table 27: Global Sugar Confectionery Market Revenue Million Forecast, by Country 2019 & 2032
- Table 28: Global Sugar Confectionery Market Volume K Tons Forecast, by Country 2019 & 2032
- Table 29: China Sugar Confectionery Market Revenue (Million) Forecast, by Application 2019 & 2032
- Table 30: China Sugar Confectionery Market Volume (K Tons) Forecast, by Application 2019 & 2032
- Table 31: Japan Sugar Confectionery Market Revenue (Million) Forecast, by Application 2019 & 2032
- Table 32: Japan Sugar Confectionery Market Volume (K Tons) Forecast, by Application 2019 & 2032
- Table 33: India Sugar Confectionery Market Revenue (Million) Forecast, by Application 2019 & 2032
- Table 34: India Sugar Confectionery Market Volume (K Tons) Forecast, by Application 2019 & 2032
- Table 35: South Korea Sugar Confectionery Market Revenue (Million) Forecast, by Application 2019 & 2032
- Table 36: South Korea Sugar Confectionery Market Volume (K Tons) Forecast, by Application 2019 & 2032
- Table 37: Taiwan Sugar Confectionery Market Revenue (Million) Forecast, by Application 2019 & 2032
- Table 38: Taiwan Sugar Confectionery Market Volume (K Tons) Forecast, by Application 2019 & 2032
- Table 39: Australia Sugar Confectionery Market Revenue (Million) Forecast, by Application 2019 & 2032
- Table 40: Australia Sugar Confectionery Market Volume (K Tons) Forecast, by Application 2019 & 2032
- Table 41: Rest of Asia-Pacific Sugar Confectionery Market Revenue (Million) Forecast, by Application 2019 & 2032
- Table 42: Rest of Asia-Pacific Sugar Confectionery Market Volume (K Tons) Forecast, by Application 2019 & 2032
- Table 43: Global Sugar Confectionery Market Revenue Million Forecast, by Country 2019 & 2032
- Table 44: Global Sugar Confectionery Market Volume K Tons Forecast, by Country 2019 & 2032
- Table 45: United States Canada Mexico Sugar Confectionery Market Revenue (Million) Forecast, by Application 2019 & 2032
- Table 46: United States Canada Mexico Sugar Confectionery Market Volume (K Tons) Forecast, by Application 2019 & 2032
- Table 47: Global Sugar Confectionery Market Revenue Million Forecast, by Confectionery Variant 2019 & 2032
- Table 48: Global Sugar Confectionery Market Volume K Tons Forecast, by Confectionery Variant 2019 & 2032
- Table 49: Global Sugar Confectionery Market Revenue Million Forecast, by Distribution Channel 2019 & 2032
- Table 50: Global Sugar Confectionery Market Volume K Tons Forecast, by Distribution Channel 2019 & 2032
- Table 51: Global Sugar Confectionery Market Revenue Million Forecast, by Country 2019 & 2032
- Table 52: Global Sugar Confectionery Market Volume K Tons Forecast, by Country 2019 & 2032
- Table 53: United States Sugar Confectionery Market Revenue (Million) Forecast, by Application 2019 & 2032
- Table 54: United States Sugar Confectionery Market Volume (K Tons) Forecast, by Application 2019 & 2032
- Table 55: Canada Sugar Confectionery Market Revenue (Million) Forecast, by Application 2019 & 2032
- Table 56: Canada Sugar Confectionery Market Volume (K Tons) Forecast, by Application 2019 & 2032
- Table 57: Mexico Sugar Confectionery Market Revenue (Million) Forecast, by Application 2019 & 2032
- Table 58: Mexico Sugar Confectionery Market Volume (K Tons) Forecast, by Application 2019 & 2032
- Table 59: Global Sugar Confectionery Market Revenue Million Forecast, by Confectionery Variant 2019 & 2032
- Table 60: Global Sugar Confectionery Market Volume K Tons Forecast, by Confectionery Variant 2019 & 2032
- Table 61: Global Sugar Confectionery Market Revenue Million Forecast, by Distribution Channel 2019 & 2032
- Table 62: Global Sugar Confectionery Market Volume K Tons Forecast, by Distribution Channel 2019 & 2032
- Table 63: Global Sugar Confectionery Market Revenue Million Forecast, by Country 2019 & 2032
- Table 64: Global Sugar Confectionery Market Volume K Tons Forecast, by Country 2019 & 2032
- Table 65: Brazil Sugar Confectionery Market Revenue (Million) Forecast, by Application 2019 & 2032
- Table 66: Brazil Sugar Confectionery Market Volume (K Tons) Forecast, by Application 2019 & 2032
- Table 67: Argentina Sugar Confectionery Market Revenue (Million) Forecast, by Application 2019 & 2032
- Table 68: Argentina Sugar Confectionery Market Volume (K Tons) Forecast, by Application 2019 & 2032
- Table 69: Rest of South America Sugar Confectionery Market Revenue (Million) Forecast, by Application 2019 & 2032
- Table 70: Rest of South America Sugar Confectionery Market Volume (K Tons) Forecast, by Application 2019 & 2032
- Table 71: Global Sugar Confectionery Market Revenue Million Forecast, by Confectionery Variant 2019 & 2032
- Table 72: Global Sugar Confectionery Market Volume K Tons Forecast, by Confectionery Variant 2019 & 2032
- Table 73: Global Sugar Confectionery Market Revenue Million Forecast, by Distribution Channel 2019 & 2032
- Table 74: Global Sugar Confectionery Market Volume K Tons Forecast, by Distribution Channel 2019 & 2032
- Table 75: Global Sugar Confectionery Market Revenue Million Forecast, by Country 2019 & 2032
- Table 76: Global Sugar Confectionery Market Volume K Tons Forecast, by Country 2019 & 2032
- Table 77: United Kingdom Sugar Confectionery Market Revenue (Million) Forecast, by Application 2019 & 2032
- Table 78: United Kingdom Sugar Confectionery Market Volume (K Tons) Forecast, by Application 2019 & 2032
- Table 79: Germany Sugar Confectionery Market Revenue (Million) Forecast, by Application 2019 & 2032
- Table 80: Germany Sugar Confectionery Market Volume (K Tons) Forecast, by Application 2019 & 2032
- Table 81: France Sugar Confectionery Market Revenue (Million) Forecast, by Application 2019 & 2032
- Table 82: France Sugar Confectionery Market Volume (K Tons) Forecast, by Application 2019 & 2032
- Table 83: Italy Sugar Confectionery Market Revenue (Million) Forecast, by Application 2019 & 2032
- Table 84: Italy Sugar Confectionery Market Volume (K Tons) Forecast, by Application 2019 & 2032
- Table 85: Spain Sugar Confectionery Market Revenue (Million) Forecast, by Application 2019 & 2032
- Table 86: Spain Sugar Confectionery Market Volume (K Tons) Forecast, by Application 2019 & 2032
- Table 87: Russia Sugar Confectionery Market Revenue (Million) Forecast, by Application 2019 & 2032
- Table 88: Russia Sugar Confectionery Market Volume (K Tons) Forecast, by Application 2019 & 2032
- Table 89: Benelux Sugar Confectionery Market Revenue (Million) Forecast, by Application 2019 & 2032
- Table 90: Benelux Sugar Confectionery Market Volume (K Tons) Forecast, by Application 2019 & 2032
- Table 91: Nordics Sugar Confectionery Market Revenue (Million) Forecast, by Application 2019 & 2032
- Table 92: Nordics Sugar Confectionery Market Volume (K Tons) Forecast, by Application 2019 & 2032
- Table 93: Rest of Europe Sugar Confectionery Market Revenue (Million) Forecast, by Application 2019 & 2032
- Table 94: Rest of Europe Sugar Confectionery Market Volume (K Tons) Forecast, by Application 2019 & 2032
- Table 95: Global Sugar Confectionery Market Revenue Million Forecast, by Confectionery Variant 2019 & 2032
- Table 96: Global Sugar Confectionery Market Volume K Tons Forecast, by Confectionery Variant 2019 & 2032
- Table 97: Global Sugar Confectionery Market Revenue Million Forecast, by Distribution Channel 2019 & 2032
- Table 98: Global Sugar Confectionery Market Volume K Tons Forecast, by Distribution Channel 2019 & 2032
- Table 99: Global Sugar Confectionery Market Revenue Million Forecast, by Country 2019 & 2032
- Table 100: Global Sugar Confectionery Market Volume K Tons Forecast, by Country 2019 & 2032
- Table 101: Turkey Sugar Confectionery Market Revenue (Million) Forecast, by Application 2019 & 2032
- Table 102: Turkey Sugar Confectionery Market Volume (K Tons) Forecast, by Application 2019 & 2032
- Table 103: Israel Sugar Confectionery Market Revenue (Million) Forecast, by Application 2019 & 2032
- Table 104: Israel Sugar Confectionery Market Volume (K Tons) Forecast, by Application 2019 & 2032
- Table 105: GCC Sugar Confectionery Market Revenue (Million) Forecast, by Application 2019 & 2032
- Table 106: GCC Sugar Confectionery Market Volume (K Tons) Forecast, by Application 2019 & 2032
- Table 107: North Africa Sugar Confectionery Market Revenue (Million) Forecast, by Application 2019 & 2032
- Table 108: North Africa Sugar Confectionery Market Volume (K Tons) Forecast, by Application 2019 & 2032
- Table 109: South Africa Sugar Confectionery Market Revenue (Million) Forecast, by Application 2019 & 2032
- Table 110: South Africa Sugar Confectionery Market Volume (K Tons) Forecast, by Application 2019 & 2032
- Table 111: Rest of Middle East & Africa Sugar Confectionery Market Revenue (Million) Forecast, by Application 2019 & 2032
- Table 112: Rest of Middle East & Africa Sugar Confectionery Market Volume (K Tons) Forecast, by Application 2019 & 2032
- Table 113: Global Sugar Confectionery Market Revenue Million Forecast, by Confectionery Variant 2019 & 2032
- Table 114: Global Sugar Confectionery Market Volume K Tons Forecast, by Confectionery Variant 2019 & 2032
- Table 115: Global Sugar Confectionery Market Revenue Million Forecast, by Distribution Channel 2019 & 2032
- Table 116: Global Sugar Confectionery Market Volume K Tons Forecast, by Distribution Channel 2019 & 2032
- Table 117: Global Sugar Confectionery Market Revenue Million Forecast, by Country 2019 & 2032
- Table 118: Global Sugar Confectionery Market Volume K Tons Forecast, by Country 2019 & 2032
- Table 119: China Sugar Confectionery Market Revenue (Million) Forecast, by Application 2019 & 2032
- Table 120: China Sugar Confectionery Market Volume (K Tons) Forecast, by Application 2019 & 2032
- Table 121: India Sugar Confectionery Market Revenue (Million) Forecast, by Application 2019 & 2032
- Table 122: India Sugar Confectionery Market Volume (K Tons) Forecast, by Application 2019 & 2032
- Table 123: Japan Sugar Confectionery Market Revenue (Million) Forecast, by Application 2019 & 2032
- Table 124: Japan Sugar Confectionery Market Volume (K Tons) Forecast, by Application 2019 & 2032
- Table 125: South Korea Sugar Confectionery Market Revenue (Million) Forecast, by Application 2019 & 2032
- Table 126: South Korea Sugar Confectionery Market Volume (K Tons) Forecast, by Application 2019 & 2032
- Table 127: ASEAN Sugar Confectionery Market Revenue (Million) Forecast, by Application 2019 & 2032
- Table 128: ASEAN Sugar Confectionery Market Volume (K Tons) Forecast, by Application 2019 & 2032
- Table 129: Oceania Sugar Confectionery Market Revenue (Million) Forecast, by Application 2019 & 2032
- Table 130: Oceania Sugar Confectionery Market Volume (K Tons) Forecast, by Application 2019 & 2032
- Table 131: Rest of Asia Pacific Sugar Confectionery Market Revenue (Million) Forecast, by Application 2019 & 2032
- Table 132: Rest of Asia Pacific Sugar Confectionery Market Volume (K Tons) Forecast, by Application 2019 & 2032
Frequently Asked Questions
1. What is the projected Compound Annual Growth Rate (CAGR) of the Sugar Confectionery Market?
The projected CAGR is approximately 5.45%.
2. Which companies are prominent players in the Sugar Confectionery Market?
Key companies in the market include Nestlé SA, Perfetti Van Melle BV, August Storck KG, Ferrero International SA, Cloetta AB, Oy Karl Fazer Ab, Mars Incorporated, Arcor S A I C, Mount Franklin Foods LLC, HARIBO Holding GmbH & Co KG, The Hershey Compan, Mondelēz International Inc, Meiji Holdings Company Ltd.
3. What are the main segments of the Sugar Confectionery Market?
The market segments include Confectionery Variant, Distribution Channel.
4. Can you provide details about the market size?
The market size is estimated to be USD 53210 Million as of 2022.
5. What are some drivers contributing to market growth?
Increasing demand for meat alternatives.
6. What are the notable trends driving market growth?
OTHER KEY INDUSTRY TRENDS COVERED IN THE REPORT.
7. Are there any restraints impacting market growth?
Presence of numerous alternatives in the plant proteins.
8. Can you provide examples of recent developments in the market?
July 2023: HARIBO® officially began gummi production at its first-ever North American manufacturing facility, located in Pleasant Prairie, Wis. The brand-new, state-of-the-art factory was created to meet the growing demand by US consumers of the beloved gummi brand, which produces over 25 varieties of gummi treats in the US and more than 1,200 types globally.June 2023: Tic Tac launched a new spearmint flavor variant in India. The introduction of this refreshing and strong mint variant is aimed at meeting the longstanding demand for a flavor that can be enjoyed in diverse moments throughout the day, such as after meals, workouts, and before important meetings.May 2023: Mondelēz International Inc. opened its new Global Research & Development (R&D) Innovation Center in Whippany, New Jersey. The state-of-the-art facility, which is supported by an investment of nearly USD 50 million, includes pilot and scale-up capability for cookies, crackers, and candy.
9. What pricing options are available for accessing the report?
Pricing options include single-user, multi-user, and enterprise licenses priced at USD 3800, USD 4500, and USD 5800 respectively.
10. Is the market size provided in terms of value or volume?
The market size is provided in terms of value, measured in Million and volume, measured in K Tons.
11. Are there any specific market keywords associated with the report?
Yes, the market keyword associated with the report is "Sugar Confectionery Market," which aids in identifying and referencing the specific market segment covered.
12. How do I determine which pricing option suits my needs best?
The pricing options vary based on user requirements and access needs. Individual users may opt for single-user licenses, while businesses requiring broader access may choose multi-user or enterprise licenses for cost-effective access to the report.
13. Are there any additional resources or data provided in the Sugar Confectionery Market report?
While the report offers comprehensive insights, it's advisable to review the specific contents or supplementary materials provided to ascertain if additional resources or data are available.
14. How can I stay updated on further developments or reports in the Sugar Confectionery Market?
To stay informed about further developments, trends, and reports in the Sugar Confectionery Market, consider subscribing to industry newsletters, following relevant companies and organizations, or regularly checking reputable industry news sources and publications.
Methodology
Step 1 - Identification of Relevant Samples Size from Population Database


Step 2 - Approaches for Defining Global Market Size (Value, Volume* & Price*)

Note*: In applicable scenarios
Step 3 - Data Sources
Primary Research
- Web Analytics
- Survey Reports
- Research Institute
- Latest Research Reports
- Opinion Leaders
Secondary Research
- Annual Reports
- White Paper
- Latest Press Release
- Industry Association
- Paid Database
- Investor Presentations

Step 4 - Data Triangulation
Involves using different sources of information in order to increase the validity of a study
These sources are likely to be stakeholders in a program - participants, other researchers, program staff, other community members, and so on.
Then we put all data in single framework & apply various statistical tools to find out the dynamic on the market.
During the analysis stage, feedback from the stakeholder groups would be compared to determine areas of agreement as well as areas of divergence


