
Key Insights
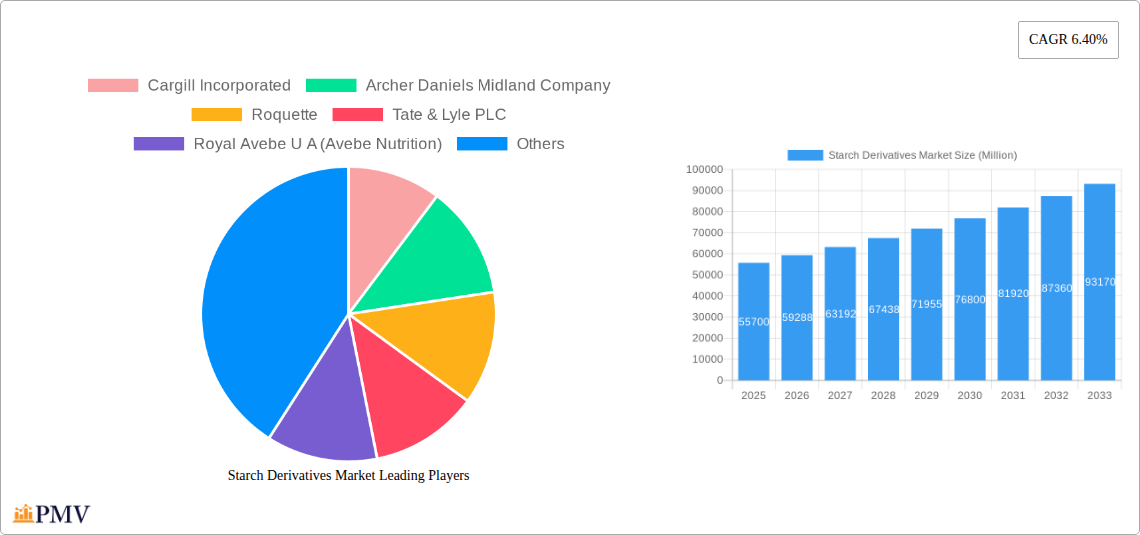
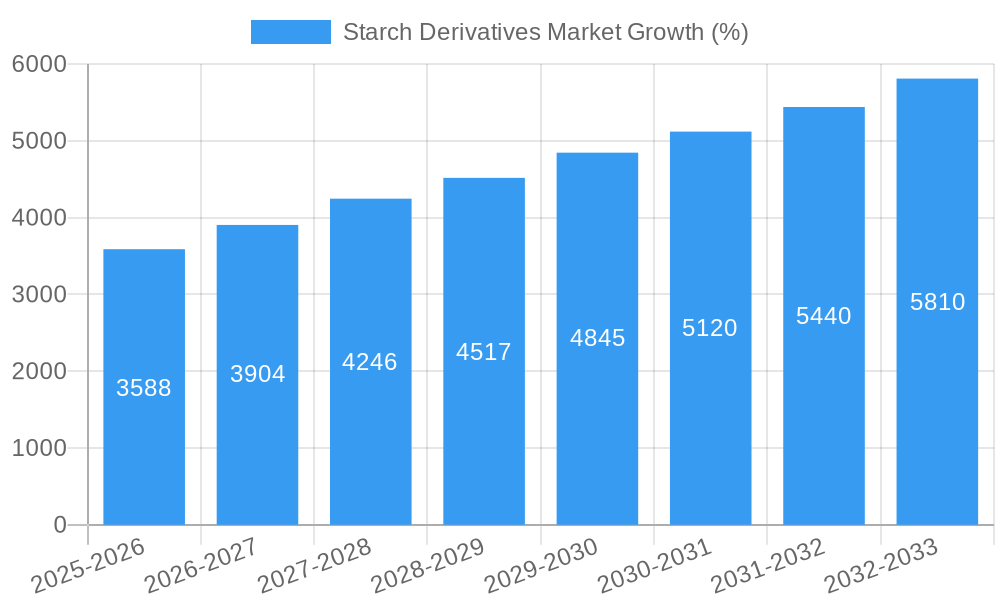
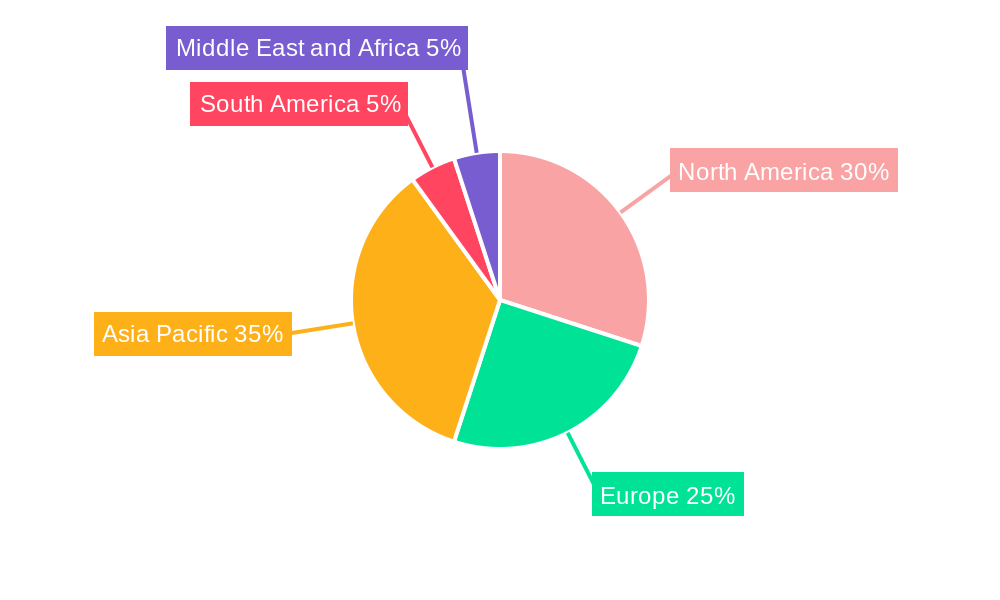
The global starch derivatives market, valued at $55.7 billion in 2025, is projected to experience robust growth, exhibiting a Compound Annual Growth Rate (CAGR) of 6.40% from 2025 to 2033. This expansion is fueled by several key factors. The increasing demand for processed foods and beverages across the globe is a primary driver, with starch derivatives serving as crucial ingredients in enhancing texture, taste, and shelf life. Furthermore, the rising adoption of starch derivatives in the pharmaceutical and cosmetic industries, due to their biocompatibility and functional properties, contributes significantly to market growth. Growth in the feed industry, particularly in animal feed, is another significant factor. The corn-based segment dominates the source category, owing to the wide availability and cost-effectiveness of corn as a raw material. However, the market also witnesses growing interest in starch derivatives sourced from other sustainable and readily available materials like cassava and potato, driven by increasing consumer preference for natural and organic products. Regional variations are expected, with North America and Europe maintaining substantial market shares due to established food processing industries and high per capita consumption. The Asia-Pacific region, however, is poised for significant growth, driven by rapid economic development and urbanization, leading to increased demand for processed foods. The competitive landscape is characterized by the presence of major global players such as Cargill, ADM, and Roquette, alongside a number of regional manufacturers.
The market's growth trajectory is likely to be influenced by several factors. Fluctuations in raw material prices (corn, wheat, etc.) could impact profitability. Stringent regulatory frameworks concerning food additives and safety standards can also influence market dynamics. However, ongoing research and development focusing on innovative starch derivative applications, coupled with increased investments in sustainable production practices, is expected to counterbalance these challenges. The market is witnessing a surge in the demand for modified starches offering enhanced functionalities, including improved texture, viscosity, and stability, further driving innovation and expansion in the coming years. The development of bio-based and biodegradable starch derivatives is also attracting significant attention, contributing to the market’s sustainable growth trajectory. The diversification of applications into newer sectors, such as bioplastics and biofuels, is also expected to contribute to the market’s growth.
Starch Derivatives Market: A Comprehensive Report (2019-2033)
This comprehensive report provides an in-depth analysis of the global Starch Derivatives Market, offering invaluable insights for industry stakeholders, investors, and researchers. Covering the period from 2019 to 2033, with 2025 as the base year, this report meticulously examines market dynamics, competitive landscapes, and future growth prospects. The market is projected to reach xx Million by 2033, exhibiting a CAGR of xx% during the forecast period (2025-2033).
Starch Derivatives Market Market Structure & Competitive Dynamics
The global starch derivatives market is moderately concentrated, with several major players holding significant market share. Key players such as Cargill Incorporated, Archer Daniels Midland Company, Roquette, Tate & Lyle PLC, and Ingredion Incorporated, dominate the market, leveraging their extensive production capabilities and global distribution networks. The market structure is characterized by both horizontal and vertical integration, with some companies involved in all stages of the value chain, from starch production to end-product applications.
The competitive landscape is dynamic, influenced by factors such as product innovation, M&A activity, and regulatory changes. Recent years have witnessed significant M&A activity, with deal values ranging from xx Million to xx Million. For example, Archer Daniels Midland Company's acquisition of a biotech firm exemplifies the strategic moves undertaken to enhance technological capabilities. This consolidation trend is expected to continue, leading to further market concentration and increased competition.
- Market Concentration: Moderately concentrated, with top 5 players holding approximately xx% market share in 2025.
- Innovation Ecosystems: Strong emphasis on R&D, with continuous innovation in starch modification technologies.
- Regulatory Frameworks: Varying regulations across different regions, impacting production costs and market access.
- Product Substitutes: Growing competition from synthetic polymers and other bio-based materials.
- End-User Trends: Increasing demand from food & beverage, pharmaceutical, and industrial sectors.
- M&A Activities: Significant M&A activity, driven by strategic expansion and technological advancements.
Starch Derivatives Market Industry Trends & Insights
The starch derivatives market is experiencing robust growth, driven by several key factors. Rising demand from the food and beverage industry, particularly for modified starches in processed foods, is a significant driver. The increasing adoption of starch derivatives in other sectors, including pharmaceuticals (as excipients and drug delivery systems), paper manufacturing (as coatings and adhesives), and bioethanol production, further fuels market expansion. Technological advancements in starch modification techniques, enabling the production of tailored starches with improved properties, are also contributing to market growth.
Consumer preferences towards healthier and more convenient food products are driving innovation in the starch derivatives market, with a focus on developing clean-label and functional ingredients. Competitive dynamics are characterized by continuous product innovation, strategic partnerships, and expansion into new geographical markets. The market is expected to maintain a strong growth trajectory, with a projected CAGR of xx% from 2025 to 2033. Market penetration in emerging economies is also expected to increase significantly.
Dominant Markets & Segments in Starch Derivatives Market
The North American region currently holds the largest market share in the starch derivatives market, driven by strong demand from the food and beverage and pharmaceutical industries. Within the segments:
By Type: Modified starch holds the largest market share, followed by maltodextrin and glucose syrups. The modified starch segment’s growth is fueled by its versatile applications across various industries.
By Source: Corn remains the dominant source of starch, owing to its cost-effectiveness and wide availability. However, the cassava and potato segments are experiencing increased growth due to regional preferences and sustainability concerns.
By Application: The food and beverage industry represents the largest application segment, driven by the growing demand for processed foods and beverages. Pharmaceutical and industrial applications are also experiencing significant growth.
Key Drivers for Dominant Segments:
- Food & Beverage (North America): High consumption of processed foods, strong consumer demand, and established supply chains.
- Modified Starch (Global): Versatility in applications, functional properties, and continuous product innovations.
- Corn (Global): Cost-effectiveness, high yield, and wide availability.
Starch Derivatives Market Product Innovations
Recent innovations in starch derivatives focus on developing high-performance starches with tailored properties for specific applications. This includes developing starches with enhanced functionalities, such as improved texture, viscosity, and stability, as well as starches with specific health benefits, like reduced glycemic index. These innovations are driven by technological advancements in starch modification techniques, such as enzymatic modification and cross-linking. The market is witnessing the emergence of novel starch-based materials with applications in bioplastics and biodegradable films, driven by growing sustainability concerns.
Report Segmentation & Scope
This report provides a granular analysis of the starch derivatives market across various segments:
By Type: Maltodextrin, Cyclodextrin, Glucose Syrups, Hydrolysates, Modified Starch, Others. Each segment's growth is analyzed, considering market size, CAGR, and competitive dynamics.
By Source: Corn, Wheat, Cassava, Potato, Other Sources. The report assesses the impact of raw material availability and prices on each segment’s growth trajectory.
By Application: Food and Beverage, Feed, Paper Industry, Pharmaceutical Industry, Bioethanol, Cosmetics, Other Industrial Applications. The report projects growth potential based on end-user industry trends and technological advancements.
Key Drivers of Starch Derivatives Market Growth
The starch derivatives market is propelled by several factors. The increasing demand for processed foods and beverages, driven by changing dietary habits and lifestyles, is a major contributor. Advancements in starch modification technologies, enabling the creation of starches with specific functional properties, also contribute. Furthermore, growing applications in non-food sectors such as pharmaceuticals, paper, and biofuels fuel market expansion. Favorable government policies promoting bio-based materials are further augmenting growth.
Challenges in the Starch Derivatives Market Sector
The starch derivatives market faces certain challenges, including fluctuations in raw material prices and supply chain disruptions. Stringent regulatory requirements for food-grade starches and the increasing competition from synthetic polymers present additional hurdles. Sustainability concerns regarding the environmental impact of starch production and disposal also pose challenges for market players. These factors can impact production costs and market competitiveness.
Leading Players in the Starch Derivatives Market Market
- Cargill Incorporated
- Archer Daniels Midland Company
- Roquette
- Tate & Lyle PLC
- Royal Avebe U A (Avebe Nutrition)
- Tereos S A
- Ingredion Incorporated
- Beneo
- Cumberland Packing Corp
- Glycom
Key Developments in Starch Derivatives Market Sector
- 2023 (Q3): Cargill Incorporated invested xx Million in a new starch processing facility in [Location], increasing its production capacity.
- 2022 (Q4): Archer Daniels Midland Company acquired [Biotech Company Name], enhancing its starch modification capabilities and expanding its product portfolio.
- 2021 (Q2): Roquette announced its commitment to sustainable starch production, focusing on reducing its environmental footprint and expanding its biopolymer applications.
Strategic Starch Derivatives Market Market Outlook
The starch derivatives market is poised for significant growth in the coming years, driven by increasing demand across various sectors and ongoing technological innovations. Strategic opportunities lie in developing sustainable and high-performance starch derivatives, expanding into new geographic markets, and forging strategic partnerships to enhance supply chains and distribution networks. A focus on meeting growing consumer demand for clean-label and functional ingredients will be crucial for success in this evolving market.
Starch Derivatives Market Segmentation
-
1. Type
- 1.1. Maltodextrin
- 1.2. Cyclodextrin
- 1.3. Glucose Syrups
- 1.4. Hydrolysates
- 1.5. Modified Starch
- 1.6. Others
-
2. Source
- 2.1. Corn
- 2.2. Wheat
- 2.3. Cassava
- 2.4. Potato
- 2.5. Other Sources
-
3. Application
- 3.1. Food and Beverage
- 3.2. Feed
- 3.3. Paper Industry
- 3.4. Pharmaceutical Industry
- 3.5. Bioethanol
- 3.6. Cosmetics
- 3.7. Other Industrial Applications
Starch Derivatives Market Segmentation By Geography
-
1. North America
- 1.1. United States
- 1.2. Canada
- 1.3. Mexico
- 1.4. Rest of North America
-
2. Europe
- 2.1. Spain
- 2.2. United Kingdom
- 2.3. France
- 2.4. Germany
- 2.5. Russia
- 2.6. Italy
- 2.7. Rest of Europe
-
3. Asia Pacific
- 3.1. China
- 3.2. Japan
- 3.3. India
- 3.4. Singapore
- 3.5. Australia
- 3.6. Rest of Asia Pacific
-
4. South America
- 4.1. Brazil
- 4.2. Argentina
- 4.3. Rest of South America
-
5. Middle East and Africa
- 5.1. South Africa
- 5.2. United Arab Emirates
- 5.3. Saudi Arabia
- 5.4. Rest of Middle East
Starch Derivatives Market REPORT HIGHLIGHTS
| Aspects | Details |
|---|---|
| Study Period | 2019-2033 |
| Base Year | 2024 |
| Estimated Year | 2025 |
| Forecast Period | 2025-2033 |
| Historical Period | 2019-2024 |
| Growth Rate | CAGR of 6.40% from 2019-2033 |
| Segmentation |
|
Table of Contents
- 1. Introduction
- 1.1. Research Scope
- 1.2. Market Segmentation
- 1.3. Research Methodology
- 1.4. Definitions and Assumptions
- 2. Executive Summary
- 2.1. Introduction
- 3. Market Dynamics
- 3.1. Introduction
- 3.2. Market Drivers
- 3.2.1. Inclination Towards Fitness and Increasing Intake of Plant-based Protein; Increase in Consumer Inclination Towards Meat Substitutes
- 3.3. Market Restrains
- 3.3.1. Gluten-Intolerance Among the Population Hindering the Market
- 3.4. Market Trends
- 3.4.1. Modified Starch is Strongly Accelerating the Overall Market For Starch Derivatives
- 4. Market Factor Analysis
- 4.1. Porters Five Forces
- 4.2. Supply/Value Chain
- 4.3. PESTEL analysis
- 4.4. Market Entropy
- 4.5. Patent/Trademark Analysis
- 5. Global Starch Derivatives Market Analysis, Insights and Forecast, 2019-2031
- 5.1. Market Analysis, Insights and Forecast - by Type
- 5.1.1. Maltodextrin
- 5.1.2. Cyclodextrin
- 5.1.3. Glucose Syrups
- 5.1.4. Hydrolysates
- 5.1.5. Modified Starch
- 5.1.6. Others
- 5.2. Market Analysis, Insights and Forecast - by Source
- 5.2.1. Corn
- 5.2.2. Wheat
- 5.2.3. Cassava
- 5.2.4. Potato
- 5.2.5. Other Sources
- 5.3. Market Analysis, Insights and Forecast - by Application
- 5.3.1. Food and Beverage
- 5.3.2. Feed
- 5.3.3. Paper Industry
- 5.3.4. Pharmaceutical Industry
- 5.3.5. Bioethanol
- 5.3.6. Cosmetics
- 5.3.7. Other Industrial Applications
- 5.4. Market Analysis, Insights and Forecast - by Region
- 5.4.1. North America
- 5.4.2. Europe
- 5.4.3. Asia Pacific
- 5.4.4. South America
- 5.4.5. Middle East and Africa
- 5.1. Market Analysis, Insights and Forecast - by Type
- 6. North America Starch Derivatives Market Analysis, Insights and Forecast, 2019-2031
- 6.1. Market Analysis, Insights and Forecast - by Type
- 6.1.1. Maltodextrin
- 6.1.2. Cyclodextrin
- 6.1.3. Glucose Syrups
- 6.1.4. Hydrolysates
- 6.1.5. Modified Starch
- 6.1.6. Others
- 6.2. Market Analysis, Insights and Forecast - by Source
- 6.2.1. Corn
- 6.2.2. Wheat
- 6.2.3. Cassava
- 6.2.4. Potato
- 6.2.5. Other Sources
- 6.3. Market Analysis, Insights and Forecast - by Application
- 6.3.1. Food and Beverage
- 6.3.2. Feed
- 6.3.3. Paper Industry
- 6.3.4. Pharmaceutical Industry
- 6.3.5. Bioethanol
- 6.3.6. Cosmetics
- 6.3.7. Other Industrial Applications
- 6.1. Market Analysis, Insights and Forecast - by Type
- 7. Europe Starch Derivatives Market Analysis, Insights and Forecast, 2019-2031
- 7.1. Market Analysis, Insights and Forecast - by Type
- 7.1.1. Maltodextrin
- 7.1.2. Cyclodextrin
- 7.1.3. Glucose Syrups
- 7.1.4. Hydrolysates
- 7.1.5. Modified Starch
- 7.1.6. Others
- 7.2. Market Analysis, Insights and Forecast - by Source
- 7.2.1. Corn
- 7.2.2. Wheat
- 7.2.3. Cassava
- 7.2.4. Potato
- 7.2.5. Other Sources
- 7.3. Market Analysis, Insights and Forecast - by Application
- 7.3.1. Food and Beverage
- 7.3.2. Feed
- 7.3.3. Paper Industry
- 7.3.4. Pharmaceutical Industry
- 7.3.5. Bioethanol
- 7.3.6. Cosmetics
- 7.3.7. Other Industrial Applications
- 7.1. Market Analysis, Insights and Forecast - by Type
- 8. Asia Pacific Starch Derivatives Market Analysis, Insights and Forecast, 2019-2031
- 8.1. Market Analysis, Insights and Forecast - by Type
- 8.1.1. Maltodextrin
- 8.1.2. Cyclodextrin
- 8.1.3. Glucose Syrups
- 8.1.4. Hydrolysates
- 8.1.5. Modified Starch
- 8.1.6. Others
- 8.2. Market Analysis, Insights and Forecast - by Source
- 8.2.1. Corn
- 8.2.2. Wheat
- 8.2.3. Cassava
- 8.2.4. Potato
- 8.2.5. Other Sources
- 8.3. Market Analysis, Insights and Forecast - by Application
- 8.3.1. Food and Beverage
- 8.3.2. Feed
- 8.3.3. Paper Industry
- 8.3.4. Pharmaceutical Industry
- 8.3.5. Bioethanol
- 8.3.6. Cosmetics
- 8.3.7. Other Industrial Applications
- 8.1. Market Analysis, Insights and Forecast - by Type
- 9. South America Starch Derivatives Market Analysis, Insights and Forecast, 2019-2031
- 9.1. Market Analysis, Insights and Forecast - by Type
- 9.1.1. Maltodextrin
- 9.1.2. Cyclodextrin
- 9.1.3. Glucose Syrups
- 9.1.4. Hydrolysates
- 9.1.5. Modified Starch
- 9.1.6. Others
- 9.2. Market Analysis, Insights and Forecast - by Source
- 9.2.1. Corn
- 9.2.2. Wheat
- 9.2.3. Cassava
- 9.2.4. Potato
- 9.2.5. Other Sources
- 9.3. Market Analysis, Insights and Forecast - by Application
- 9.3.1. Food and Beverage
- 9.3.2. Feed
- 9.3.3. Paper Industry
- 9.3.4. Pharmaceutical Industry
- 9.3.5. Bioethanol
- 9.3.6. Cosmetics
- 9.3.7. Other Industrial Applications
- 9.1. Market Analysis, Insights and Forecast - by Type
- 10. Middle East and Africa Starch Derivatives Market Analysis, Insights and Forecast, 2019-2031
- 10.1. Market Analysis, Insights and Forecast - by Type
- 10.1.1. Maltodextrin
- 10.1.2. Cyclodextrin
- 10.1.3. Glucose Syrups
- 10.1.4. Hydrolysates
- 10.1.5. Modified Starch
- 10.1.6. Others
- 10.2. Market Analysis, Insights and Forecast - by Source
- 10.2.1. Corn
- 10.2.2. Wheat
- 10.2.3. Cassava
- 10.2.4. Potato
- 10.2.5. Other Sources
- 10.3. Market Analysis, Insights and Forecast - by Application
- 10.3.1. Food and Beverage
- 10.3.2. Feed
- 10.3.3. Paper Industry
- 10.3.4. Pharmaceutical Industry
- 10.3.5. Bioethanol
- 10.3.6. Cosmetics
- 10.3.7. Other Industrial Applications
- 10.1. Market Analysis, Insights and Forecast - by Type
- 11. North America Starch Derivatives Market Analysis, Insights and Forecast, 2019-2031
- 11.1. Market Analysis, Insights and Forecast - By Country/Sub-region
- 11.1.1 United States
- 11.1.2 Canada
- 11.1.3 Mexico
- 11.1.4 Rest of North America
- 12. Europe Starch Derivatives Market Analysis, Insights and Forecast, 2019-2031
- 12.1. Market Analysis, Insights and Forecast - By Country/Sub-region
- 12.1.1 Spain
- 12.1.2 United Kingdom
- 12.1.3 France
- 12.1.4 Germany
- 12.1.5 Russia
- 12.1.6 Italy
- 12.1.7 Rest of Europe
- 13. Asia Pacific Starch Derivatives Market Analysis, Insights and Forecast, 2019-2031
- 13.1. Market Analysis, Insights and Forecast - By Country/Sub-region
- 13.1.1 China
- 13.1.2 Japan
- 13.1.3 India
- 13.1.4 Singapore
- 13.1.5 Australia
- 13.1.6 Rest of Asia Pacific
- 14. South America Starch Derivatives Market Analysis, Insights and Forecast, 2019-2031
- 14.1. Market Analysis, Insights and Forecast - By Country/Sub-region
- 14.1.1 Brazil
- 14.1.2 Argentina
- 14.1.3 Rest of South America
- 15. Middle East and Africa Starch Derivatives Market Analysis, Insights and Forecast, 2019-2031
- 15.1. Market Analysis, Insights and Forecast - By Country/Sub-region
- 15.1.1 South Africa
- 15.1.2 United Arab Emirates
- 15.1.3 Saudi Arabia
- 15.1.4 Rest of Middle East
- 16. Competitive Analysis
- 16.1. Global Market Share Analysis 2024
- 16.2. Company Profiles
- 16.2.1 Cargill Incorporated
- 16.2.1.1. Overview
- 16.2.1.2. Products
- 16.2.1.3. SWOT Analysis
- 16.2.1.4. Recent Developments
- 16.2.1.5. Financials (Based on Availability)
- 16.2.2 Archer Daniels Midland Company
- 16.2.2.1. Overview
- 16.2.2.2. Products
- 16.2.2.3. SWOT Analysis
- 16.2.2.4. Recent Developments
- 16.2.2.5. Financials (Based on Availability)
- 16.2.3 Roquette
- 16.2.3.1. Overview
- 16.2.3.2. Products
- 16.2.3.3. SWOT Analysis
- 16.2.3.4. Recent Developments
- 16.2.3.5. Financials (Based on Availability)
- 16.2.4 Tate & Lyle PLC
- 16.2.4.1. Overview
- 16.2.4.2. Products
- 16.2.4.3. SWOT Analysis
- 16.2.4.4. Recent Developments
- 16.2.4.5. Financials (Based on Availability)
- 16.2.5 Royal Avebe U A (Avebe Nutrition)
- 16.2.5.1. Overview
- 16.2.5.2. Products
- 16.2.5.3. SWOT Analysis
- 16.2.5.4. Recent Developments
- 16.2.5.5. Financials (Based on Availability)
- 16.2.6 Tereos S A*List Not Exhaustive
- 16.2.6.1. Overview
- 16.2.6.2. Products
- 16.2.6.3. SWOT Analysis
- 16.2.6.4. Recent Developments
- 16.2.6.5. Financials (Based on Availability)
- 16.2.7 Ingredion Incorporated
- 16.2.7.1. Overview
- 16.2.7.2. Products
- 16.2.7.3. SWOT Analysis
- 16.2.7.4. Recent Developments
- 16.2.7.5. Financials (Based on Availability)
- 16.2.8 Beneo
- 16.2.8.1. Overview
- 16.2.8.2. Products
- 16.2.8.3. SWOT Analysis
- 16.2.8.4. Recent Developments
- 16.2.8.5. Financials (Based on Availability)
- 16.2.9 Cumberland Packing Corp
- 16.2.9.1. Overview
- 16.2.9.2. Products
- 16.2.9.3. SWOT Analysis
- 16.2.9.4. Recent Developments
- 16.2.9.5. Financials (Based on Availability)
- 16.2.10 Glycom
- 16.2.10.1. Overview
- 16.2.10.2. Products
- 16.2.10.3. SWOT Analysis
- 16.2.10.4. Recent Developments
- 16.2.10.5. Financials (Based on Availability)
- 16.2.1 Cargill Incorporated
List of Figures
- Figure 1: Global Starch Derivatives Market Revenue Breakdown (Million, %) by Region 2024 & 2032
- Figure 2: Global Starch Derivatives Market Volume Breakdown (K Tons, %) by Region 2024 & 2032
- Figure 3: North America Starch Derivatives Market Revenue (Million), by Country 2024 & 2032
- Figure 4: North America Starch Derivatives Market Volume (K Tons), by Country 2024 & 2032
- Figure 5: North America Starch Derivatives Market Revenue Share (%), by Country 2024 & 2032
- Figure 6: North America Starch Derivatives Market Volume Share (%), by Country 2024 & 2032
- Figure 7: Europe Starch Derivatives Market Revenue (Million), by Country 2024 & 2032
- Figure 8: Europe Starch Derivatives Market Volume (K Tons), by Country 2024 & 2032
- Figure 9: Europe Starch Derivatives Market Revenue Share (%), by Country 2024 & 2032
- Figure 10: Europe Starch Derivatives Market Volume Share (%), by Country 2024 & 2032
- Figure 11: Asia Pacific Starch Derivatives Market Revenue (Million), by Country 2024 & 2032
- Figure 12: Asia Pacific Starch Derivatives Market Volume (K Tons), by Country 2024 & 2032
- Figure 13: Asia Pacific Starch Derivatives Market Revenue Share (%), by Country 2024 & 2032
- Figure 14: Asia Pacific Starch Derivatives Market Volume Share (%), by Country 2024 & 2032
- Figure 15: South America Starch Derivatives Market Revenue (Million), by Country 2024 & 2032
- Figure 16: South America Starch Derivatives Market Volume (K Tons), by Country 2024 & 2032
- Figure 17: South America Starch Derivatives Market Revenue Share (%), by Country 2024 & 2032
- Figure 18: South America Starch Derivatives Market Volume Share (%), by Country 2024 & 2032
- Figure 19: Middle East and Africa Starch Derivatives Market Revenue (Million), by Country 2024 & 2032
- Figure 20: Middle East and Africa Starch Derivatives Market Volume (K Tons), by Country 2024 & 2032
- Figure 21: Middle East and Africa Starch Derivatives Market Revenue Share (%), by Country 2024 & 2032
- Figure 22: Middle East and Africa Starch Derivatives Market Volume Share (%), by Country 2024 & 2032
- Figure 23: North America Starch Derivatives Market Revenue (Million), by Type 2024 & 2032
- Figure 24: North America Starch Derivatives Market Volume (K Tons), by Type 2024 & 2032
- Figure 25: North America Starch Derivatives Market Revenue Share (%), by Type 2024 & 2032
- Figure 26: North America Starch Derivatives Market Volume Share (%), by Type 2024 & 2032
- Figure 27: North America Starch Derivatives Market Revenue (Million), by Source 2024 & 2032
- Figure 28: North America Starch Derivatives Market Volume (K Tons), by Source 2024 & 2032
- Figure 29: North America Starch Derivatives Market Revenue Share (%), by Source 2024 & 2032
- Figure 30: North America Starch Derivatives Market Volume Share (%), by Source 2024 & 2032
- Figure 31: North America Starch Derivatives Market Revenue (Million), by Application 2024 & 2032
- Figure 32: North America Starch Derivatives Market Volume (K Tons), by Application 2024 & 2032
- Figure 33: North America Starch Derivatives Market Revenue Share (%), by Application 2024 & 2032
- Figure 34: North America Starch Derivatives Market Volume Share (%), by Application 2024 & 2032
- Figure 35: North America Starch Derivatives Market Revenue (Million), by Country 2024 & 2032
- Figure 36: North America Starch Derivatives Market Volume (K Tons), by Country 2024 & 2032
- Figure 37: North America Starch Derivatives Market Revenue Share (%), by Country 2024 & 2032
- Figure 38: North America Starch Derivatives Market Volume Share (%), by Country 2024 & 2032
- Figure 39: Europe Starch Derivatives Market Revenue (Million), by Type 2024 & 2032
- Figure 40: Europe Starch Derivatives Market Volume (K Tons), by Type 2024 & 2032
- Figure 41: Europe Starch Derivatives Market Revenue Share (%), by Type 2024 & 2032
- Figure 42: Europe Starch Derivatives Market Volume Share (%), by Type 2024 & 2032
- Figure 43: Europe Starch Derivatives Market Revenue (Million), by Source 2024 & 2032
- Figure 44: Europe Starch Derivatives Market Volume (K Tons), by Source 2024 & 2032
- Figure 45: Europe Starch Derivatives Market Revenue Share (%), by Source 2024 & 2032
- Figure 46: Europe Starch Derivatives Market Volume Share (%), by Source 2024 & 2032
- Figure 47: Europe Starch Derivatives Market Revenue (Million), by Application 2024 & 2032
- Figure 48: Europe Starch Derivatives Market Volume (K Tons), by Application 2024 & 2032
- Figure 49: Europe Starch Derivatives Market Revenue Share (%), by Application 2024 & 2032
- Figure 50: Europe Starch Derivatives Market Volume Share (%), by Application 2024 & 2032
- Figure 51: Europe Starch Derivatives Market Revenue (Million), by Country 2024 & 2032
- Figure 52: Europe Starch Derivatives Market Volume (K Tons), by Country 2024 & 2032
- Figure 53: Europe Starch Derivatives Market Revenue Share (%), by Country 2024 & 2032
- Figure 54: Europe Starch Derivatives Market Volume Share (%), by Country 2024 & 2032
- Figure 55: Asia Pacific Starch Derivatives Market Revenue (Million), by Type 2024 & 2032
- Figure 56: Asia Pacific Starch Derivatives Market Volume (K Tons), by Type 2024 & 2032
- Figure 57: Asia Pacific Starch Derivatives Market Revenue Share (%), by Type 2024 & 2032
- Figure 58: Asia Pacific Starch Derivatives Market Volume Share (%), by Type 2024 & 2032
- Figure 59: Asia Pacific Starch Derivatives Market Revenue (Million), by Source 2024 & 2032
- Figure 60: Asia Pacific Starch Derivatives Market Volume (K Tons), by Source 2024 & 2032
- Figure 61: Asia Pacific Starch Derivatives Market Revenue Share (%), by Source 2024 & 2032
- Figure 62: Asia Pacific Starch Derivatives Market Volume Share (%), by Source 2024 & 2032
- Figure 63: Asia Pacific Starch Derivatives Market Revenue (Million), by Application 2024 & 2032
- Figure 64: Asia Pacific Starch Derivatives Market Volume (K Tons), by Application 2024 & 2032
- Figure 65: Asia Pacific Starch Derivatives Market Revenue Share (%), by Application 2024 & 2032
- Figure 66: Asia Pacific Starch Derivatives Market Volume Share (%), by Application 2024 & 2032
- Figure 67: Asia Pacific Starch Derivatives Market Revenue (Million), by Country 2024 & 2032
- Figure 68: Asia Pacific Starch Derivatives Market Volume (K Tons), by Country 2024 & 2032
- Figure 69: Asia Pacific Starch Derivatives Market Revenue Share (%), by Country 2024 & 2032
- Figure 70: Asia Pacific Starch Derivatives Market Volume Share (%), by Country 2024 & 2032
- Figure 71: South America Starch Derivatives Market Revenue (Million), by Type 2024 & 2032
- Figure 72: South America Starch Derivatives Market Volume (K Tons), by Type 2024 & 2032
- Figure 73: South America Starch Derivatives Market Revenue Share (%), by Type 2024 & 2032
- Figure 74: South America Starch Derivatives Market Volume Share (%), by Type 2024 & 2032
- Figure 75: South America Starch Derivatives Market Revenue (Million), by Source 2024 & 2032
- Figure 76: South America Starch Derivatives Market Volume (K Tons), by Source 2024 & 2032
- Figure 77: South America Starch Derivatives Market Revenue Share (%), by Source 2024 & 2032
- Figure 78: South America Starch Derivatives Market Volume Share (%), by Source 2024 & 2032
- Figure 79: South America Starch Derivatives Market Revenue (Million), by Application 2024 & 2032
- Figure 80: South America Starch Derivatives Market Volume (K Tons), by Application 2024 & 2032
- Figure 81: South America Starch Derivatives Market Revenue Share (%), by Application 2024 & 2032
- Figure 82: South America Starch Derivatives Market Volume Share (%), by Application 2024 & 2032
- Figure 83: South America Starch Derivatives Market Revenue (Million), by Country 2024 & 2032
- Figure 84: South America Starch Derivatives Market Volume (K Tons), by Country 2024 & 2032
- Figure 85: South America Starch Derivatives Market Revenue Share (%), by Country 2024 & 2032
- Figure 86: South America Starch Derivatives Market Volume Share (%), by Country 2024 & 2032
- Figure 87: Middle East and Africa Starch Derivatives Market Revenue (Million), by Type 2024 & 2032
- Figure 88: Middle East and Africa Starch Derivatives Market Volume (K Tons), by Type 2024 & 2032
- Figure 89: Middle East and Africa Starch Derivatives Market Revenue Share (%), by Type 2024 & 2032
- Figure 90: Middle East and Africa Starch Derivatives Market Volume Share (%), by Type 2024 & 2032
- Figure 91: Middle East and Africa Starch Derivatives Market Revenue (Million), by Source 2024 & 2032
- Figure 92: Middle East and Africa Starch Derivatives Market Volume (K Tons), by Source 2024 & 2032
- Figure 93: Middle East and Africa Starch Derivatives Market Revenue Share (%), by Source 2024 & 2032
- Figure 94: Middle East and Africa Starch Derivatives Market Volume Share (%), by Source 2024 & 2032
- Figure 95: Middle East and Africa Starch Derivatives Market Revenue (Million), by Application 2024 & 2032
- Figure 96: Middle East and Africa Starch Derivatives Market Volume (K Tons), by Application 2024 & 2032
- Figure 97: Middle East and Africa Starch Derivatives Market Revenue Share (%), by Application 2024 & 2032
- Figure 98: Middle East and Africa Starch Derivatives Market Volume Share (%), by Application 2024 & 2032
- Figure 99: Middle East and Africa Starch Derivatives Market Revenue (Million), by Country 2024 & 2032
- Figure 100: Middle East and Africa Starch Derivatives Market Volume (K Tons), by Country 2024 & 2032
- Figure 101: Middle East and Africa Starch Derivatives Market Revenue Share (%), by Country 2024 & 2032
- Figure 102: Middle East and Africa Starch Derivatives Market Volume Share (%), by Country 2024 & 2032
List of Tables
- Table 1: Global Starch Derivatives Market Revenue Million Forecast, by Region 2019 & 2032
- Table 2: Global Starch Derivatives Market Volume K Tons Forecast, by Region 2019 & 2032
- Table 3: Global Starch Derivatives Market Revenue Million Forecast, by Type 2019 & 2032
- Table 4: Global Starch Derivatives Market Volume K Tons Forecast, by Type 2019 & 2032
- Table 5: Global Starch Derivatives Market Revenue Million Forecast, by Source 2019 & 2032
- Table 6: Global Starch Derivatives Market Volume K Tons Forecast, by Source 2019 & 2032
- Table 7: Global Starch Derivatives Market Revenue Million Forecast, by Application 2019 & 2032
- Table 8: Global Starch Derivatives Market Volume K Tons Forecast, by Application 2019 & 2032
- Table 9: Global Starch Derivatives Market Revenue Million Forecast, by Region 2019 & 2032
- Table 10: Global Starch Derivatives Market Volume K Tons Forecast, by Region 2019 & 2032
- Table 11: Global Starch Derivatives Market Revenue Million Forecast, by Country 2019 & 2032
- Table 12: Global Starch Derivatives Market Volume K Tons Forecast, by Country 2019 & 2032
- Table 13: United States Starch Derivatives Market Revenue (Million) Forecast, by Application 2019 & 2032
- Table 14: United States Starch Derivatives Market Volume (K Tons) Forecast, by Application 2019 & 2032
- Table 15: Canada Starch Derivatives Market Revenue (Million) Forecast, by Application 2019 & 2032
- Table 16: Canada Starch Derivatives Market Volume (K Tons) Forecast, by Application 2019 & 2032
- Table 17: Mexico Starch Derivatives Market Revenue (Million) Forecast, by Application 2019 & 2032
- Table 18: Mexico Starch Derivatives Market Volume (K Tons) Forecast, by Application 2019 & 2032
- Table 19: Rest of North America Starch Derivatives Market Revenue (Million) Forecast, by Application 2019 & 2032
- Table 20: Rest of North America Starch Derivatives Market Volume (K Tons) Forecast, by Application 2019 & 2032
- Table 21: Global Starch Derivatives Market Revenue Million Forecast, by Country 2019 & 2032
- Table 22: Global Starch Derivatives Market Volume K Tons Forecast, by Country 2019 & 2032
- Table 23: Spain Starch Derivatives Market Revenue (Million) Forecast, by Application 2019 & 2032
- Table 24: Spain Starch Derivatives Market Volume (K Tons) Forecast, by Application 2019 & 2032
- Table 25: United Kingdom Starch Derivatives Market Revenue (Million) Forecast, by Application 2019 & 2032
- Table 26: United Kingdom Starch Derivatives Market Volume (K Tons) Forecast, by Application 2019 & 2032
- Table 27: France Starch Derivatives Market Revenue (Million) Forecast, by Application 2019 & 2032
- Table 28: France Starch Derivatives Market Volume (K Tons) Forecast, by Application 2019 & 2032
- Table 29: Germany Starch Derivatives Market Revenue (Million) Forecast, by Application 2019 & 2032
- Table 30: Germany Starch Derivatives Market Volume (K Tons) Forecast, by Application 2019 & 2032
- Table 31: Russia Starch Derivatives Market Revenue (Million) Forecast, by Application 2019 & 2032
- Table 32: Russia Starch Derivatives Market Volume (K Tons) Forecast, by Application 2019 & 2032
- Table 33: Italy Starch Derivatives Market Revenue (Million) Forecast, by Application 2019 & 2032
- Table 34: Italy Starch Derivatives Market Volume (K Tons) Forecast, by Application 2019 & 2032
- Table 35: Rest of Europe Starch Derivatives Market Revenue (Million) Forecast, by Application 2019 & 2032
- Table 36: Rest of Europe Starch Derivatives Market Volume (K Tons) Forecast, by Application 2019 & 2032
- Table 37: Global Starch Derivatives Market Revenue Million Forecast, by Country 2019 & 2032
- Table 38: Global Starch Derivatives Market Volume K Tons Forecast, by Country 2019 & 2032
- Table 39: China Starch Derivatives Market Revenue (Million) Forecast, by Application 2019 & 2032
- Table 40: China Starch Derivatives Market Volume (K Tons) Forecast, by Application 2019 & 2032
- Table 41: Japan Starch Derivatives Market Revenue (Million) Forecast, by Application 2019 & 2032
- Table 42: Japan Starch Derivatives Market Volume (K Tons) Forecast, by Application 2019 & 2032
- Table 43: India Starch Derivatives Market Revenue (Million) Forecast, by Application 2019 & 2032
- Table 44: India Starch Derivatives Market Volume (K Tons) Forecast, by Application 2019 & 2032
- Table 45: Singapore Starch Derivatives Market Revenue (Million) Forecast, by Application 2019 & 2032
- Table 46: Singapore Starch Derivatives Market Volume (K Tons) Forecast, by Application 2019 & 2032
- Table 47: Australia Starch Derivatives Market Revenue (Million) Forecast, by Application 2019 & 2032
- Table 48: Australia Starch Derivatives Market Volume (K Tons) Forecast, by Application 2019 & 2032
- Table 49: Rest of Asia Pacific Starch Derivatives Market Revenue (Million) Forecast, by Application 2019 & 2032
- Table 50: Rest of Asia Pacific Starch Derivatives Market Volume (K Tons) Forecast, by Application 2019 & 2032
- Table 51: Global Starch Derivatives Market Revenue Million Forecast, by Country 2019 & 2032
- Table 52: Global Starch Derivatives Market Volume K Tons Forecast, by Country 2019 & 2032
- Table 53: Brazil Starch Derivatives Market Revenue (Million) Forecast, by Application 2019 & 2032
- Table 54: Brazil Starch Derivatives Market Volume (K Tons) Forecast, by Application 2019 & 2032
- Table 55: Argentina Starch Derivatives Market Revenue (Million) Forecast, by Application 2019 & 2032
- Table 56: Argentina Starch Derivatives Market Volume (K Tons) Forecast, by Application 2019 & 2032
- Table 57: Rest of South America Starch Derivatives Market Revenue (Million) Forecast, by Application 2019 & 2032
- Table 58: Rest of South America Starch Derivatives Market Volume (K Tons) Forecast, by Application 2019 & 2032
- Table 59: Global Starch Derivatives Market Revenue Million Forecast, by Country 2019 & 2032
- Table 60: Global Starch Derivatives Market Volume K Tons Forecast, by Country 2019 & 2032
- Table 61: South Africa Starch Derivatives Market Revenue (Million) Forecast, by Application 2019 & 2032
- Table 62: South Africa Starch Derivatives Market Volume (K Tons) Forecast, by Application 2019 & 2032
- Table 63: United Arab Emirates Starch Derivatives Market Revenue (Million) Forecast, by Application 2019 & 2032
- Table 64: United Arab Emirates Starch Derivatives Market Volume (K Tons) Forecast, by Application 2019 & 2032
- Table 65: Saudi Arabia Starch Derivatives Market Revenue (Million) Forecast, by Application 2019 & 2032
- Table 66: Saudi Arabia Starch Derivatives Market Volume (K Tons) Forecast, by Application 2019 & 2032
- Table 67: Rest of Middle East Starch Derivatives Market Revenue (Million) Forecast, by Application 2019 & 2032
- Table 68: Rest of Middle East Starch Derivatives Market Volume (K Tons) Forecast, by Application 2019 & 2032
- Table 69: Global Starch Derivatives Market Revenue Million Forecast, by Type 2019 & 2032
- Table 70: Global Starch Derivatives Market Volume K Tons Forecast, by Type 2019 & 2032
- Table 71: Global Starch Derivatives Market Revenue Million Forecast, by Source 2019 & 2032
- Table 72: Global Starch Derivatives Market Volume K Tons Forecast, by Source 2019 & 2032
- Table 73: Global Starch Derivatives Market Revenue Million Forecast, by Application 2019 & 2032
- Table 74: Global Starch Derivatives Market Volume K Tons Forecast, by Application 2019 & 2032
- Table 75: Global Starch Derivatives Market Revenue Million Forecast, by Country 2019 & 2032
- Table 76: Global Starch Derivatives Market Volume K Tons Forecast, by Country 2019 & 2032
- Table 77: United States Starch Derivatives Market Revenue (Million) Forecast, by Application 2019 & 2032
- Table 78: United States Starch Derivatives Market Volume (K Tons) Forecast, by Application 2019 & 2032
- Table 79: Canada Starch Derivatives Market Revenue (Million) Forecast, by Application 2019 & 2032
- Table 80: Canada Starch Derivatives Market Volume (K Tons) Forecast, by Application 2019 & 2032
- Table 81: Mexico Starch Derivatives Market Revenue (Million) Forecast, by Application 2019 & 2032
- Table 82: Mexico Starch Derivatives Market Volume (K Tons) Forecast, by Application 2019 & 2032
- Table 83: Rest of North America Starch Derivatives Market Revenue (Million) Forecast, by Application 2019 & 2032
- Table 84: Rest of North America Starch Derivatives Market Volume (K Tons) Forecast, by Application 2019 & 2032
- Table 85: Global Starch Derivatives Market Revenue Million Forecast, by Type 2019 & 2032
- Table 86: Global Starch Derivatives Market Volume K Tons Forecast, by Type 2019 & 2032
- Table 87: Global Starch Derivatives Market Revenue Million Forecast, by Source 2019 & 2032
- Table 88: Global Starch Derivatives Market Volume K Tons Forecast, by Source 2019 & 2032
- Table 89: Global Starch Derivatives Market Revenue Million Forecast, by Application 2019 & 2032
- Table 90: Global Starch Derivatives Market Volume K Tons Forecast, by Application 2019 & 2032
- Table 91: Global Starch Derivatives Market Revenue Million Forecast, by Country 2019 & 2032
- Table 92: Global Starch Derivatives Market Volume K Tons Forecast, by Country 2019 & 2032
- Table 93: Spain Starch Derivatives Market Revenue (Million) Forecast, by Application 2019 & 2032
- Table 94: Spain Starch Derivatives Market Volume (K Tons) Forecast, by Application 2019 & 2032
- Table 95: United Kingdom Starch Derivatives Market Revenue (Million) Forecast, by Application 2019 & 2032
- Table 96: United Kingdom Starch Derivatives Market Volume (K Tons) Forecast, by Application 2019 & 2032
- Table 97: France Starch Derivatives Market Revenue (Million) Forecast, by Application 2019 & 2032
- Table 98: France Starch Derivatives Market Volume (K Tons) Forecast, by Application 2019 & 2032
- Table 99: Germany Starch Derivatives Market Revenue (Million) Forecast, by Application 2019 & 2032
- Table 100: Germany Starch Derivatives Market Volume (K Tons) Forecast, by Application 2019 & 2032
- Table 101: Russia Starch Derivatives Market Revenue (Million) Forecast, by Application 2019 & 2032
- Table 102: Russia Starch Derivatives Market Volume (K Tons) Forecast, by Application 2019 & 2032
- Table 103: Italy Starch Derivatives Market Revenue (Million) Forecast, by Application 2019 & 2032
- Table 104: Italy Starch Derivatives Market Volume (K Tons) Forecast, by Application 2019 & 2032
- Table 105: Rest of Europe Starch Derivatives Market Revenue (Million) Forecast, by Application 2019 & 2032
- Table 106: Rest of Europe Starch Derivatives Market Volume (K Tons) Forecast, by Application 2019 & 2032
- Table 107: Global Starch Derivatives Market Revenue Million Forecast, by Type 2019 & 2032
- Table 108: Global Starch Derivatives Market Volume K Tons Forecast, by Type 2019 & 2032
- Table 109: Global Starch Derivatives Market Revenue Million Forecast, by Source 2019 & 2032
- Table 110: Global Starch Derivatives Market Volume K Tons Forecast, by Source 2019 & 2032
- Table 111: Global Starch Derivatives Market Revenue Million Forecast, by Application 2019 & 2032
- Table 112: Global Starch Derivatives Market Volume K Tons Forecast, by Application 2019 & 2032
- Table 113: Global Starch Derivatives Market Revenue Million Forecast, by Country 2019 & 2032
- Table 114: Global Starch Derivatives Market Volume K Tons Forecast, by Country 2019 & 2032
- Table 115: China Starch Derivatives Market Revenue (Million) Forecast, by Application 2019 & 2032
- Table 116: China Starch Derivatives Market Volume (K Tons) Forecast, by Application 2019 & 2032
- Table 117: Japan Starch Derivatives Market Revenue (Million) Forecast, by Application 2019 & 2032
- Table 118: Japan Starch Derivatives Market Volume (K Tons) Forecast, by Application 2019 & 2032
- Table 119: India Starch Derivatives Market Revenue (Million) Forecast, by Application 2019 & 2032
- Table 120: India Starch Derivatives Market Volume (K Tons) Forecast, by Application 2019 & 2032
- Table 121: Singapore Starch Derivatives Market Revenue (Million) Forecast, by Application 2019 & 2032
- Table 122: Singapore Starch Derivatives Market Volume (K Tons) Forecast, by Application 2019 & 2032
- Table 123: Australia Starch Derivatives Market Revenue (Million) Forecast, by Application 2019 & 2032
- Table 124: Australia Starch Derivatives Market Volume (K Tons) Forecast, by Application 2019 & 2032
- Table 125: Rest of Asia Pacific Starch Derivatives Market Revenue (Million) Forecast, by Application 2019 & 2032
- Table 126: Rest of Asia Pacific Starch Derivatives Market Volume (K Tons) Forecast, by Application 2019 & 2032
- Table 127: Global Starch Derivatives Market Revenue Million Forecast, by Type 2019 & 2032
- Table 128: Global Starch Derivatives Market Volume K Tons Forecast, by Type 2019 & 2032
- Table 129: Global Starch Derivatives Market Revenue Million Forecast, by Source 2019 & 2032
- Table 130: Global Starch Derivatives Market Volume K Tons Forecast, by Source 2019 & 2032
- Table 131: Global Starch Derivatives Market Revenue Million Forecast, by Application 2019 & 2032
- Table 132: Global Starch Derivatives Market Volume K Tons Forecast, by Application 2019 & 2032
- Table 133: Global Starch Derivatives Market Revenue Million Forecast, by Country 2019 & 2032
- Table 134: Global Starch Derivatives Market Volume K Tons Forecast, by Country 2019 & 2032
- Table 135: Brazil Starch Derivatives Market Revenue (Million) Forecast, by Application 2019 & 2032
- Table 136: Brazil Starch Derivatives Market Volume (K Tons) Forecast, by Application 2019 & 2032
- Table 137: Argentina Starch Derivatives Market Revenue (Million) Forecast, by Application 2019 & 2032
- Table 138: Argentina Starch Derivatives Market Volume (K Tons) Forecast, by Application 2019 & 2032
- Table 139: Rest of South America Starch Derivatives Market Revenue (Million) Forecast, by Application 2019 & 2032
- Table 140: Rest of South America Starch Derivatives Market Volume (K Tons) Forecast, by Application 2019 & 2032
- Table 141: Global Starch Derivatives Market Revenue Million Forecast, by Type 2019 & 2032
- Table 142: Global Starch Derivatives Market Volume K Tons Forecast, by Type 2019 & 2032
- Table 143: Global Starch Derivatives Market Revenue Million Forecast, by Source 2019 & 2032
- Table 144: Global Starch Derivatives Market Volume K Tons Forecast, by Source 2019 & 2032
- Table 145: Global Starch Derivatives Market Revenue Million Forecast, by Application 2019 & 2032
- Table 146: Global Starch Derivatives Market Volume K Tons Forecast, by Application 2019 & 2032
- Table 147: Global Starch Derivatives Market Revenue Million Forecast, by Country 2019 & 2032
- Table 148: Global Starch Derivatives Market Volume K Tons Forecast, by Country 2019 & 2032
- Table 149: South Africa Starch Derivatives Market Revenue (Million) Forecast, by Application 2019 & 2032
- Table 150: South Africa Starch Derivatives Market Volume (K Tons) Forecast, by Application 2019 & 2032
- Table 151: United Arab Emirates Starch Derivatives Market Revenue (Million) Forecast, by Application 2019 & 2032
- Table 152: United Arab Emirates Starch Derivatives Market Volume (K Tons) Forecast, by Application 2019 & 2032
- Table 153: Saudi Arabia Starch Derivatives Market Revenue (Million) Forecast, by Application 2019 & 2032
- Table 154: Saudi Arabia Starch Derivatives Market Volume (K Tons) Forecast, by Application 2019 & 2032
- Table 155: Rest of Middle East Starch Derivatives Market Revenue (Million) Forecast, by Application 2019 & 2032
- Table 156: Rest of Middle East Starch Derivatives Market Volume (K Tons) Forecast, by Application 2019 & 2032
Frequently Asked Questions
1. What is the projected Compound Annual Growth Rate (CAGR) of the Starch Derivatives Market?
The projected CAGR is approximately 6.40%.
2. Which companies are prominent players in the Starch Derivatives Market?
Key companies in the market include Cargill Incorporated, Archer Daniels Midland Company, Roquette, Tate & Lyle PLC, Royal Avebe U A (Avebe Nutrition), Tereos S A*List Not Exhaustive, Ingredion Incorporated, Beneo, Cumberland Packing Corp, Glycom.
3. What are the main segments of the Starch Derivatives Market?
The market segments include Type, Source, Application.
4. Can you provide details about the market size?
The market size is estimated to be USD 55700 Million as of 2022.
5. What are some drivers contributing to market growth?
Inclination Towards Fitness and Increasing Intake of Plant-based Protein; Increase in Consumer Inclination Towards Meat Substitutes.
6. What are the notable trends driving market growth?
Modified Starch is Strongly Accelerating the Overall Market For Starch Derivatives.
7. Are there any restraints impacting market growth?
Gluten-Intolerance Among the Population Hindering the Market.
8. Can you provide examples of recent developments in the market?
Cargill's investment in new starch processing facilities to meet growing demand
9. What pricing options are available for accessing the report?
Pricing options include single-user, multi-user, and enterprise licenses priced at USD 4750, USD 5250, and USD 8750 respectively.
10. Is the market size provided in terms of value or volume?
The market size is provided in terms of value, measured in Million and volume, measured in K Tons.
11. Are there any specific market keywords associated with the report?
Yes, the market keyword associated with the report is "Starch Derivatives Market," which aids in identifying and referencing the specific market segment covered.
12. How do I determine which pricing option suits my needs best?
The pricing options vary based on user requirements and access needs. Individual users may opt for single-user licenses, while businesses requiring broader access may choose multi-user or enterprise licenses for cost-effective access to the report.
13. Are there any additional resources or data provided in the Starch Derivatives Market report?
While the report offers comprehensive insights, it's advisable to review the specific contents or supplementary materials provided to ascertain if additional resources or data are available.
14. How can I stay updated on further developments or reports in the Starch Derivatives Market?
To stay informed about further developments, trends, and reports in the Starch Derivatives Market, consider subscribing to industry newsletters, following relevant companies and organizations, or regularly checking reputable industry news sources and publications.
Methodology
Step 1 - Identification of Relevant Samples Size from Population Database


Step 2 - Approaches for Defining Global Market Size (Value, Volume* & Price*)

Note*: In applicable scenarios
Step 3 - Data Sources
Primary Research
- Web Analytics
- Survey Reports
- Research Institute
- Latest Research Reports
- Opinion Leaders
Secondary Research
- Annual Reports
- White Paper
- Latest Press Release
- Industry Association
- Paid Database
- Investor Presentations

Step 4 - Data Triangulation
Involves using different sources of information in order to increase the validity of a study
These sources are likely to be stakeholders in a program - participants, other researchers, program staff, other community members, and so on.
Then we put all data in single framework & apply various statistical tools to find out the dynamic on the market.
During the analysis stage, feedback from the stakeholder groups would be compared to determine areas of agreement as well as areas of divergence


