
Key Insights
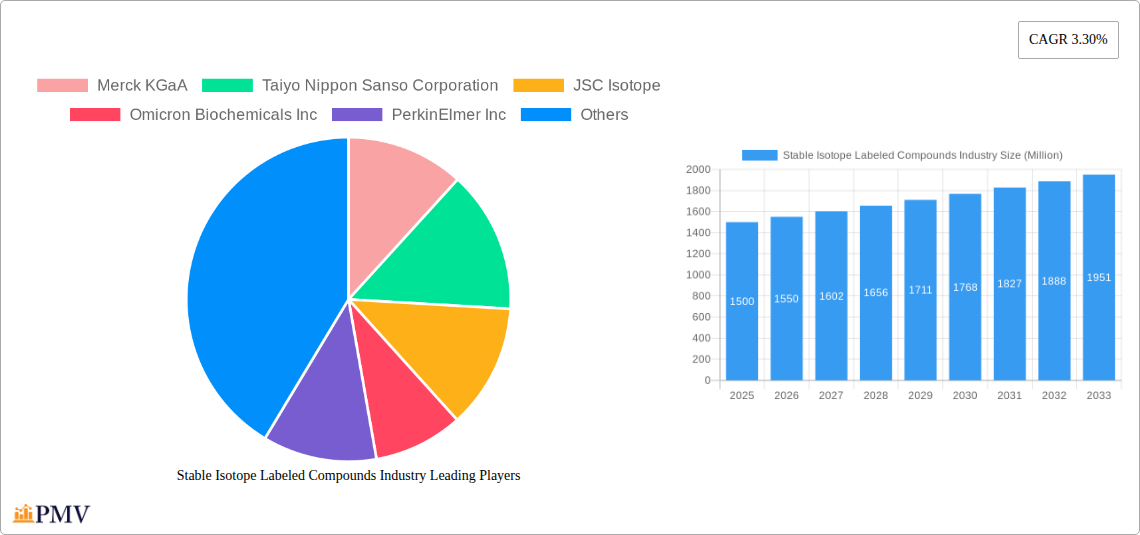
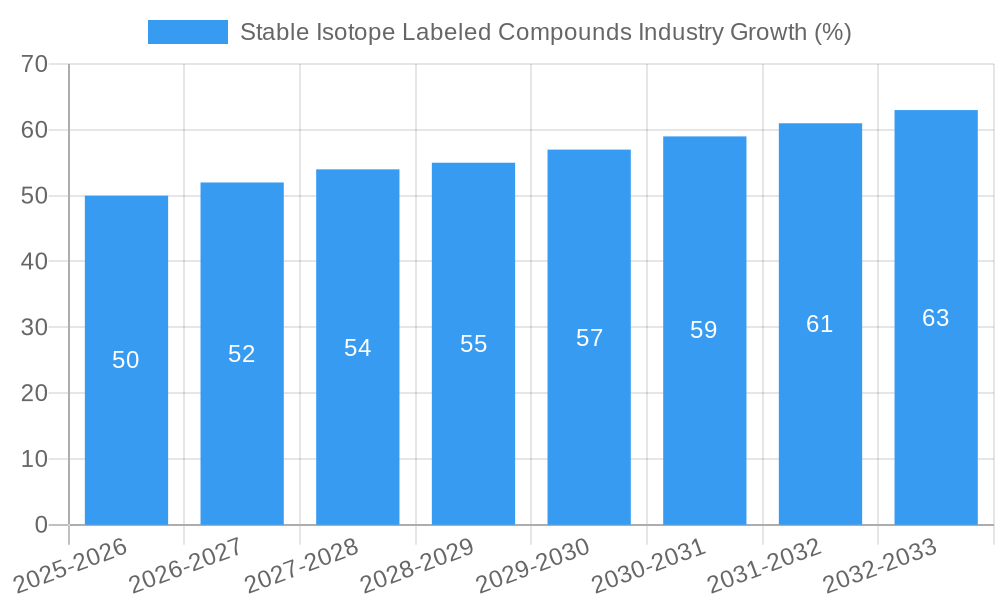
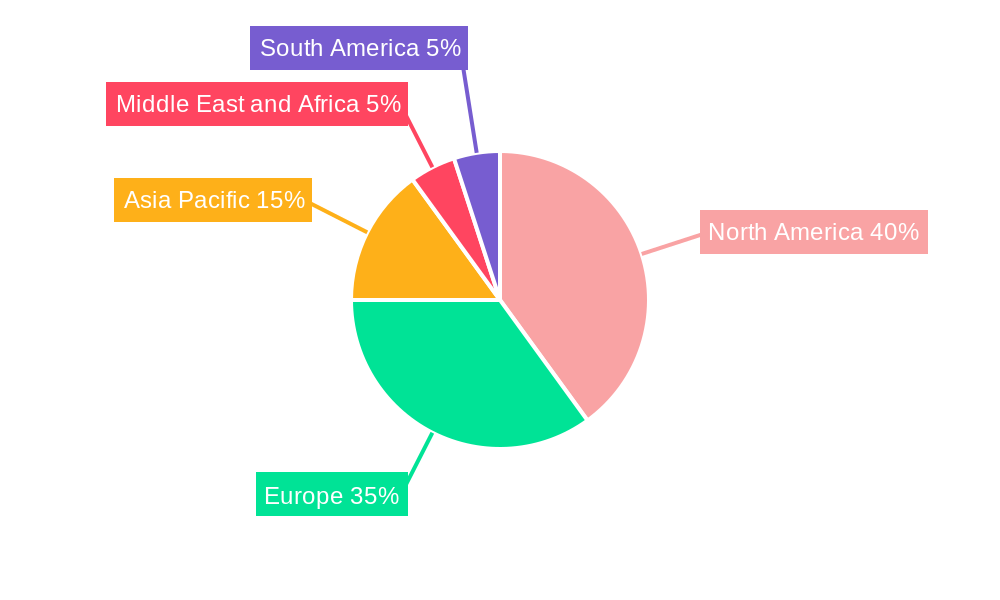
The global stable isotope labeled compounds market is experiencing steady growth, projected to reach a substantial size within the forecast period of 2025-2033. A compound annual growth rate (CAGR) of 3.30% indicates a consistent expansion driven by several key factors. The increasing demand for these compounds in research and development, particularly in life sciences and pharmaceutical research, is a significant driver. Advances in analytical techniques like mass spectrometry and nuclear magnetic resonance (NMR) spectroscopy further fuel market growth by enabling more sophisticated and accurate isotopic labeling studies. The burgeoning clinical diagnostics sector also contributes significantly, as stable isotopes are increasingly used in diagnostic imaging and metabolic studies. While the market faces some restraints like high production costs and stringent regulatory requirements, the overall outlook remains positive. The market segmentation reveals that deuterium-labeled compounds currently hold the largest market share by type, followed by carbon-labeled compounds, reflecting their wide applications in various research areas. Geographically, North America and Europe are currently the leading regions, but Asia-Pacific is anticipated to show significant growth in the coming years due to rising investments in research infrastructure and pharmaceutical industries within countries like China and India. The competitive landscape includes both large multinational corporations and specialized niche players, ensuring a dynamic and innovative environment.
The market's growth trajectory suggests continuous expansion across all segments. The increasing focus on personalized medicine and the development of targeted therapies further boosts demand. Further development of innovative applications of stable isotopes in areas like environmental monitoring and materials science will also contribute to the overall growth of the market. While the high cost of production and regulatory hurdles remain challenges, the industry's focus on process optimization and the development of more efficient synthesis methods are expected to mitigate these constraints. Furthermore, collaborations between research institutions, pharmaceutical companies, and isotope suppliers will fuel innovation and accelerate market growth. The continued expansion of the healthcare sector and the growing emphasis on scientific research globally promise a sustained demand for stable isotope labeled compounds in the long term.
Stable Isotope Labeled Compounds Industry: Comprehensive Market Report 2019-2033
This in-depth report provides a comprehensive analysis of the Stable Isotope Labeled Compounds industry, offering invaluable insights for stakeholders across the value chain. Covering the period 2019-2033, with a focus on 2025, this report meticulously examines market dynamics, competitive landscapes, and future growth trajectories. The global market is projected to reach xx Million by 2033, exhibiting a CAGR of xx% during the forecast period (2025-2033).
Stable Isotope Labeled Compounds Industry Market Structure & Competitive Dynamics
The Stable Isotope Labeled Compounds market exhibits a moderately concentrated structure, with key players such as Merck KGaA, Taiyo Nippon Sanso Corporation, and Cambridge Isotope Laboratories Inc. holding significant market share. The industry is characterized by a dynamic innovation ecosystem, driven by advancements in isotopic enrichment technologies and expanding applications in research and clinical diagnostics. Regulatory frameworks, varying across regions, significantly influence market access and product development. Product substitutes, while limited, exist in specific niche applications. End-user trends, particularly the increasing demand for stable isotope-labeled compounds in advanced research and personalized medicine, are shaping market growth.
M&A activities have played a role in shaping the competitive landscape. While precise deal values are not publicly disclosed for all transactions, several significant acquisitions have occurred, consolidating market share and enhancing technological capabilities. For example, the partnership between Cambridge Isotope Laboratories Inc. and ISOtopic Solutions signifies a strategic move to broaden product portfolios and expand market reach. The market share of the top 5 players is estimated at xx% in 2025. Further consolidation is anticipated in the coming years.
Stable Isotope Labeled Compounds Industry Industry Trends & Insights
The Stable Isotope Labeled Compounds market is experiencing robust growth, propelled by several key factors. The rising prevalence of chronic diseases, fueling demand for advanced diagnostic tools and therapeutic development, is a primary driver. Technological advancements, such as improved isotopic enrichment techniques and the development of novel labeling methods, are enhancing the efficiency and affordability of stable isotope-labeled compounds. The growing adoption of stable isotope labeling in various research applications, including metabolomics and proteomics, is further driving market expansion. Consumer preferences are shifting towards high-quality, reliable, and customizable stable isotope labeled compounds, stimulating innovation and competition. The market exhibits a strong competitive landscape, with established players and emerging companies vying for market share through product innovation and strategic partnerships. The global market size is anticipated to reach xx Million by 2033, exhibiting robust growth.
Dominant Markets & Segments in Stable Isotope Labeled Compounds Industry
The North American region currently dominates the Stable Isotope Labeled Compounds market, driven by significant investments in research and development, a well-established healthcare infrastructure, and favorable regulatory policies. Within the type segments, Deuterium and Carbon-labeled compounds hold the largest market share due to their widespread use in diverse applications. The Research and Development segment constitutes the largest application area, fueled by the increasing adoption of stable isotopes in various scientific endeavors.
Key Drivers for North American Dominance:
- Robust R&D funding and infrastructure
- Stringent regulatory frameworks promoting innovation
- High healthcare expenditure and advanced medical facilities
- Strong presence of key market players
Key Drivers for Deuterium and Carbon-labeled Compounds:
- Versatile applications in various research areas
- Established manufacturing capabilities and readily available supply chains
- Cost-effectiveness compared to other stable isotopes
Key Drivers for the Research and Development Segment:
- Growing investments in scientific research across diverse disciplines
- Increased demand for advanced analytical tools and techniques
- Expanding applications in drug discovery and development
Stable Isotope Labeled Compounds Industry Product Innovations
Recent product innovations focus on enhancing the purity, stability, and specificity of stable isotope-labeled compounds. This involves developing new synthesis methods, improving isotopic enrichment techniques, and expanding the range of available compounds to meet diverse research and clinical needs. The emphasis is on developing custom-labeled compounds tailored to specific research requirements, expanding applications into novel areas, and improving cost-effectiveness. These innovations address market demands for higher-quality products and expanded capabilities, offering significant competitive advantages.
Report Segmentation & Scope
The report segments the Stable Isotope Labeled Compounds market by Type: Deuterium, Carbon-, Oxygen-, and Other Stable Isotopes. Each segment displays unique growth characteristics and competitive dynamics. The Deuterium segment holds the largest market share due to its wide use in various fields. The Carbon-labeled compounds segment shows strong growth, due to its use in metabolic studies and drug development. The Oxygen-labeled segment has a smaller market size but displays promising growth potential. The “Other Stable Isotopes” category includes Nitrogen-15, Sulfur-34, etc., with growing demand across various research and clinical applications.
The report also segments the market by Application: Research and Development, Clinical Diagnostics, and Other Applications. The Research and Development segment is the most substantial, representing a significant portion of the overall market size. Clinical Diagnostics is a rapidly expanding segment, driven by the increasing use of stable isotopes in diagnostic imaging and biomarker analysis. The "Other Applications" segment includes industrial and environmental applications.
Key Drivers of Stable Isotope Labeled Compounds Industry Growth
Several factors are driving the growth of the Stable Isotope Labeled Compounds market. Technological advancements in isotopic enrichment and labeling techniques are leading to higher purity, better yields, and reduced costs. The expanding use of stable isotopes in diverse fields, including drug discovery, metabolic research, and clinical diagnostics, is significantly impacting market growth. Furthermore, supportive government policies and increasing research funding are facilitating market expansion. The growing awareness of the benefits of stable isotope labeled compounds in various applications is also creating higher demand.
Challenges in the Stable Isotope Labeled Compounds Industry Sector
Despite the promising growth outlook, the Stable Isotope Labeled Compounds industry faces challenges. Supply chain disruptions and fluctuating raw material prices can impact production costs and availability. Stringent regulatory approvals and quality control requirements can hinder market entry and increase development costs. Competition from alternative labeling techniques and emerging technologies also poses a challenge. The high cost associated with isotopic enrichment and purification limits market access for some applications.
Leading Players in the Stable Isotope Labeled Compounds Industry Market
- Merck KGaA
- Taiyo Nippon Sanso Corporation
- JSC Isotope
- Omicron Biochemicals Inc
- PerkinElmer Inc
- Cambridge Isotope Laboratories Inc
- Medical Isotopes Inc
- Trace Sciences International
- Alsachim
Key Developments in Stable Isotope Labeled Compounds Industry Sector
Oct 2022: ORNL announced its contribution to building new facilities to make isotopes used in medical treatments and many other fields. The US Stable Isotope Production and Research Center will enrich stable isotopes used for cancer treatments, heart disease treatments, and space exploration. This development signifies a major investment in expanding the production capacity of stable isotopes, potentially reducing costs and enhancing accessibility.
Sept 2022: Cambridge Isotope Laboratories Inc. (CIL) partnered with ISOtopic Solutions to release the new stable isotope-labeled and unlabeled Crude Lipid Yeast Extract. This partnership expands product offerings and market reach, enhancing the availability of essential research tools.
Strategic Stable Isotope Labeled Compounds Industry Market Outlook
The future of the Stable Isotope Labeled Compounds market is bright, driven by continued technological advancements, expanding applications in personalized medicine, and growing investments in research and development. Strategic opportunities exist in developing novel labeling methods, expanding into niche applications, and creating customized solutions to meet specific research and clinical needs. Furthermore, strategic partnerships and collaborations can facilitate market expansion and enhance competitiveness. Companies focusing on innovation and adapting to evolving market needs are well-positioned for success in this dynamic and rapidly growing industry.
Stable Isotope Labeled Compounds Industry Segmentation
-
1. Type
- 1.1. Deuterium
- 1.2. Carbon-13
- 1.3. Oxygen-18
- 1.4. Other Stable Isotopes
-
2. Application
- 2.1. Research and Development
- 2.2. Clinical Diagnostics
- 2.3. Other Applications
Stable Isotope Labeled Compounds Industry Segmentation By Geography
-
1. North America
- 1.1. United States
- 1.2. Canada
- 1.3. Mexico
-
2. Europe
- 2.1. Germany
- 2.2. United Kingdom
- 2.3. France
- 2.4. Italy
- 2.5. Spain
- 2.6. Rest of Europe
-
3. Asia Pacific
- 3.1. China
- 3.2. Japan
- 3.3. India
- 3.4. Australia
- 3.5. South Korea
- 3.6. Rest of Asia Pacific
-
4. Middle East and Africa
- 4.1. GCC
- 4.2. South Africa
- 4.3. Rest of Middle East and Africa
-
5. South America
- 5.1. Brazil
- 5.2. Argentina
- 5.3. Rest of South America
Stable Isotope Labeled Compounds Industry REPORT HIGHLIGHTS
| Aspects | Details |
|---|---|
| Study Period | 2019-2033 |
| Base Year | 2024 |
| Estimated Year | 2025 |
| Forecast Period | 2025-2033 |
| Historical Period | 2019-2024 |
| Growth Rate | CAGR of 3.30% from 2019-2033 |
| Segmentation |
|
Table of Contents
- 1. Introduction
- 1.1. Research Scope
- 1.2. Market Segmentation
- 1.3. Research Methodology
- 1.4. Definitions and Assumptions
- 2. Executive Summary
- 2.1. Introduction
- 3. Market Dynamics
- 3.1. Introduction
- 3.2. Market Drivers
- 3.2.1. Growing Proteomics Research; Rising Prevalence of Cancer
- 3.3. Market Restrains
- 3.3.1. Lack of Skilled Labour; High Cost of Stable Isotope-Labeled Compounds
- 3.4. Market Trends
- 3.4.1. Research and Development Segment is Dominating the Stable Isotope Labeled Compounds Market
- 4. Market Factor Analysis
- 4.1. Porters Five Forces
- 4.2. Supply/Value Chain
- 4.3. PESTEL analysis
- 4.4. Market Entropy
- 4.5. Patent/Trademark Analysis
- 5. Global Stable Isotope Labeled Compounds Industry Analysis, Insights and Forecast, 2019-2031
- 5.1. Market Analysis, Insights and Forecast - by Type
- 5.1.1. Deuterium
- 5.1.2. Carbon-13
- 5.1.3. Oxygen-18
- 5.1.4. Other Stable Isotopes
- 5.2. Market Analysis, Insights and Forecast - by Application
- 5.2.1. Research and Development
- 5.2.2. Clinical Diagnostics
- 5.2.3. Other Applications
- 5.3. Market Analysis, Insights and Forecast - by Region
- 5.3.1. North America
- 5.3.2. Europe
- 5.3.3. Asia Pacific
- 5.3.4. Middle East and Africa
- 5.3.5. South America
- 5.1. Market Analysis, Insights and Forecast - by Type
- 6. North America Stable Isotope Labeled Compounds Industry Analysis, Insights and Forecast, 2019-2031
- 6.1. Market Analysis, Insights and Forecast - by Type
- 6.1.1. Deuterium
- 6.1.2. Carbon-13
- 6.1.3. Oxygen-18
- 6.1.4. Other Stable Isotopes
- 6.2. Market Analysis, Insights and Forecast - by Application
- 6.2.1. Research and Development
- 6.2.2. Clinical Diagnostics
- 6.2.3. Other Applications
- 6.1. Market Analysis, Insights and Forecast - by Type
- 7. Europe Stable Isotope Labeled Compounds Industry Analysis, Insights and Forecast, 2019-2031
- 7.1. Market Analysis, Insights and Forecast - by Type
- 7.1.1. Deuterium
- 7.1.2. Carbon-13
- 7.1.3. Oxygen-18
- 7.1.4. Other Stable Isotopes
- 7.2. Market Analysis, Insights and Forecast - by Application
- 7.2.1. Research and Development
- 7.2.2. Clinical Diagnostics
- 7.2.3. Other Applications
- 7.1. Market Analysis, Insights and Forecast - by Type
- 8. Asia Pacific Stable Isotope Labeled Compounds Industry Analysis, Insights and Forecast, 2019-2031
- 8.1. Market Analysis, Insights and Forecast - by Type
- 8.1.1. Deuterium
- 8.1.2. Carbon-13
- 8.1.3. Oxygen-18
- 8.1.4. Other Stable Isotopes
- 8.2. Market Analysis, Insights and Forecast - by Application
- 8.2.1. Research and Development
- 8.2.2. Clinical Diagnostics
- 8.2.3. Other Applications
- 8.1. Market Analysis, Insights and Forecast - by Type
- 9. Middle East and Africa Stable Isotope Labeled Compounds Industry Analysis, Insights and Forecast, 2019-2031
- 9.1. Market Analysis, Insights and Forecast - by Type
- 9.1.1. Deuterium
- 9.1.2. Carbon-13
- 9.1.3. Oxygen-18
- 9.1.4. Other Stable Isotopes
- 9.2. Market Analysis, Insights and Forecast - by Application
- 9.2.1. Research and Development
- 9.2.2. Clinical Diagnostics
- 9.2.3. Other Applications
- 9.1. Market Analysis, Insights and Forecast - by Type
- 10. South America Stable Isotope Labeled Compounds Industry Analysis, Insights and Forecast, 2019-2031
- 10.1. Market Analysis, Insights and Forecast - by Type
- 10.1.1. Deuterium
- 10.1.2. Carbon-13
- 10.1.3. Oxygen-18
- 10.1.4. Other Stable Isotopes
- 10.2. Market Analysis, Insights and Forecast - by Application
- 10.2.1. Research and Development
- 10.2.2. Clinical Diagnostics
- 10.2.3. Other Applications
- 10.1. Market Analysis, Insights and Forecast - by Type
- 11. North America Stable Isotope Labeled Compounds Industry Analysis, Insights and Forecast, 2019-2031
- 11.1. Market Analysis, Insights and Forecast - By Country/Sub-region
- 11.1.1 United States
- 11.1.2 Canada
- 11.1.3 Mexico
- 12. Europe Stable Isotope Labeled Compounds Industry Analysis, Insights and Forecast, 2019-2031
- 12.1. Market Analysis, Insights and Forecast - By Country/Sub-region
- 12.1.1 Germany
- 12.1.2 United Kingdom
- 12.1.3 France
- 12.1.4 Italy
- 12.1.5 Spain
- 12.1.6 Rest of Europe
- 13. Asia Pacific Stable Isotope Labeled Compounds Industry Analysis, Insights and Forecast, 2019-2031
- 13.1. Market Analysis, Insights and Forecast - By Country/Sub-region
- 13.1.1 China
- 13.1.2 Japan
- 13.1.3 India
- 13.1.4 Australia
- 13.1.5 South Korea
- 13.1.6 Rest of Asia Pacific
- 14. Middle East and Africa Stable Isotope Labeled Compounds Industry Analysis, Insights and Forecast, 2019-2031
- 14.1. Market Analysis, Insights and Forecast - By Country/Sub-region
- 14.1.1 GCC
- 14.1.2 South Africa
- 14.1.3 Rest of Middle East and Africa
- 15. South America Stable Isotope Labeled Compounds Industry Analysis, Insights and Forecast, 2019-2031
- 15.1. Market Analysis, Insights and Forecast - By Country/Sub-region
- 15.1.1 Brazil
- 15.1.2 Argentina
- 15.1.3 Rest of South America
- 16. Competitive Analysis
- 16.1. Global Market Share Analysis 2024
- 16.2. Company Profiles
- 16.2.1 Merck KGaA
- 16.2.1.1. Overview
- 16.2.1.2. Products
- 16.2.1.3. SWOT Analysis
- 16.2.1.4. Recent Developments
- 16.2.1.5. Financials (Based on Availability)
- 16.2.2 Taiyo Nippon Sanso Corporation
- 16.2.2.1. Overview
- 16.2.2.2. Products
- 16.2.2.3. SWOT Analysis
- 16.2.2.4. Recent Developments
- 16.2.2.5. Financials (Based on Availability)
- 16.2.3 JSC Isotope
- 16.2.3.1. Overview
- 16.2.3.2. Products
- 16.2.3.3. SWOT Analysis
- 16.2.3.4. Recent Developments
- 16.2.3.5. Financials (Based on Availability)
- 16.2.4 Omicron Biochemicals Inc
- 16.2.4.1. Overview
- 16.2.4.2. Products
- 16.2.4.3. SWOT Analysis
- 16.2.4.4. Recent Developments
- 16.2.4.5. Financials (Based on Availability)
- 16.2.5 PerkinElmer Inc
- 16.2.5.1. Overview
- 16.2.5.2. Products
- 16.2.5.3. SWOT Analysis
- 16.2.5.4. Recent Developments
- 16.2.5.5. Financials (Based on Availability)
- 16.2.6 Cambridge Isotope Laboratories Inc
- 16.2.6.1. Overview
- 16.2.6.2. Products
- 16.2.6.3. SWOT Analysis
- 16.2.6.4. Recent Developments
- 16.2.6.5. Financials (Based on Availability)
- 16.2.7 Medical Isotopes Inc
- 16.2.7.1. Overview
- 16.2.7.2. Products
- 16.2.7.3. SWOT Analysis
- 16.2.7.4. Recent Developments
- 16.2.7.5. Financials (Based on Availability)
- 16.2.8 Trace Sciences International
- 16.2.8.1. Overview
- 16.2.8.2. Products
- 16.2.8.3. SWOT Analysis
- 16.2.8.4. Recent Developments
- 16.2.8.5. Financials (Based on Availability)
- 16.2.9 Alsachim
- 16.2.9.1. Overview
- 16.2.9.2. Products
- 16.2.9.3. SWOT Analysis
- 16.2.9.4. Recent Developments
- 16.2.9.5. Financials (Based on Availability)
- 16.2.1 Merck KGaA
List of Figures
- Figure 1: Global Stable Isotope Labeled Compounds Industry Revenue Breakdown (Million, %) by Region 2024 & 2032
- Figure 2: Global Stable Isotope Labeled Compounds Industry Volume Breakdown (K Unit, %) by Region 2024 & 2032
- Figure 3: North America Stable Isotope Labeled Compounds Industry Revenue (Million), by Country 2024 & 2032
- Figure 4: North America Stable Isotope Labeled Compounds Industry Volume (K Unit), by Country 2024 & 2032
- Figure 5: North America Stable Isotope Labeled Compounds Industry Revenue Share (%), by Country 2024 & 2032
- Figure 6: North America Stable Isotope Labeled Compounds Industry Volume Share (%), by Country 2024 & 2032
- Figure 7: Europe Stable Isotope Labeled Compounds Industry Revenue (Million), by Country 2024 & 2032
- Figure 8: Europe Stable Isotope Labeled Compounds Industry Volume (K Unit), by Country 2024 & 2032
- Figure 9: Europe Stable Isotope Labeled Compounds Industry Revenue Share (%), by Country 2024 & 2032
- Figure 10: Europe Stable Isotope Labeled Compounds Industry Volume Share (%), by Country 2024 & 2032
- Figure 11: Asia Pacific Stable Isotope Labeled Compounds Industry Revenue (Million), by Country 2024 & 2032
- Figure 12: Asia Pacific Stable Isotope Labeled Compounds Industry Volume (K Unit), by Country 2024 & 2032
- Figure 13: Asia Pacific Stable Isotope Labeled Compounds Industry Revenue Share (%), by Country 2024 & 2032
- Figure 14: Asia Pacific Stable Isotope Labeled Compounds Industry Volume Share (%), by Country 2024 & 2032
- Figure 15: Middle East and Africa Stable Isotope Labeled Compounds Industry Revenue (Million), by Country 2024 & 2032
- Figure 16: Middle East and Africa Stable Isotope Labeled Compounds Industry Volume (K Unit), by Country 2024 & 2032
- Figure 17: Middle East and Africa Stable Isotope Labeled Compounds Industry Revenue Share (%), by Country 2024 & 2032
- Figure 18: Middle East and Africa Stable Isotope Labeled Compounds Industry Volume Share (%), by Country 2024 & 2032
- Figure 19: South America Stable Isotope Labeled Compounds Industry Revenue (Million), by Country 2024 & 2032
- Figure 20: South America Stable Isotope Labeled Compounds Industry Volume (K Unit), by Country 2024 & 2032
- Figure 21: South America Stable Isotope Labeled Compounds Industry Revenue Share (%), by Country 2024 & 2032
- Figure 22: South America Stable Isotope Labeled Compounds Industry Volume Share (%), by Country 2024 & 2032
- Figure 23: North America Stable Isotope Labeled Compounds Industry Revenue (Million), by Type 2024 & 2032
- Figure 24: North America Stable Isotope Labeled Compounds Industry Volume (K Unit), by Type 2024 & 2032
- Figure 25: North America Stable Isotope Labeled Compounds Industry Revenue Share (%), by Type 2024 & 2032
- Figure 26: North America Stable Isotope Labeled Compounds Industry Volume Share (%), by Type 2024 & 2032
- Figure 27: North America Stable Isotope Labeled Compounds Industry Revenue (Million), by Application 2024 & 2032
- Figure 28: North America Stable Isotope Labeled Compounds Industry Volume (K Unit), by Application 2024 & 2032
- Figure 29: North America Stable Isotope Labeled Compounds Industry Revenue Share (%), by Application 2024 & 2032
- Figure 30: North America Stable Isotope Labeled Compounds Industry Volume Share (%), by Application 2024 & 2032
- Figure 31: North America Stable Isotope Labeled Compounds Industry Revenue (Million), by Country 2024 & 2032
- Figure 32: North America Stable Isotope Labeled Compounds Industry Volume (K Unit), by Country 2024 & 2032
- Figure 33: North America Stable Isotope Labeled Compounds Industry Revenue Share (%), by Country 2024 & 2032
- Figure 34: North America Stable Isotope Labeled Compounds Industry Volume Share (%), by Country 2024 & 2032
- Figure 35: Europe Stable Isotope Labeled Compounds Industry Revenue (Million), by Type 2024 & 2032
- Figure 36: Europe Stable Isotope Labeled Compounds Industry Volume (K Unit), by Type 2024 & 2032
- Figure 37: Europe Stable Isotope Labeled Compounds Industry Revenue Share (%), by Type 2024 & 2032
- Figure 38: Europe Stable Isotope Labeled Compounds Industry Volume Share (%), by Type 2024 & 2032
- Figure 39: Europe Stable Isotope Labeled Compounds Industry Revenue (Million), by Application 2024 & 2032
- Figure 40: Europe Stable Isotope Labeled Compounds Industry Volume (K Unit), by Application 2024 & 2032
- Figure 41: Europe Stable Isotope Labeled Compounds Industry Revenue Share (%), by Application 2024 & 2032
- Figure 42: Europe Stable Isotope Labeled Compounds Industry Volume Share (%), by Application 2024 & 2032
- Figure 43: Europe Stable Isotope Labeled Compounds Industry Revenue (Million), by Country 2024 & 2032
- Figure 44: Europe Stable Isotope Labeled Compounds Industry Volume (K Unit), by Country 2024 & 2032
- Figure 45: Europe Stable Isotope Labeled Compounds Industry Revenue Share (%), by Country 2024 & 2032
- Figure 46: Europe Stable Isotope Labeled Compounds Industry Volume Share (%), by Country 2024 & 2032
- Figure 47: Asia Pacific Stable Isotope Labeled Compounds Industry Revenue (Million), by Type 2024 & 2032
- Figure 48: Asia Pacific Stable Isotope Labeled Compounds Industry Volume (K Unit), by Type 2024 & 2032
- Figure 49: Asia Pacific Stable Isotope Labeled Compounds Industry Revenue Share (%), by Type 2024 & 2032
- Figure 50: Asia Pacific Stable Isotope Labeled Compounds Industry Volume Share (%), by Type 2024 & 2032
- Figure 51: Asia Pacific Stable Isotope Labeled Compounds Industry Revenue (Million), by Application 2024 & 2032
- Figure 52: Asia Pacific Stable Isotope Labeled Compounds Industry Volume (K Unit), by Application 2024 & 2032
- Figure 53: Asia Pacific Stable Isotope Labeled Compounds Industry Revenue Share (%), by Application 2024 & 2032
- Figure 54: Asia Pacific Stable Isotope Labeled Compounds Industry Volume Share (%), by Application 2024 & 2032
- Figure 55: Asia Pacific Stable Isotope Labeled Compounds Industry Revenue (Million), by Country 2024 & 2032
- Figure 56: Asia Pacific Stable Isotope Labeled Compounds Industry Volume (K Unit), by Country 2024 & 2032
- Figure 57: Asia Pacific Stable Isotope Labeled Compounds Industry Revenue Share (%), by Country 2024 & 2032
- Figure 58: Asia Pacific Stable Isotope Labeled Compounds Industry Volume Share (%), by Country 2024 & 2032
- Figure 59: Middle East and Africa Stable Isotope Labeled Compounds Industry Revenue (Million), by Type 2024 & 2032
- Figure 60: Middle East and Africa Stable Isotope Labeled Compounds Industry Volume (K Unit), by Type 2024 & 2032
- Figure 61: Middle East and Africa Stable Isotope Labeled Compounds Industry Revenue Share (%), by Type 2024 & 2032
- Figure 62: Middle East and Africa Stable Isotope Labeled Compounds Industry Volume Share (%), by Type 2024 & 2032
- Figure 63: Middle East and Africa Stable Isotope Labeled Compounds Industry Revenue (Million), by Application 2024 & 2032
- Figure 64: Middle East and Africa Stable Isotope Labeled Compounds Industry Volume (K Unit), by Application 2024 & 2032
- Figure 65: Middle East and Africa Stable Isotope Labeled Compounds Industry Revenue Share (%), by Application 2024 & 2032
- Figure 66: Middle East and Africa Stable Isotope Labeled Compounds Industry Volume Share (%), by Application 2024 & 2032
- Figure 67: Middle East and Africa Stable Isotope Labeled Compounds Industry Revenue (Million), by Country 2024 & 2032
- Figure 68: Middle East and Africa Stable Isotope Labeled Compounds Industry Volume (K Unit), by Country 2024 & 2032
- Figure 69: Middle East and Africa Stable Isotope Labeled Compounds Industry Revenue Share (%), by Country 2024 & 2032
- Figure 70: Middle East and Africa Stable Isotope Labeled Compounds Industry Volume Share (%), by Country 2024 & 2032
- Figure 71: South America Stable Isotope Labeled Compounds Industry Revenue (Million), by Type 2024 & 2032
- Figure 72: South America Stable Isotope Labeled Compounds Industry Volume (K Unit), by Type 2024 & 2032
- Figure 73: South America Stable Isotope Labeled Compounds Industry Revenue Share (%), by Type 2024 & 2032
- Figure 74: South America Stable Isotope Labeled Compounds Industry Volume Share (%), by Type 2024 & 2032
- Figure 75: South America Stable Isotope Labeled Compounds Industry Revenue (Million), by Application 2024 & 2032
- Figure 76: South America Stable Isotope Labeled Compounds Industry Volume (K Unit), by Application 2024 & 2032
- Figure 77: South America Stable Isotope Labeled Compounds Industry Revenue Share (%), by Application 2024 & 2032
- Figure 78: South America Stable Isotope Labeled Compounds Industry Volume Share (%), by Application 2024 & 2032
- Figure 79: South America Stable Isotope Labeled Compounds Industry Revenue (Million), by Country 2024 & 2032
- Figure 80: South America Stable Isotope Labeled Compounds Industry Volume (K Unit), by Country 2024 & 2032
- Figure 81: South America Stable Isotope Labeled Compounds Industry Revenue Share (%), by Country 2024 & 2032
- Figure 82: South America Stable Isotope Labeled Compounds Industry Volume Share (%), by Country 2024 & 2032
List of Tables
- Table 1: Global Stable Isotope Labeled Compounds Industry Revenue Million Forecast, by Region 2019 & 2032
- Table 2: Global Stable Isotope Labeled Compounds Industry Volume K Unit Forecast, by Region 2019 & 2032
- Table 3: Global Stable Isotope Labeled Compounds Industry Revenue Million Forecast, by Type 2019 & 2032
- Table 4: Global Stable Isotope Labeled Compounds Industry Volume K Unit Forecast, by Type 2019 & 2032
- Table 5: Global Stable Isotope Labeled Compounds Industry Revenue Million Forecast, by Application 2019 & 2032
- Table 6: Global Stable Isotope Labeled Compounds Industry Volume K Unit Forecast, by Application 2019 & 2032
- Table 7: Global Stable Isotope Labeled Compounds Industry Revenue Million Forecast, by Region 2019 & 2032
- Table 8: Global Stable Isotope Labeled Compounds Industry Volume K Unit Forecast, by Region 2019 & 2032
- Table 9: Global Stable Isotope Labeled Compounds Industry Revenue Million Forecast, by Country 2019 & 2032
- Table 10: Global Stable Isotope Labeled Compounds Industry Volume K Unit Forecast, by Country 2019 & 2032
- Table 11: United States Stable Isotope Labeled Compounds Industry Revenue (Million) Forecast, by Application 2019 & 2032
- Table 12: United States Stable Isotope Labeled Compounds Industry Volume (K Unit) Forecast, by Application 2019 & 2032
- Table 13: Canada Stable Isotope Labeled Compounds Industry Revenue (Million) Forecast, by Application 2019 & 2032
- Table 14: Canada Stable Isotope Labeled Compounds Industry Volume (K Unit) Forecast, by Application 2019 & 2032
- Table 15: Mexico Stable Isotope Labeled Compounds Industry Revenue (Million) Forecast, by Application 2019 & 2032
- Table 16: Mexico Stable Isotope Labeled Compounds Industry Volume (K Unit) Forecast, by Application 2019 & 2032
- Table 17: Global Stable Isotope Labeled Compounds Industry Revenue Million Forecast, by Country 2019 & 2032
- Table 18: Global Stable Isotope Labeled Compounds Industry Volume K Unit Forecast, by Country 2019 & 2032
- Table 19: Germany Stable Isotope Labeled Compounds Industry Revenue (Million) Forecast, by Application 2019 & 2032
- Table 20: Germany Stable Isotope Labeled Compounds Industry Volume (K Unit) Forecast, by Application 2019 & 2032
- Table 21: United Kingdom Stable Isotope Labeled Compounds Industry Revenue (Million) Forecast, by Application 2019 & 2032
- Table 22: United Kingdom Stable Isotope Labeled Compounds Industry Volume (K Unit) Forecast, by Application 2019 & 2032
- Table 23: France Stable Isotope Labeled Compounds Industry Revenue (Million) Forecast, by Application 2019 & 2032
- Table 24: France Stable Isotope Labeled Compounds Industry Volume (K Unit) Forecast, by Application 2019 & 2032
- Table 25: Italy Stable Isotope Labeled Compounds Industry Revenue (Million) Forecast, by Application 2019 & 2032
- Table 26: Italy Stable Isotope Labeled Compounds Industry Volume (K Unit) Forecast, by Application 2019 & 2032
- Table 27: Spain Stable Isotope Labeled Compounds Industry Revenue (Million) Forecast, by Application 2019 & 2032
- Table 28: Spain Stable Isotope Labeled Compounds Industry Volume (K Unit) Forecast, by Application 2019 & 2032
- Table 29: Rest of Europe Stable Isotope Labeled Compounds Industry Revenue (Million) Forecast, by Application 2019 & 2032
- Table 30: Rest of Europe Stable Isotope Labeled Compounds Industry Volume (K Unit) Forecast, by Application 2019 & 2032
- Table 31: Global Stable Isotope Labeled Compounds Industry Revenue Million Forecast, by Country 2019 & 2032
- Table 32: Global Stable Isotope Labeled Compounds Industry Volume K Unit Forecast, by Country 2019 & 2032
- Table 33: China Stable Isotope Labeled Compounds Industry Revenue (Million) Forecast, by Application 2019 & 2032
- Table 34: China Stable Isotope Labeled Compounds Industry Volume (K Unit) Forecast, by Application 2019 & 2032
- Table 35: Japan Stable Isotope Labeled Compounds Industry Revenue (Million) Forecast, by Application 2019 & 2032
- Table 36: Japan Stable Isotope Labeled Compounds Industry Volume (K Unit) Forecast, by Application 2019 & 2032
- Table 37: India Stable Isotope Labeled Compounds Industry Revenue (Million) Forecast, by Application 2019 & 2032
- Table 38: India Stable Isotope Labeled Compounds Industry Volume (K Unit) Forecast, by Application 2019 & 2032
- Table 39: Australia Stable Isotope Labeled Compounds Industry Revenue (Million) Forecast, by Application 2019 & 2032
- Table 40: Australia Stable Isotope Labeled Compounds Industry Volume (K Unit) Forecast, by Application 2019 & 2032
- Table 41: South Korea Stable Isotope Labeled Compounds Industry Revenue (Million) Forecast, by Application 2019 & 2032
- Table 42: South Korea Stable Isotope Labeled Compounds Industry Volume (K Unit) Forecast, by Application 2019 & 2032
- Table 43: Rest of Asia Pacific Stable Isotope Labeled Compounds Industry Revenue (Million) Forecast, by Application 2019 & 2032
- Table 44: Rest of Asia Pacific Stable Isotope Labeled Compounds Industry Volume (K Unit) Forecast, by Application 2019 & 2032
- Table 45: Global Stable Isotope Labeled Compounds Industry Revenue Million Forecast, by Country 2019 & 2032
- Table 46: Global Stable Isotope Labeled Compounds Industry Volume K Unit Forecast, by Country 2019 & 2032
- Table 47: GCC Stable Isotope Labeled Compounds Industry Revenue (Million) Forecast, by Application 2019 & 2032
- Table 48: GCC Stable Isotope Labeled Compounds Industry Volume (K Unit) Forecast, by Application 2019 & 2032
- Table 49: South Africa Stable Isotope Labeled Compounds Industry Revenue (Million) Forecast, by Application 2019 & 2032
- Table 50: South Africa Stable Isotope Labeled Compounds Industry Volume (K Unit) Forecast, by Application 2019 & 2032
- Table 51: Rest of Middle East and Africa Stable Isotope Labeled Compounds Industry Revenue (Million) Forecast, by Application 2019 & 2032
- Table 52: Rest of Middle East and Africa Stable Isotope Labeled Compounds Industry Volume (K Unit) Forecast, by Application 2019 & 2032
- Table 53: Global Stable Isotope Labeled Compounds Industry Revenue Million Forecast, by Country 2019 & 2032
- Table 54: Global Stable Isotope Labeled Compounds Industry Volume K Unit Forecast, by Country 2019 & 2032
- Table 55: Brazil Stable Isotope Labeled Compounds Industry Revenue (Million) Forecast, by Application 2019 & 2032
- Table 56: Brazil Stable Isotope Labeled Compounds Industry Volume (K Unit) Forecast, by Application 2019 & 2032
- Table 57: Argentina Stable Isotope Labeled Compounds Industry Revenue (Million) Forecast, by Application 2019 & 2032
- Table 58: Argentina Stable Isotope Labeled Compounds Industry Volume (K Unit) Forecast, by Application 2019 & 2032
- Table 59: Rest of South America Stable Isotope Labeled Compounds Industry Revenue (Million) Forecast, by Application 2019 & 2032
- Table 60: Rest of South America Stable Isotope Labeled Compounds Industry Volume (K Unit) Forecast, by Application 2019 & 2032
- Table 61: Global Stable Isotope Labeled Compounds Industry Revenue Million Forecast, by Type 2019 & 2032
- Table 62: Global Stable Isotope Labeled Compounds Industry Volume K Unit Forecast, by Type 2019 & 2032
- Table 63: Global Stable Isotope Labeled Compounds Industry Revenue Million Forecast, by Application 2019 & 2032
- Table 64: Global Stable Isotope Labeled Compounds Industry Volume K Unit Forecast, by Application 2019 & 2032
- Table 65: Global Stable Isotope Labeled Compounds Industry Revenue Million Forecast, by Country 2019 & 2032
- Table 66: Global Stable Isotope Labeled Compounds Industry Volume K Unit Forecast, by Country 2019 & 2032
- Table 67: United States Stable Isotope Labeled Compounds Industry Revenue (Million) Forecast, by Application 2019 & 2032
- Table 68: United States Stable Isotope Labeled Compounds Industry Volume (K Unit) Forecast, by Application 2019 & 2032
- Table 69: Canada Stable Isotope Labeled Compounds Industry Revenue (Million) Forecast, by Application 2019 & 2032
- Table 70: Canada Stable Isotope Labeled Compounds Industry Volume (K Unit) Forecast, by Application 2019 & 2032
- Table 71: Mexico Stable Isotope Labeled Compounds Industry Revenue (Million) Forecast, by Application 2019 & 2032
- Table 72: Mexico Stable Isotope Labeled Compounds Industry Volume (K Unit) Forecast, by Application 2019 & 2032
- Table 73: Global Stable Isotope Labeled Compounds Industry Revenue Million Forecast, by Type 2019 & 2032
- Table 74: Global Stable Isotope Labeled Compounds Industry Volume K Unit Forecast, by Type 2019 & 2032
- Table 75: Global Stable Isotope Labeled Compounds Industry Revenue Million Forecast, by Application 2019 & 2032
- Table 76: Global Stable Isotope Labeled Compounds Industry Volume K Unit Forecast, by Application 2019 & 2032
- Table 77: Global Stable Isotope Labeled Compounds Industry Revenue Million Forecast, by Country 2019 & 2032
- Table 78: Global Stable Isotope Labeled Compounds Industry Volume K Unit Forecast, by Country 2019 & 2032
- Table 79: Germany Stable Isotope Labeled Compounds Industry Revenue (Million) Forecast, by Application 2019 & 2032
- Table 80: Germany Stable Isotope Labeled Compounds Industry Volume (K Unit) Forecast, by Application 2019 & 2032
- Table 81: United Kingdom Stable Isotope Labeled Compounds Industry Revenue (Million) Forecast, by Application 2019 & 2032
- Table 82: United Kingdom Stable Isotope Labeled Compounds Industry Volume (K Unit) Forecast, by Application 2019 & 2032
- Table 83: France Stable Isotope Labeled Compounds Industry Revenue (Million) Forecast, by Application 2019 & 2032
- Table 84: France Stable Isotope Labeled Compounds Industry Volume (K Unit) Forecast, by Application 2019 & 2032
- Table 85: Italy Stable Isotope Labeled Compounds Industry Revenue (Million) Forecast, by Application 2019 & 2032
- Table 86: Italy Stable Isotope Labeled Compounds Industry Volume (K Unit) Forecast, by Application 2019 & 2032
- Table 87: Spain Stable Isotope Labeled Compounds Industry Revenue (Million) Forecast, by Application 2019 & 2032
- Table 88: Spain Stable Isotope Labeled Compounds Industry Volume (K Unit) Forecast, by Application 2019 & 2032
- Table 89: Rest of Europe Stable Isotope Labeled Compounds Industry Revenue (Million) Forecast, by Application 2019 & 2032
- Table 90: Rest of Europe Stable Isotope Labeled Compounds Industry Volume (K Unit) Forecast, by Application 2019 & 2032
- Table 91: Global Stable Isotope Labeled Compounds Industry Revenue Million Forecast, by Type 2019 & 2032
- Table 92: Global Stable Isotope Labeled Compounds Industry Volume K Unit Forecast, by Type 2019 & 2032
- Table 93: Global Stable Isotope Labeled Compounds Industry Revenue Million Forecast, by Application 2019 & 2032
- Table 94: Global Stable Isotope Labeled Compounds Industry Volume K Unit Forecast, by Application 2019 & 2032
- Table 95: Global Stable Isotope Labeled Compounds Industry Revenue Million Forecast, by Country 2019 & 2032
- Table 96: Global Stable Isotope Labeled Compounds Industry Volume K Unit Forecast, by Country 2019 & 2032
- Table 97: China Stable Isotope Labeled Compounds Industry Revenue (Million) Forecast, by Application 2019 & 2032
- Table 98: China Stable Isotope Labeled Compounds Industry Volume (K Unit) Forecast, by Application 2019 & 2032
- Table 99: Japan Stable Isotope Labeled Compounds Industry Revenue (Million) Forecast, by Application 2019 & 2032
- Table 100: Japan Stable Isotope Labeled Compounds Industry Volume (K Unit) Forecast, by Application 2019 & 2032
- Table 101: India Stable Isotope Labeled Compounds Industry Revenue (Million) Forecast, by Application 2019 & 2032
- Table 102: India Stable Isotope Labeled Compounds Industry Volume (K Unit) Forecast, by Application 2019 & 2032
- Table 103: Australia Stable Isotope Labeled Compounds Industry Revenue (Million) Forecast, by Application 2019 & 2032
- Table 104: Australia Stable Isotope Labeled Compounds Industry Volume (K Unit) Forecast, by Application 2019 & 2032
- Table 105: South Korea Stable Isotope Labeled Compounds Industry Revenue (Million) Forecast, by Application 2019 & 2032
- Table 106: South Korea Stable Isotope Labeled Compounds Industry Volume (K Unit) Forecast, by Application 2019 & 2032
- Table 107: Rest of Asia Pacific Stable Isotope Labeled Compounds Industry Revenue (Million) Forecast, by Application 2019 & 2032
- Table 108: Rest of Asia Pacific Stable Isotope Labeled Compounds Industry Volume (K Unit) Forecast, by Application 2019 & 2032
- Table 109: Global Stable Isotope Labeled Compounds Industry Revenue Million Forecast, by Type 2019 & 2032
- Table 110: Global Stable Isotope Labeled Compounds Industry Volume K Unit Forecast, by Type 2019 & 2032
- Table 111: Global Stable Isotope Labeled Compounds Industry Revenue Million Forecast, by Application 2019 & 2032
- Table 112: Global Stable Isotope Labeled Compounds Industry Volume K Unit Forecast, by Application 2019 & 2032
- Table 113: Global Stable Isotope Labeled Compounds Industry Revenue Million Forecast, by Country 2019 & 2032
- Table 114: Global Stable Isotope Labeled Compounds Industry Volume K Unit Forecast, by Country 2019 & 2032
- Table 115: GCC Stable Isotope Labeled Compounds Industry Revenue (Million) Forecast, by Application 2019 & 2032
- Table 116: GCC Stable Isotope Labeled Compounds Industry Volume (K Unit) Forecast, by Application 2019 & 2032
- Table 117: South Africa Stable Isotope Labeled Compounds Industry Revenue (Million) Forecast, by Application 2019 & 2032
- Table 118: South Africa Stable Isotope Labeled Compounds Industry Volume (K Unit) Forecast, by Application 2019 & 2032
- Table 119: Rest of Middle East and Africa Stable Isotope Labeled Compounds Industry Revenue (Million) Forecast, by Application 2019 & 2032
- Table 120: Rest of Middle East and Africa Stable Isotope Labeled Compounds Industry Volume (K Unit) Forecast, by Application 2019 & 2032
- Table 121: Global Stable Isotope Labeled Compounds Industry Revenue Million Forecast, by Type 2019 & 2032
- Table 122: Global Stable Isotope Labeled Compounds Industry Volume K Unit Forecast, by Type 2019 & 2032
- Table 123: Global Stable Isotope Labeled Compounds Industry Revenue Million Forecast, by Application 2019 & 2032
- Table 124: Global Stable Isotope Labeled Compounds Industry Volume K Unit Forecast, by Application 2019 & 2032
- Table 125: Global Stable Isotope Labeled Compounds Industry Revenue Million Forecast, by Country 2019 & 2032
- Table 126: Global Stable Isotope Labeled Compounds Industry Volume K Unit Forecast, by Country 2019 & 2032
- Table 127: Brazil Stable Isotope Labeled Compounds Industry Revenue (Million) Forecast, by Application 2019 & 2032
- Table 128: Brazil Stable Isotope Labeled Compounds Industry Volume (K Unit) Forecast, by Application 2019 & 2032
- Table 129: Argentina Stable Isotope Labeled Compounds Industry Revenue (Million) Forecast, by Application 2019 & 2032
- Table 130: Argentina Stable Isotope Labeled Compounds Industry Volume (K Unit) Forecast, by Application 2019 & 2032
- Table 131: Rest of South America Stable Isotope Labeled Compounds Industry Revenue (Million) Forecast, by Application 2019 & 2032
- Table 132: Rest of South America Stable Isotope Labeled Compounds Industry Volume (K Unit) Forecast, by Application 2019 & 2032
Frequently Asked Questions
1. What is the projected Compound Annual Growth Rate (CAGR) of the Stable Isotope Labeled Compounds Industry?
The projected CAGR is approximately 3.30%.
2. Which companies are prominent players in the Stable Isotope Labeled Compounds Industry?
Key companies in the market include Merck KGaA, Taiyo Nippon Sanso Corporation, JSC Isotope, Omicron Biochemicals Inc, PerkinElmer Inc, Cambridge Isotope Laboratories Inc, Medical Isotopes Inc, Trace Sciences International, Alsachim.
3. What are the main segments of the Stable Isotope Labeled Compounds Industry?
The market segments include Type, Application.
4. Can you provide details about the market size?
The market size is estimated to be USD XX Million as of 2022.
5. What are some drivers contributing to market growth?
Growing Proteomics Research; Rising Prevalence of Cancer.
6. What are the notable trends driving market growth?
Research and Development Segment is Dominating the Stable Isotope Labeled Compounds Market.
7. Are there any restraints impacting market growth?
Lack of Skilled Labour; High Cost of Stable Isotope-Labeled Compounds.
8. Can you provide examples of recent developments in the market?
Oct 2022: ORNL announced its contribution to building new facilities to make isotopes used in medical treatments and many other fields. The US Stable Isotope Production and Research Center will enrich stable isotopes used for cancer treatments, heart disease treatments, and space exploration.
9. What pricing options are available for accessing the report?
Pricing options include single-user, multi-user, and enterprise licenses priced at USD 4750, USD 5250, and USD 8750 respectively.
10. Is the market size provided in terms of value or volume?
The market size is provided in terms of value, measured in Million and volume, measured in K Unit.
11. Are there any specific market keywords associated with the report?
Yes, the market keyword associated with the report is "Stable Isotope Labeled Compounds Industry," which aids in identifying and referencing the specific market segment covered.
12. How do I determine which pricing option suits my needs best?
The pricing options vary based on user requirements and access needs. Individual users may opt for single-user licenses, while businesses requiring broader access may choose multi-user or enterprise licenses for cost-effective access to the report.
13. Are there any additional resources or data provided in the Stable Isotope Labeled Compounds Industry report?
While the report offers comprehensive insights, it's advisable to review the specific contents or supplementary materials provided to ascertain if additional resources or data are available.
14. How can I stay updated on further developments or reports in the Stable Isotope Labeled Compounds Industry?
To stay informed about further developments, trends, and reports in the Stable Isotope Labeled Compounds Industry, consider subscribing to industry newsletters, following relevant companies and organizations, or regularly checking reputable industry news sources and publications.
Methodology
Step 1 - Identification of Relevant Samples Size from Population Database


Step 2 - Approaches for Defining Global Market Size (Value, Volume* & Price*)

Note*: In applicable scenarios
Step 3 - Data Sources
Primary Research
- Web Analytics
- Survey Reports
- Research Institute
- Latest Research Reports
- Opinion Leaders
Secondary Research
- Annual Reports
- White Paper
- Latest Press Release
- Industry Association
- Paid Database
- Investor Presentations

Step 4 - Data Triangulation
Involves using different sources of information in order to increase the validity of a study
These sources are likely to be stakeholders in a program - participants, other researchers, program staff, other community members, and so on.
Then we put all data in single framework & apply various statistical tools to find out the dynamic on the market.
During the analysis stage, feedback from the stakeholder groups would be compared to determine areas of agreement as well as areas of divergence


