
Key Insights
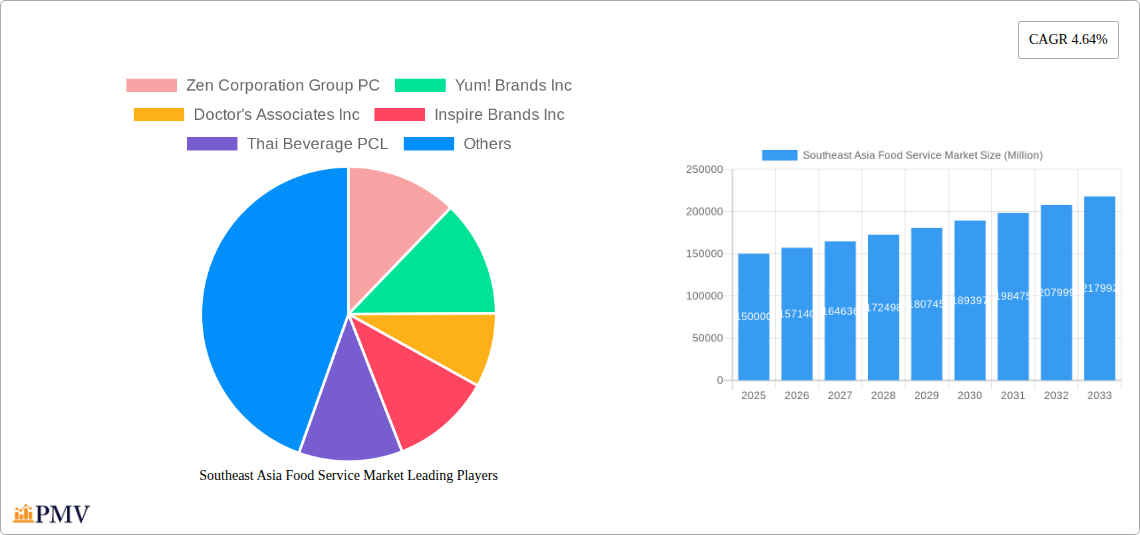
The Southeast Asian food service market, encompassing diverse cuisines and formats across countries like Indonesia, Malaysia, the Philippines, Singapore, Thailand, and Vietnam, exhibits robust growth potential. Driven by rising disposable incomes, rapid urbanization, a burgeoning young population with a preference for dining out, and the increasing popularity of quick-service restaurants (QSRs) and cafes, the market is projected to experience a Compound Annual Growth Rate (CAGR) of 4.64% from 2025 to 2033. Significant market segments include chained outlets, which benefit from economies of scale and brand recognition, and independent outlets, offering unique culinary experiences and catering to local preferences. The location segment is diversified, with strong presence in retail, leisure, and travel settings, reflecting the varied consumer needs and consumption patterns. Furthermore, the expansion of international QSR chains alongside the growth of local foodservice brands contributes to market dynamism. Challenges include maintaining food safety standards across a diverse and rapidly expanding market, managing rising labor costs, and adapting to evolving consumer preferences that prioritize health, sustainability, and unique culinary experiences.
The market's growth trajectory is further influenced by several key trends. The increasing adoption of online food delivery platforms fuels convenience and expands market reach. A growing preference for healthier options and customized menus necessitates innovation in product offerings. The integration of technology, such as digital ordering and payment systems, improves operational efficiency and enhances the customer experience. Furthermore, the strategic expansion of established players and the emergence of new foodservice concepts contribute to the market's dynamic landscape. Considering the strong economic growth in several Southeast Asian nations, a conservative estimate places the 2025 market size at approximately $150 billion USD, with this figure projected to steadily increase based on the CAGR. This necessitates a strategic approach for businesses to capture market share by catering to the unique preferences of each nation while adapting to evolving consumer behaviors.
This in-depth report provides a comprehensive analysis of the Southeast Asia food service market, encompassing market size, growth drivers, competitive landscape, and future trends. The study period covers 2019-2033, with 2025 as the base and estimated year, and a forecast period of 2025-2033. The historical period analyzed is 2019-2024. This report is essential for industry stakeholders, investors, and anyone seeking to understand this dynamic and rapidly expanding market.
Southeast Asia Food Service Market Structure & Competitive Dynamics
This section analyzes the Southeast Asia food service market's competitive dynamics, including market concentration, innovation ecosystems, regulatory frameworks, product substitutes, end-user trends, and mergers & acquisitions (M&A) activities. The market is characterized by a mix of large multinational chains and smaller independent operators. Market concentration is moderate, with a few dominant players holding significant market share, but many smaller players contributing to overall volume. Innovation is driven by evolving consumer preferences, technological advancements, and the need for operational efficiency. Regulatory frameworks vary across countries but generally focus on food safety, hygiene, and labor standards. Product substitutes include home-cooked meals and meal delivery services, posing a competitive challenge. End-user trends indicate increasing demand for convenience, healthy options, and unique culinary experiences. M&A activities are frequent, with larger players seeking to expand their market reach and diversify their offerings. Estimated M&A deal values in the Southeast Asia food service market totaled approximately xx Million in 2024. Key market share holders include:
- Jollibee Foods Corporation: Holds a significant share, particularly in the Philippines.
- McDonald's Corporation: Maintains a strong presence across the region.
- Starbucks Corporation: A major player in the coffee shop segment.
- Other players: Numerous smaller chains and independent operators contribute significantly to the overall market.
Southeast Asia Food Service Market Industry Trends & Insights
The Southeast Asia food service market exhibits strong growth, driven by several key factors. Rising disposable incomes, urbanization, and a growing young population fuel demand for convenient and diverse food options. The market is experiencing a significant shift towards online ordering and delivery platforms, facilitated by increasing smartphone penetration and readily available internet access. Technological advancements, such as automation and data analytics, are transforming operational efficiency and customer experience. Consumer preferences are evolving towards healthier and more sustainable choices, impacting product development and marketing strategies. The competitive landscape is dynamic, with both established players and new entrants vying for market share. The CAGR (Compound Annual Growth Rate) for the Southeast Asia food service market is estimated at xx% during the forecast period (2025-2033). Market penetration of online food delivery services continues to rise, with xx% of consumers using such platforms in 2024, projected to reach xx% by 2033. The increasing preference for diverse cuisines and unique dining experiences also contributes to the market’s dynamism.

Dominant Markets & Segments in Southeast Asia Food Service Market
The Southeast Asia food service market is highly fragmented across various countries and segments. However, some clear trends emerge:
- Leading Countries: Indonesia, Philippines, and Thailand represent the largest markets due to their large populations and rising middle classes.
- Dominant Outlet Type: Chained outlets hold a significant share due to their brand recognition, consistent quality, and widespread presence. However, independent outlets remain a significant portion of the market, catering to local tastes and preferences.
- Primary Location Type: Standalone outlets remain the most prevalent, but the growth of food service within retail, leisure, and travel locations is notable.
- Strong Performing Foodservice Type: QSR cuisines are the market leader, followed by Cafes & Bars.
Key Drivers for Leading Segments:
- Indonesia: Rapid economic growth, increasing urbanization, and a large young population.
- Philippines: High smartphone penetration and increasing adoption of online food delivery services.
- Thailand: Strong tourism sector and a diverse culinary landscape.
- Chained Outlets: Brand recognition, consistent quality, and efficient operations.
- Standalone Outlets: Flexibility, local customization, and lower operational costs.
- QSR Cuisines: Convenience, affordability, and diverse offerings.
Southeast Asia Food Service Market Product Innovations
Recent product innovations focus on meeting evolving consumer demands for convenience, health, and unique experiences. Technological advancements such as AI-powered ordering systems, personalized recommendations, and kitchen automation are enhancing operational efficiency and customer satisfaction. The market is witnessing the introduction of customized meal options, plant-based alternatives, and healthier menu choices. These innovations are driving competition and shaping future market trends. The integration of technology and the emphasis on healthier and more personalized options are key competitive advantages.
Report Segmentation & Scope
This report segments the Southeast Asia food service market across several key dimensions:
Outlet: Chained Outlets and Independent Outlets. Growth projections vary based on the factors influencing each segment, with chained outlets showing consistent growth. Market size for both segments is significant and contributes to the overall market expansion.
Location: Leisure, Lodging, Retail, Standalone, and Travel. Market size varies across locations, with standalone locations dominating. However, integration within retail, leisure, and travel segments is growing rapidly.
Country: Indonesia, Malaysia, Philippines, Singapore, Thailand, Vietnam, and Rest of Southeast Asia. Each country presents unique market dynamics, with significant variations in market size and growth rates.
Foodservice Type: Cafes & Bars and Other QSR Cuisines. QSR Cuisines currently dominate, but the cafes and bars segment is expected to show notable growth in coming years.
Key Drivers of Southeast Asia Food Service Market Growth
Several factors fuel the growth of the Southeast Asia food service market:
- Rising Disposable Incomes: A growing middle class with increased purchasing power is a significant driver.
- Urbanization: The shift from rural to urban areas increases demand for convenient food options.
- Young Population: A large youth population fuels demand for diverse and trendy food choices.
- Technological Advancements: Digitalization of ordering and payment systems enhances convenience.
- Tourism: The thriving tourism sector stimulates growth, particularly in major tourist destinations.
Challenges in the Southeast Asia Food Service Market Sector
The Southeast Asia food service market faces several challenges:
- Intense Competition: The market is highly competitive, particularly in major urban areas.
- Food Safety Concerns: Maintaining food safety standards requires careful management across the supply chain.
- Labor Costs: Rising labor costs can impact profitability and pricing strategies.
- Regulatory Hurdles: Navigating varying regulations across different countries can be complex.
- Supply Chain Disruptions: Global events can disrupt supply chains, impacting the availability of ingredients.
Leading Players in the Southeast Asia Food Service Market Market
- Jollibee Foods Corporation
- McDonald's Corporation
- Yum! Brands Inc
- Inspire Brands Inc
- The Wendy's Company
- Domino's Pizza Enterprises Ltd
- Starbucks Corporation
- Restaurant Brands International Inc
- Thai Beverage PCL
- Nando's Group Holdings Limited
- Doctor's Associates Inc
- Secret Recipe Cakes & Café Sdn Bhd
- Tung Lok Restaurants (2000) Ltd
- Marrybrown Sdn Bhd
- Minor International PCL
- Zen Corporation Group PC
Key Developments in Southeast Asia Food Service Market Sector
- May 2023: Inspire Brands, Inc. launched new butter variants to its Butternut portfolio. This broadened product offerings and catered to evolving consumer preferences.
- May 2023: Starbucks inaugurated a new store in Bird Paradise, Philippines. This expansion showcases the company's commitment to the market.
- October 2023: Starbucks launched two new ice cream-based drinks in the Philippines. This product innovation aimed to capture consumer interest and drive sales.
Strategic Southeast Asia Food Service Market Outlook
The Southeast Asia food service market presents significant growth opportunities. Continued economic growth, increasing urbanization, and the evolving preferences of consumers will drive expansion. Technological advancements will play a crucial role in enhancing operational efficiency and customer experience. Strategic partnerships, product innovation, and a focus on sustainability will be key to success in this dynamic market. The market is poised for substantial growth, offering attractive investment prospects for businesses willing to adapt to the changing landscape.
Southeast Asia Food Service Market Segmentation
-
1. Foodservice Type
-
1.1. Cafes & Bars
-
1.1.1. By Cuisine
- 1.1.1.1. Bars & Pubs
- 1.1.1.2. Juice/Smoothie/Desserts Bars
- 1.1.1.3. Specialist Coffee & Tea Shops
-
1.1.1. By Cuisine
- 1.2. Cloud Kitchen
-
1.3. Full Service Restaurants
- 1.3.1. Asian
- 1.3.2. European
- 1.3.3. Latin American
- 1.3.4. Middle Eastern
- 1.3.5. North American
- 1.3.6. Other FSR Cuisines
-
1.4. Quick Service Restaurants
- 1.4.1. Bakeries
- 1.4.2. Burger
- 1.4.3. Ice Cream
- 1.4.4. Meat-based Cuisines
- 1.4.5. Pizza
- 1.4.6. Other QSR Cuisines
-
1.1. Cafes & Bars
-
2. Outlet
- 2.1. Chained Outlets
- 2.2. Independent Outlets
-
3. Location
- 3.1. Leisure
- 3.2. Lodging
- 3.3. Retail
- 3.4. Standalone
- 3.5. Travel
Southeast Asia Food Service Market Segmentation By Geography
-
1. North America
- 1.1. United States
- 1.2. Canada
- 1.3. Mexico
-
2. South America
- 2.1. Brazil
- 2.2. Argentina
- 2.3. Rest of South America
-
3. Europe
- 3.1. United Kingdom
- 3.2. Germany
- 3.3. France
- 3.4. Italy
- 3.5. Spain
- 3.6. Russia
- 3.7. Benelux
- 3.8. Nordics
- 3.9. Rest of Europe
-
4. Middle East & Africa
- 4.1. Turkey
- 4.2. Israel
- 4.3. GCC
- 4.4. North Africa
- 4.5. South Africa
- 4.6. Rest of Middle East & Africa
-
5. Asia Pacific
- 5.1. China
- 5.2. India
- 5.3. Japan
- 5.4. South Korea
- 5.5. ASEAN
- 5.6. Oceania
- 5.7. Rest of Asia Pacific

Southeast Asia Food Service Market REPORT HIGHLIGHTS
| Aspects | Details |
|---|---|
| Study Period | 2019-2033 |
| Base Year | 2024 |
| Estimated Year | 2025 |
| Forecast Period | 2025-2033 |
| Historical Period | 2019-2024 |
| Growth Rate | CAGR of 4.64% from 2019-2033 |
| Segmentation |
|
Table of Contents
- 1. Introduction
- 1.1. Research Scope
- 1.2. Market Segmentation
- 1.3. Research Methodology
- 1.4. Definitions and Assumptions
- 2. Executive Summary
- 2.1. Introduction
- 3. Market Dynamics
- 3.1. Introduction
- 3.2. Market Drivers
- 3.2.1. Growing Awareness of Functional Benefits of Carotenoids; Consumption of Health and Wellness Products
- 3.3. Market Restrains
- 3.3.1. High Processing Cost and Low Yield of Natural Food Colors
- 3.4. Market Trends
- 3.4.1. OTHER KEY INDUSTRY TRENDS COVERED IN THE REPORT
- 4. Market Factor Analysis
- 4.1. Porters Five Forces
- 4.2. Supply/Value Chain
- 4.3. PESTEL analysis
- 4.4. Market Entropy
- 4.5. Patent/Trademark Analysis
- 5. Global Southeast Asia Food Service Market Analysis, Insights and Forecast, 2019-2031
- 5.1. Market Analysis, Insights and Forecast - by Foodservice Type
- 5.1.1. Cafes & Bars
- 5.1.1.1. By Cuisine
- 5.1.1.1.1. Bars & Pubs
- 5.1.1.1.2. Juice/Smoothie/Desserts Bars
- 5.1.1.1.3. Specialist Coffee & Tea Shops
- 5.1.1.1. By Cuisine
- 5.1.2. Cloud Kitchen
- 5.1.3. Full Service Restaurants
- 5.1.3.1. Asian
- 5.1.3.2. European
- 5.1.3.3. Latin American
- 5.1.3.4. Middle Eastern
- 5.1.3.5. North American
- 5.1.3.6. Other FSR Cuisines
- 5.1.4. Quick Service Restaurants
- 5.1.4.1. Bakeries
- 5.1.4.2. Burger
- 5.1.4.3. Ice Cream
- 5.1.4.4. Meat-based Cuisines
- 5.1.4.5. Pizza
- 5.1.4.6. Other QSR Cuisines
- 5.1.1. Cafes & Bars
- 5.2. Market Analysis, Insights and Forecast - by Outlet
- 5.2.1. Chained Outlets
- 5.2.2. Independent Outlets
- 5.3. Market Analysis, Insights and Forecast - by Location
- 5.3.1. Leisure
- 5.3.2. Lodging
- 5.3.3. Retail
- 5.3.4. Standalone
- 5.3.5. Travel
- 5.4. Market Analysis, Insights and Forecast - by Region
- 5.4.1. North America
- 5.4.2. South America
- 5.4.3. Europe
- 5.4.4. Middle East & Africa
- 5.4.5. Asia Pacific
- 5.1. Market Analysis, Insights and Forecast - by Foodservice Type
- 6. North America Southeast Asia Food Service Market Analysis, Insights and Forecast, 2019-2031
- 6.1. Market Analysis, Insights and Forecast - by Foodservice Type
- 6.1.1. Cafes & Bars
- 6.1.1.1. By Cuisine
- 6.1.1.1.1. Bars & Pubs
- 6.1.1.1.2. Juice/Smoothie/Desserts Bars
- 6.1.1.1.3. Specialist Coffee & Tea Shops
- 6.1.1.1. By Cuisine
- 6.1.2. Cloud Kitchen
- 6.1.3. Full Service Restaurants
- 6.1.3.1. Asian
- 6.1.3.2. European
- 6.1.3.3. Latin American
- 6.1.3.4. Middle Eastern
- 6.1.3.5. North American
- 6.1.3.6. Other FSR Cuisines
- 6.1.4. Quick Service Restaurants
- 6.1.4.1. Bakeries
- 6.1.4.2. Burger
- 6.1.4.3. Ice Cream
- 6.1.4.4. Meat-based Cuisines
- 6.1.4.5. Pizza
- 6.1.4.6. Other QSR Cuisines
- 6.1.1. Cafes & Bars
- 6.2. Market Analysis, Insights and Forecast - by Outlet
- 6.2.1. Chained Outlets
- 6.2.2. Independent Outlets
- 6.3. Market Analysis, Insights and Forecast - by Location
- 6.3.1. Leisure
- 6.3.2. Lodging
- 6.3.3. Retail
- 6.3.4. Standalone
- 6.3.5. Travel
- 6.1. Market Analysis, Insights and Forecast - by Foodservice Type
- 7. South America Southeast Asia Food Service Market Analysis, Insights and Forecast, 2019-2031
- 7.1. Market Analysis, Insights and Forecast - by Foodservice Type
- 7.1.1. Cafes & Bars
- 7.1.1.1. By Cuisine
- 7.1.1.1.1. Bars & Pubs
- 7.1.1.1.2. Juice/Smoothie/Desserts Bars
- 7.1.1.1.3. Specialist Coffee & Tea Shops
- 7.1.1.1. By Cuisine
- 7.1.2. Cloud Kitchen
- 7.1.3. Full Service Restaurants
- 7.1.3.1. Asian
- 7.1.3.2. European
- 7.1.3.3. Latin American
- 7.1.3.4. Middle Eastern
- 7.1.3.5. North American
- 7.1.3.6. Other FSR Cuisines
- 7.1.4. Quick Service Restaurants
- 7.1.4.1. Bakeries
- 7.1.4.2. Burger
- 7.1.4.3. Ice Cream
- 7.1.4.4. Meat-based Cuisines
- 7.1.4.5. Pizza
- 7.1.4.6. Other QSR Cuisines
- 7.1.1. Cafes & Bars
- 7.2. Market Analysis, Insights and Forecast - by Outlet
- 7.2.1. Chained Outlets
- 7.2.2. Independent Outlets
- 7.3. Market Analysis, Insights and Forecast - by Location
- 7.3.1. Leisure
- 7.3.2. Lodging
- 7.3.3. Retail
- 7.3.4. Standalone
- 7.3.5. Travel
- 7.1. Market Analysis, Insights and Forecast - by Foodservice Type
- 8. Europe Southeast Asia Food Service Market Analysis, Insights and Forecast, 2019-2031
- 8.1. Market Analysis, Insights and Forecast - by Foodservice Type
- 8.1.1. Cafes & Bars
- 8.1.1.1. By Cuisine
- 8.1.1.1.1. Bars & Pubs
- 8.1.1.1.2. Juice/Smoothie/Desserts Bars
- 8.1.1.1.3. Specialist Coffee & Tea Shops
- 8.1.1.1. By Cuisine
- 8.1.2. Cloud Kitchen
- 8.1.3. Full Service Restaurants
- 8.1.3.1. Asian
- 8.1.3.2. European
- 8.1.3.3. Latin American
- 8.1.3.4. Middle Eastern
- 8.1.3.5. North American
- 8.1.3.6. Other FSR Cuisines
- 8.1.4. Quick Service Restaurants
- 8.1.4.1. Bakeries
- 8.1.4.2. Burger
- 8.1.4.3. Ice Cream
- 8.1.4.4. Meat-based Cuisines
- 8.1.4.5. Pizza
- 8.1.4.6. Other QSR Cuisines
- 8.1.1. Cafes & Bars
- 8.2. Market Analysis, Insights and Forecast - by Outlet
- 8.2.1. Chained Outlets
- 8.2.2. Independent Outlets
- 8.3. Market Analysis, Insights and Forecast - by Location
- 8.3.1. Leisure
- 8.3.2. Lodging
- 8.3.3. Retail
- 8.3.4. Standalone
- 8.3.5. Travel
- 8.1. Market Analysis, Insights and Forecast - by Foodservice Type
- 9. Middle East & Africa Southeast Asia Food Service Market Analysis, Insights and Forecast, 2019-2031
- 9.1. Market Analysis, Insights and Forecast - by Foodservice Type
- 9.1.1. Cafes & Bars
- 9.1.1.1. By Cuisine
- 9.1.1.1.1. Bars & Pubs
- 9.1.1.1.2. Juice/Smoothie/Desserts Bars
- 9.1.1.1.3. Specialist Coffee & Tea Shops
- 9.1.1.1. By Cuisine
- 9.1.2. Cloud Kitchen
- 9.1.3. Full Service Restaurants
- 9.1.3.1. Asian
- 9.1.3.2. European
- 9.1.3.3. Latin American
- 9.1.3.4. Middle Eastern
- 9.1.3.5. North American
- 9.1.3.6. Other FSR Cuisines
- 9.1.4. Quick Service Restaurants
- 9.1.4.1. Bakeries
- 9.1.4.2. Burger
- 9.1.4.3. Ice Cream
- 9.1.4.4. Meat-based Cuisines
- 9.1.4.5. Pizza
- 9.1.4.6. Other QSR Cuisines
- 9.1.1. Cafes & Bars
- 9.2. Market Analysis, Insights and Forecast - by Outlet
- 9.2.1. Chained Outlets
- 9.2.2. Independent Outlets
- 9.3. Market Analysis, Insights and Forecast - by Location
- 9.3.1. Leisure
- 9.3.2. Lodging
- 9.3.3. Retail
- 9.3.4. Standalone
- 9.3.5. Travel
- 9.1. Market Analysis, Insights and Forecast - by Foodservice Type
- 10. Asia Pacific Southeast Asia Food Service Market Analysis, Insights and Forecast, 2019-2031
- 10.1. Market Analysis, Insights and Forecast - by Foodservice Type
- 10.1.1. Cafes & Bars
- 10.1.1.1. By Cuisine
- 10.1.1.1.1. Bars & Pubs
- 10.1.1.1.2. Juice/Smoothie/Desserts Bars
- 10.1.1.1.3. Specialist Coffee & Tea Shops
- 10.1.1.1. By Cuisine
- 10.1.2. Cloud Kitchen
- 10.1.3. Full Service Restaurants
- 10.1.3.1. Asian
- 10.1.3.2. European
- 10.1.3.3. Latin American
- 10.1.3.4. Middle Eastern
- 10.1.3.5. North American
- 10.1.3.6. Other FSR Cuisines
- 10.1.4. Quick Service Restaurants
- 10.1.4.1. Bakeries
- 10.1.4.2. Burger
- 10.1.4.3. Ice Cream
- 10.1.4.4. Meat-based Cuisines
- 10.1.4.5. Pizza
- 10.1.4.6. Other QSR Cuisines
- 10.1.1. Cafes & Bars
- 10.2. Market Analysis, Insights and Forecast - by Outlet
- 10.2.1. Chained Outlets
- 10.2.2. Independent Outlets
- 10.3. Market Analysis, Insights and Forecast - by Location
- 10.3.1. Leisure
- 10.3.2. Lodging
- 10.3.3. Retail
- 10.3.4. Standalone
- 10.3.5. Travel
- 10.1. Market Analysis, Insights and Forecast - by Foodservice Type
- 11. China Southeast Asia Food Service Market Analysis, Insights and Forecast, 2019-2031
- 12. Japan Southeast Asia Food Service Market Analysis, Insights and Forecast, 2019-2031
- 13. India Southeast Asia Food Service Market Analysis, Insights and Forecast, 2019-2031
- 14. South Korea Southeast Asia Food Service Market Analysis, Insights and Forecast, 2019-2031
- 15. Taiwan Southeast Asia Food Service Market Analysis, Insights and Forecast, 2019-2031
- 16. Australia Southeast Asia Food Service Market Analysis, Insights and Forecast, 2019-2031
- 17. Rest of Asia-Pacific Southeast Asia Food Service Market Analysis, Insights and Forecast, 2019-2031
- 18. Competitive Analysis
- 18.1. Global Market Share Analysis 2024
- 18.2. Company Profiles
- 18.2.1 Zen Corporation Group PC
- 18.2.1.1. Overview
- 18.2.1.2. Products
- 18.2.1.3. SWOT Analysis
- 18.2.1.4. Recent Developments
- 18.2.1.5. Financials (Based on Availability)
- 18.2.2 Yum! Brands Inc
- 18.2.2.1. Overview
- 18.2.2.2. Products
- 18.2.2.3. SWOT Analysis
- 18.2.2.4. Recent Developments
- 18.2.2.5. Financials (Based on Availability)
- 18.2.3 Doctor's Associates Inc
- 18.2.3.1. Overview
- 18.2.3.2. Products
- 18.2.3.3. SWOT Analysis
- 18.2.3.4. Recent Developments
- 18.2.3.5. Financials (Based on Availability)
- 18.2.4 Inspire Brands Inc
- 18.2.4.1. Overview
- 18.2.4.2. Products
- 18.2.4.3. SWOT Analysis
- 18.2.4.4. Recent Developments
- 18.2.4.5. Financials (Based on Availability)
- 18.2.5 Thai Beverage PCL
- 18.2.5.1. Overview
- 18.2.5.2. Products
- 18.2.5.3. SWOT Analysis
- 18.2.5.4. Recent Developments
- 18.2.5.5. Financials (Based on Availability)
- 18.2.6 Nando's Group Holdings Limited
- 18.2.6.1. Overview
- 18.2.6.2. Products
- 18.2.6.3. SWOT Analysis
- 18.2.6.4. Recent Developments
- 18.2.6.5. Financials (Based on Availability)
- 18.2.7 Jollibee Foods Corporation
- 18.2.7.1. Overview
- 18.2.7.2. Products
- 18.2.7.3. SWOT Analysis
- 18.2.7.4. Recent Developments
- 18.2.7.5. Financials (Based on Availability)
- 18.2.8 The Wendy's Company
- 18.2.8.1. Overview
- 18.2.8.2. Products
- 18.2.8.3. SWOT Analysis
- 18.2.8.4. Recent Developments
- 18.2.8.5. Financials (Based on Availability)
- 18.2.9 Secret Recipe Cakes & Café Sdn Bhd
- 18.2.9.1. Overview
- 18.2.9.2. Products
- 18.2.9.3. SWOT Analysis
- 18.2.9.4. Recent Developments
- 18.2.9.5. Financials (Based on Availability)
- 18.2.10 Tung Lok Restaurants (2000) Ltd
- 18.2.10.1. Overview
- 18.2.10.2. Products
- 18.2.10.3. SWOT Analysis
- 18.2.10.4. Recent Developments
- 18.2.10.5. Financials (Based on Availability)
- 18.2.11 Domino's Pizza Enterprises Ltd
- 18.2.11.1. Overview
- 18.2.11.2. Products
- 18.2.11.3. SWOT Analysis
- 18.2.11.4. Recent Developments
- 18.2.11.5. Financials (Based on Availability)
- 18.2.12 Starbucks Corporation
- 18.2.12.1. Overview
- 18.2.12.2. Products
- 18.2.12.3. SWOT Analysis
- 18.2.12.4. Recent Developments
- 18.2.12.5. Financials (Based on Availability)
- 18.2.13 Marrybrown Sdn Bhd
- 18.2.13.1. Overview
- 18.2.13.2. Products
- 18.2.13.3. SWOT Analysis
- 18.2.13.4. Recent Developments
- 18.2.13.5. Financials (Based on Availability)
- 18.2.14 Minor International PCL
- 18.2.14.1. Overview
- 18.2.14.2. Products
- 18.2.14.3. SWOT Analysis
- 18.2.14.4. Recent Developments
- 18.2.14.5. Financials (Based on Availability)
- 18.2.15 Restaurant Brands International Inc
- 18.2.15.1. Overview
- 18.2.15.2. Products
- 18.2.15.3. SWOT Analysis
- 18.2.15.4. Recent Developments
- 18.2.15.5. Financials (Based on Availability)
- 18.2.16 McDonald's Corporation
- 18.2.16.1. Overview
- 18.2.16.2. Products
- 18.2.16.3. SWOT Analysis
- 18.2.16.4. Recent Developments
- 18.2.16.5. Financials (Based on Availability)
- 18.2.1 Zen Corporation Group PC
List of Figures
- Figure 1: Global Southeast Asia Food Service Market Revenue Breakdown (Million, %) by Region 2024 & 2032
- Figure 2: Asia Pacific Southeast Asia Food Service Market Revenue (Million), by Country 2024 & 2032
- Figure 3: Asia Pacific Southeast Asia Food Service Market Revenue Share (%), by Country 2024 & 2032
- Figure 4: North America Southeast Asia Food Service Market Revenue (Million), by Foodservice Type 2024 & 2032
- Figure 5: North America Southeast Asia Food Service Market Revenue Share (%), by Foodservice Type 2024 & 2032
- Figure 6: North America Southeast Asia Food Service Market Revenue (Million), by Outlet 2024 & 2032
- Figure 7: North America Southeast Asia Food Service Market Revenue Share (%), by Outlet 2024 & 2032
- Figure 8: North America Southeast Asia Food Service Market Revenue (Million), by Location 2024 & 2032
- Figure 9: North America Southeast Asia Food Service Market Revenue Share (%), by Location 2024 & 2032
- Figure 10: North America Southeast Asia Food Service Market Revenue (Million), by Country 2024 & 2032
- Figure 11: North America Southeast Asia Food Service Market Revenue Share (%), by Country 2024 & 2032
- Figure 12: South America Southeast Asia Food Service Market Revenue (Million), by Foodservice Type 2024 & 2032
- Figure 13: South America Southeast Asia Food Service Market Revenue Share (%), by Foodservice Type 2024 & 2032
- Figure 14: South America Southeast Asia Food Service Market Revenue (Million), by Outlet 2024 & 2032
- Figure 15: South America Southeast Asia Food Service Market Revenue Share (%), by Outlet 2024 & 2032
- Figure 16: South America Southeast Asia Food Service Market Revenue (Million), by Location 2024 & 2032
- Figure 17: South America Southeast Asia Food Service Market Revenue Share (%), by Location 2024 & 2032
- Figure 18: South America Southeast Asia Food Service Market Revenue (Million), by Country 2024 & 2032
- Figure 19: South America Southeast Asia Food Service Market Revenue Share (%), by Country 2024 & 2032
- Figure 20: Europe Southeast Asia Food Service Market Revenue (Million), by Foodservice Type 2024 & 2032
- Figure 21: Europe Southeast Asia Food Service Market Revenue Share (%), by Foodservice Type 2024 & 2032
- Figure 22: Europe Southeast Asia Food Service Market Revenue (Million), by Outlet 2024 & 2032
- Figure 23: Europe Southeast Asia Food Service Market Revenue Share (%), by Outlet 2024 & 2032
- Figure 24: Europe Southeast Asia Food Service Market Revenue (Million), by Location 2024 & 2032
- Figure 25: Europe Southeast Asia Food Service Market Revenue Share (%), by Location 2024 & 2032
- Figure 26: Europe Southeast Asia Food Service Market Revenue (Million), by Country 2024 & 2032
- Figure 27: Europe Southeast Asia Food Service Market Revenue Share (%), by Country 2024 & 2032
- Figure 28: Middle East & Africa Southeast Asia Food Service Market Revenue (Million), by Foodservice Type 2024 & 2032
- Figure 29: Middle East & Africa Southeast Asia Food Service Market Revenue Share (%), by Foodservice Type 2024 & 2032
- Figure 30: Middle East & Africa Southeast Asia Food Service Market Revenue (Million), by Outlet 2024 & 2032
- Figure 31: Middle East & Africa Southeast Asia Food Service Market Revenue Share (%), by Outlet 2024 & 2032
- Figure 32: Middle East & Africa Southeast Asia Food Service Market Revenue (Million), by Location 2024 & 2032
- Figure 33: Middle East & Africa Southeast Asia Food Service Market Revenue Share (%), by Location 2024 & 2032
- Figure 34: Middle East & Africa Southeast Asia Food Service Market Revenue (Million), by Country 2024 & 2032
- Figure 35: Middle East & Africa Southeast Asia Food Service Market Revenue Share (%), by Country 2024 & 2032
- Figure 36: Asia Pacific Southeast Asia Food Service Market Revenue (Million), by Foodservice Type 2024 & 2032
- Figure 37: Asia Pacific Southeast Asia Food Service Market Revenue Share (%), by Foodservice Type 2024 & 2032
- Figure 38: Asia Pacific Southeast Asia Food Service Market Revenue (Million), by Outlet 2024 & 2032
- Figure 39: Asia Pacific Southeast Asia Food Service Market Revenue Share (%), by Outlet 2024 & 2032
- Figure 40: Asia Pacific Southeast Asia Food Service Market Revenue (Million), by Location 2024 & 2032
- Figure 41: Asia Pacific Southeast Asia Food Service Market Revenue Share (%), by Location 2024 & 2032
- Figure 42: Asia Pacific Southeast Asia Food Service Market Revenue (Million), by Country 2024 & 2032
- Figure 43: Asia Pacific Southeast Asia Food Service Market Revenue Share (%), by Country 2024 & 2032
List of Tables
- Table 1: Global Southeast Asia Food Service Market Revenue Million Forecast, by Region 2019 & 2032
- Table 2: Global Southeast Asia Food Service Market Revenue Million Forecast, by Foodservice Type 2019 & 2032
- Table 3: Global Southeast Asia Food Service Market Revenue Million Forecast, by Outlet 2019 & 2032
- Table 4: Global Southeast Asia Food Service Market Revenue Million Forecast, by Location 2019 & 2032
- Table 5: Global Southeast Asia Food Service Market Revenue Million Forecast, by Region 2019 & 2032
- Table 6: Global Southeast Asia Food Service Market Revenue Million Forecast, by Country 2019 & 2032
- Table 7: China Southeast Asia Food Service Market Revenue (Million) Forecast, by Application 2019 & 2032
- Table 8: Japan Southeast Asia Food Service Market Revenue (Million) Forecast, by Application 2019 & 2032
- Table 9: India Southeast Asia Food Service Market Revenue (Million) Forecast, by Application 2019 & 2032
- Table 10: South Korea Southeast Asia Food Service Market Revenue (Million) Forecast, by Application 2019 & 2032
- Table 11: Taiwan Southeast Asia Food Service Market Revenue (Million) Forecast, by Application 2019 & 2032
- Table 12: Australia Southeast Asia Food Service Market Revenue (Million) Forecast, by Application 2019 & 2032
- Table 13: Rest of Asia-Pacific Southeast Asia Food Service Market Revenue (Million) Forecast, by Application 2019 & 2032
- Table 14: Global Southeast Asia Food Service Market Revenue Million Forecast, by Foodservice Type 2019 & 2032
- Table 15: Global Southeast Asia Food Service Market Revenue Million Forecast, by Outlet 2019 & 2032
- Table 16: Global Southeast Asia Food Service Market Revenue Million Forecast, by Location 2019 & 2032
- Table 17: Global Southeast Asia Food Service Market Revenue Million Forecast, by Country 2019 & 2032
- Table 18: United States Southeast Asia Food Service Market Revenue (Million) Forecast, by Application 2019 & 2032
- Table 19: Canada Southeast Asia Food Service Market Revenue (Million) Forecast, by Application 2019 & 2032
- Table 20: Mexico Southeast Asia Food Service Market Revenue (Million) Forecast, by Application 2019 & 2032
- Table 21: Global Southeast Asia Food Service Market Revenue Million Forecast, by Foodservice Type 2019 & 2032
- Table 22: Global Southeast Asia Food Service Market Revenue Million Forecast, by Outlet 2019 & 2032
- Table 23: Global Southeast Asia Food Service Market Revenue Million Forecast, by Location 2019 & 2032
- Table 24: Global Southeast Asia Food Service Market Revenue Million Forecast, by Country 2019 & 2032
- Table 25: Brazil Southeast Asia Food Service Market Revenue (Million) Forecast, by Application 2019 & 2032
- Table 26: Argentina Southeast Asia Food Service Market Revenue (Million) Forecast, by Application 2019 & 2032
- Table 27: Rest of South America Southeast Asia Food Service Market Revenue (Million) Forecast, by Application 2019 & 2032
- Table 28: Global Southeast Asia Food Service Market Revenue Million Forecast, by Foodservice Type 2019 & 2032
- Table 29: Global Southeast Asia Food Service Market Revenue Million Forecast, by Outlet 2019 & 2032
- Table 30: Global Southeast Asia Food Service Market Revenue Million Forecast, by Location 2019 & 2032
- Table 31: Global Southeast Asia Food Service Market Revenue Million Forecast, by Country 2019 & 2032
- Table 32: United Kingdom Southeast Asia Food Service Market Revenue (Million) Forecast, by Application 2019 & 2032
- Table 33: Germany Southeast Asia Food Service Market Revenue (Million) Forecast, by Application 2019 & 2032
- Table 34: France Southeast Asia Food Service Market Revenue (Million) Forecast, by Application 2019 & 2032
- Table 35: Italy Southeast Asia Food Service Market Revenue (Million) Forecast, by Application 2019 & 2032
- Table 36: Spain Southeast Asia Food Service Market Revenue (Million) Forecast, by Application 2019 & 2032
- Table 37: Russia Southeast Asia Food Service Market Revenue (Million) Forecast, by Application 2019 & 2032
- Table 38: Benelux Southeast Asia Food Service Market Revenue (Million) Forecast, by Application 2019 & 2032
- Table 39: Nordics Southeast Asia Food Service Market Revenue (Million) Forecast, by Application 2019 & 2032
- Table 40: Rest of Europe Southeast Asia Food Service Market Revenue (Million) Forecast, by Application 2019 & 2032
- Table 41: Global Southeast Asia Food Service Market Revenue Million Forecast, by Foodservice Type 2019 & 2032
- Table 42: Global Southeast Asia Food Service Market Revenue Million Forecast, by Outlet 2019 & 2032
- Table 43: Global Southeast Asia Food Service Market Revenue Million Forecast, by Location 2019 & 2032
- Table 44: Global Southeast Asia Food Service Market Revenue Million Forecast, by Country 2019 & 2032
- Table 45: Turkey Southeast Asia Food Service Market Revenue (Million) Forecast, by Application 2019 & 2032
- Table 46: Israel Southeast Asia Food Service Market Revenue (Million) Forecast, by Application 2019 & 2032
- Table 47: GCC Southeast Asia Food Service Market Revenue (Million) Forecast, by Application 2019 & 2032
- Table 48: North Africa Southeast Asia Food Service Market Revenue (Million) Forecast, by Application 2019 & 2032
- Table 49: South Africa Southeast Asia Food Service Market Revenue (Million) Forecast, by Application 2019 & 2032
- Table 50: Rest of Middle East & Africa Southeast Asia Food Service Market Revenue (Million) Forecast, by Application 2019 & 2032
- Table 51: Global Southeast Asia Food Service Market Revenue Million Forecast, by Foodservice Type 2019 & 2032
- Table 52: Global Southeast Asia Food Service Market Revenue Million Forecast, by Outlet 2019 & 2032
- Table 53: Global Southeast Asia Food Service Market Revenue Million Forecast, by Location 2019 & 2032
- Table 54: Global Southeast Asia Food Service Market Revenue Million Forecast, by Country 2019 & 2032
- Table 55: China Southeast Asia Food Service Market Revenue (Million) Forecast, by Application 2019 & 2032
- Table 56: India Southeast Asia Food Service Market Revenue (Million) Forecast, by Application 2019 & 2032
- Table 57: Japan Southeast Asia Food Service Market Revenue (Million) Forecast, by Application 2019 & 2032
- Table 58: South Korea Southeast Asia Food Service Market Revenue (Million) Forecast, by Application 2019 & 2032
- Table 59: ASEAN Southeast Asia Food Service Market Revenue (Million) Forecast, by Application 2019 & 2032
- Table 60: Oceania Southeast Asia Food Service Market Revenue (Million) Forecast, by Application 2019 & 2032
- Table 61: Rest of Asia Pacific Southeast Asia Food Service Market Revenue (Million) Forecast, by Application 2019 & 2032
Frequently Asked Questions
1. What is the projected Compound Annual Growth Rate (CAGR) of the Southeast Asia Food Service Market?
The projected CAGR is approximately 4.64%.
2. Which companies are prominent players in the Southeast Asia Food Service Market?
Key companies in the market include Zen Corporation Group PC, Yum! Brands Inc, Doctor's Associates Inc, Inspire Brands Inc, Thai Beverage PCL, Nando's Group Holdings Limited, Jollibee Foods Corporation, The Wendy's Company, Secret Recipe Cakes & Café Sdn Bhd, Tung Lok Restaurants (2000) Ltd, Domino's Pizza Enterprises Ltd, Starbucks Corporation, Marrybrown Sdn Bhd, Minor International PCL, Restaurant Brands International Inc, McDonald's Corporation.
3. What are the main segments of the Southeast Asia Food Service Market?
The market segments include Foodservice Type, Outlet, Location.
4. Can you provide details about the market size?
The market size is estimated to be USD XX Million as of 2022.
5. What are some drivers contributing to market growth?
Growing Awareness of Functional Benefits of Carotenoids; Consumption of Health and Wellness Products.
6. What are the notable trends driving market growth?
OTHER KEY INDUSTRY TRENDS COVERED IN THE REPORT.
7. Are there any restraints impacting market growth?
High Processing Cost and Low Yield of Natural Food Colors.
8. Can you provide examples of recent developments in the market?
October 2023: Starbucks launched two new drinks with the addition of ice cream in the Philippines.May 2023: Starbucks inaugurated the latest rustic finish store in Bird Paradise, and the structure of the store is designed like a wooden hut.May 2023: Inspire Brands, Inc. launched new butter variants to its Butternut portfolio. These variants include the Plain Butternut, Choco Almond Butternut, Ube Cheese Butternut, Strawberry Butternut, Cheesy Butternut, and Choco Butternut.
9. What pricing options are available for accessing the report?
Pricing options include single-user, multi-user, and enterprise licenses priced at USD 3800, USD 4500, and USD 5800 respectively.
10. Is the market size provided in terms of value or volume?
The market size is provided in terms of value, measured in Million.
11. Are there any specific market keywords associated with the report?
Yes, the market keyword associated with the report is "Southeast Asia Food Service Market," which aids in identifying and referencing the specific market segment covered.
12. How do I determine which pricing option suits my needs best?
The pricing options vary based on user requirements and access needs. Individual users may opt for single-user licenses, while businesses requiring broader access may choose multi-user or enterprise licenses for cost-effective access to the report.
13. Are there any additional resources or data provided in the Southeast Asia Food Service Market report?
While the report offers comprehensive insights, it's advisable to review the specific contents or supplementary materials provided to ascertain if additional resources or data are available.
14. How can I stay updated on further developments or reports in the Southeast Asia Food Service Market?
To stay informed about further developments, trends, and reports in the Southeast Asia Food Service Market, consider subscribing to industry newsletters, following relevant companies and organizations, or regularly checking reputable industry news sources and publications.
Methodology
Step 1 - Identification of Relevant Samples Size from Population Database


Step 2 - Approaches for Defining Global Market Size (Value, Volume* & Price*)

Note*: In applicable scenarios
Step 3 - Data Sources
Primary Research
- Web Analytics
- Survey Reports
- Research Institute
- Latest Research Reports
- Opinion Leaders
Secondary Research
- Annual Reports
- White Paper
- Latest Press Release
- Industry Association
- Paid Database
- Investor Presentations

Step 4 - Data Triangulation
Involves using different sources of information in order to increase the validity of a study
These sources are likely to be stakeholders in a program - participants, other researchers, program staff, other community members, and so on.
Then we put all data in single framework & apply various statistical tools to find out the dynamic on the market.
During the analysis stage, feedback from the stakeholder groups would be compared to determine areas of agreement as well as areas of divergence


